
Abstrak
Penggunaan peredam massa selaras (PMS) telah banyak digunakan sebagai alat kontrol getaran pada bangunan, khususnya bangunan-bangunan tinggi. PMS adalah salah satu kontrol pasif yang digunakan untuk mengurangi respon getaran dari struktur akibat beban-beban dinamik seperti angin, atau gempa. PMS menggunakan berat sendiri untuk mengurangi getaran, frekuensi dari PMS disesuaikan dengan frekuensi dari struktur sehingga beresonansi satu sama lain untuk mengurangi respon dari struktur selama berlangsungnya beban dinamik. Berdasarkan hal tersebut, ada tiga variabel yang mempunyai efek yang signifikan terhadap performa dari PMS, antara lain: rasio massa PMS (), rasio frekuensi PMS (), dan rasio redaman PMS () yang akan berhubungan langsung dengan dua parameter penting dari PMS yaitu kekakuan dan redaman dari PMS. Tulisan ini mengusulkan persamaan empirik untuk mendapatkan properti optimum dari PMS dengan menggunakan fungsi kontrol H2 dan algoritma fast multi swarm optimization. Fungsi objektif yang digunakan adalah untuk meminimumkan respon percepatan dan perpindahan dari struktur. Data rekaman El-Centro 1940 NS dipilih sebagai data percepatan tanah dasar untuk mensimulasikan respon dari struktur dengan dan tanpa menggunakan PMS. Hasil menunjukkan terdapat korelasi yang kuat antara rasio massa dari PMS terhadap rasio frekuensi dari PMS serta rasio massa dari PMS terhadap rasio redaman dari PMS.
Kata-kata Kunci: Peredam massa selaras, parameter optimum, fast multi swarm optimization.
1. Introduction
In a few decades, TMD has been adopted in structural building especially in high rise (tall) building for vibration controller. The function of TMD is to reduce the dynamic response of building during dynamic loading such as wind load or earthquake load. Dynamic response can be interpreted as displacement response, velocity response, or acceleration response. With TMD, peak of the dynamic response can be reduced. But for obtaining the optimum result, three variables of TMD must be considered wisely to obtain the optimum stiffness and damping of TMD (kd and cd). Therefore, it is important to make a calculation for determining the optimum parameters of TMD. One of the technique which has good result for optimization problem is Fast Multi Swarm Optimization (FMSO). In this paper, FMSO has been applied for determining the optimum parameters of TMD via H2 norm control system.
2. Equation of motion of structure applied TMD
In general, equation of motion of building which attached TMD as follows,
\[(M_o + M_p) \ddot{X}_s + (C_o + C_p) \dot{X}_s + (K_o + K_p) X_s = e_s \ddot{X}_g\] (1)
or
\[M_s \ddot{X}_s + C_s \dot{X}_s + K_s X_s = e_s \ddot{X}_s \tag{2}\] where, M, C, and K are mass matrix, damping matrix, and stiffness matrix respectively, X is displacement vector, e<sub>s</sub> is motion vector relatively to structure, is ground acceleration. "o" and "p" subscript refer to structure without TMD and with TMD. Equation (2) can also be written as state space equation as follows,
\[\dot{Z} = AZ + Ew \tag{3}\] where.
\[Z = \left\{ \frac{\dot{X}_s}{\ddot{X}_s} \right\}, \quad A = \begin{bmatrix} 0 & I \\ -M_s^{-1} K_s & -M_s^{-1} C_s \end{bmatrix}, \quad E = \begin{bmatrix} 0 \\ M_s^{-1} e_s \end{bmatrix}, \text{ and } \quad w = \ddot{x}_g \quad (4)\] with the output of equation (4) can be obtain with equation (5).
\[z = C_z Z \tag{5}\] where, Cz is output matrix which are either displacement or velocity or acceleration or combination of these three response for determining the output vector, z. The objective function which used in this paper was to minimize the displacement and acceleration response of the structure and H<sub>2</sub> norm has been used for the control system. Hence, the equation (3) can be rewritten as (Arfiadi, 2000),
\[\dot{Z} = AZ + Ew \tag{6}\]
\[z = C_z Z \tag{7}\]
\[J = [tr(C_z L_c C_z^T)]^{1/2} \longrightarrow \text{Minimum}\] (8)
\[A^{T}L_{O} + L_{C}A^{T} + EE^{T} = 0 (9)\] where, J is performance index, tr is summation of diagonal value of matrix, Lc is controllability Grammians.
3. Fast multi swarm optimization (FMSO)
Fast multi swarm optimization is one of techniques that have a good result for optimization process. Fast multi swarm optimization is derived from particle swarm optimization (PSO) which was first proposed by J. Kennedy and Eberhart (1995). Theory of particle swarm optimization is based on the behavior of insects or birds swarm. Social behavior consists of individual action and the influence of other individuals within a group. For example, a bird in a flock of birds. Any individual or particles behave in a distributed manner by using its intelligence and also will influence the behavior of the collective group. Thus, if one particle or a bird finding his way or short to get to the food source, the rest of the group will also be able to immediately follow that path although they are far from the location of the group. The basic equation of particle swarm optimization used to update the position and location of the particle is:
\[v_{i,j}(t+1) = wv_{i,j}(t) + c_1 R_1(p_{best,i,j} - x_{i,j}(t)) + c_2 R_2(g_{best,i,j} - x_{i,j}(t))\] (10)
\[x_{i,j}(t+1) = x_{i,j}(t) + v_{i,j}(t+1)\] (11)
where: \(v_{i,i}\) (t+1) is updated velocity of particle, \(x_{i,i}\) (t+1) is updated location of particle, t represent the iterationt, \(p_{best,i,j}\) is local best location of particle at t-iteration, \(g_{best,i,j}\) is global best location of particle at t-iteration. \(R_I\)and \(R_2\) are random number from interval 0-1, \(c_1\) and \(c_2\)are particle acceleration constants, in this paper, \(c_1 = c_2\)= 2, and w is positive inertia weight coefficient which is a function \(\rho_{\min}\) and \(\rho_{\max}\) as follow:
\[w_{(t)} = \rho_{\text{max}} - ((\rho_{\text{max}} - \rho_{\text{min}}) t / \max t)\] (12)
In PSO, each particle shares the information with its neighbors. PSO combines the cognition component of each particle with the social component of all the particles in a group. Although the speed of convergence is very fast, Once PSO traps into local optimum, it is difficult to jump out of local optimum. Therefore, the addition of a mutation operator to PSO will enhance its global search capacity and thus improve its performance. In order to prevent of falling to a local optimum, a new technique using combination of Cauchy mutation and crossover operation which is called fast multi swarm optimization (FMSO) was introduced by Zhang et al (2007). Similar to distributed genetic algorithm, multiple swarm's idea is very useful for speeding up the search. The new information of exchanging and sharing mechanisms of FMSO makes it converge fast to the global optimum.
Whenever the particle converges, it will "fly" to the personal best position and the global best particle's position. Due to this information of sharing mechanism makes the speed of convergence of PSO is very fast. Meanwhile, because of this mechanism, PSO cannot guarantee to find global optimum value of function. In fact, the particles are usually converge to local optima. Without loss of generality, only function minimization is discussed here. Once the particles trap into a local optimum, in which \(p_{best,i,j}\) can be assumed to be the same as \(g_{best,i,j}\), all the particles converge to \(g_{best,i,j}\). At this condition, the velocity's update equation becomes:
\[v_{i,j(t+1)} = \omega v_{i,j(t)} \tag{13}\]
When the iteration in the equation (13) goes to infinite, the velocity of the particle \(v_{i,j}\) will be closed to 0 because of \(0 \le \omega < 1\). After that, the position of the particle \(x_{i,j}\) will not change, so that PSO has no capability of jumping out of the local optimum. It is the reason that PSO often fails on finding the global minimal value. To overcome the weakness of PSO discussed at the middle of this section, the Cauchy mutation is incorporated into PSO algorithm. The basic idea is that, the velocity and position of a particle are updated not only according to equation (10) and (11), but also according to Cauchy mutation as follows:
\[x_{i,j(t+1)} = x_{i,j(t)} + (v_{i,j(t)} \exp(\delta_i))\delta\] (14)
where, \(\delta_i\), and \(\delta\) denotes Cauchy random numbers.
Since the expectation of Cauchy distribution does not exist, the variance of Cauchy distribution is infinite so that Cauchy mutation could make a particle have a long jump. By adding the update equations of (14), PSO greatly increases the probability of escaping from the local optimum.
For crossover operation, for rand() \(< q_c\) the crossover operation is taken as follows:
\[x_{i,j(t+1)} = (1 - \alpha).x_{i,j(t)} + \alpha.p_{best,i,j}\] (15)
\[v_{i,j(t+1)} = rand().(p_{best,i,j} - x_{i,j(t)})\] (16)
where, \(\alpha\) is random number with 0-1 interval, \(q_c\) is crossover rate.
4. Application
Considered one story frame with shear building assumption as shown on Figure 1. Table 1 shows five variations of structural stiffness with fixed mass used.
Table 1. One story frame properties
| Frame | m | k | С |
| number | (ton) | (kN/m) | (kN-s/m) |
| 1 | 115 | 6740.74 | 352.178 |
| 2 | 115 | 2778.94 | 226.125 |
| 3 | 115 | 1500 | 166.132 |
| 4 | 115 | 723.38.00 | 11.537 |
| 5 | 115 | 474.61 | 9.345 |
Figure 1. One story building with TMD
TMD was applied to this structure to minimize the peak displacement and peak acceleration response using H<sub>2</sub> norm control system and FMSO. In order to develop empirical equation for determining the optimum parameters, the relationship between three variables have been considered. Optimization parameters of FMSO can be seen on Table 2.
Table 2. Optimization parameters
| Swarm population | 20 |
| Maximum velocity | 10 |
| Maximum iteration | 200 |
| Rho maximum (\(\rho_{\text{max}}\)) | 00.09 |
| Rho minimum (\(\rho_{min}\)) | 00.04 |
| Crossover rate | 00.08 |
The program has been run for four times with different lower and upper bound to see the consistency of the result. Lower bound value and upper bound value are interval value in domain area. The units are kN/m for damper's stiffness and kN-s/m for damper's damping. Lower and upper bound value can be found on Table 3.
Table 3. Lower and upper bound of each run
| Run | Lower Bound | Upper Bound |
|---|---|---|
| 1 | 0 | 1000 |
| 2 | 0 | 10 |
| 3 | 0 | 100 |
| 4 | 30 | 100 |
Mass ratio was taken 1.2%, 1.8%, 2.6%, 3.4%, and 4.2% from mass of structure. The result will be compared to find out the behavior of TMD with different mass ratio and to obtain the relationship between the mass ratio to frequency ratio and mass ratio to damping ratio. Fitness value was considered as a number to define the H<sub>2</sub> norm value (J) which the objective function is to minimize the J value. The lower of fitness value, the higher of TMD performance to reduce the response of structure during dynamic external disturbance. To obtain the optimum fitness value, the program was run for 200 iterations with each different lower and upper bound. If each run produces similar result (consistency), it can be concluded that the optimum fitness value has obtained. Figure 2 shows decreasing of fitness of each iteration for 1.8% of mass ratio with minimization of peak displacement while Figure 3 shows the minimization of peak acceleration using H<sub>2</sub> norm control function. The
Table 4. Mass ratio and natural frequency of structure with k = 6740.74 kN/m and c = 35.2178 kN-s/m
| Mass | \(\omega_{\text{structure}}\left(\text{rad/s}\right)\) | |||
|---|---|---|---|---|
| ratio | Undamped | Minimum displacement | Minimum acceleration | |
| 0.012 | 76.561 | 71.684 | 72.123 | |
| 0.018 | 76.561 | 70.487 | 71.080 | |
| 0.026 | 76.561 | 69.131 | 69.918 | |
| 0.034 | 76.561 | 67.943 | 68.916 | |
| 0.042 | 76.561 | 66.866 | 68.019 | |
consistency of result can be seen, there is no different of result in spite of different on lower and upper bound. Hence, the result is convergent.
Natural frequency of structure with certain stiffness which without and with TMD can be seen on Table 4 until Table 8. As shown on Table 4 until Table 8, increasing of mass ratio lead decreasing of the natural frequency of structure which attached TMD for all cases of stiffness variations and for all objective function (minimization of displacement and minimization of acceleration).
Table 5. Mass ratio and natural frequency of structure with k = 2778.94 kN/m and c = 22.6125 kN-s/m
| Mass | structure (rad/s) | ||
|---|---|---|---|
| ratio | Undamped | Minimum displacement | Minimum acceleration |
| 0.012 | 49.158 | 46.027 | 46.309 |
| 0.018 | 49.158 | 45.258 | 45.639 |
| 0.026 | 49.158 | 44.388 | 44.893 |
| 0.034 | 49.158 | 43.624 | 44.249 |
| 0.042 | 49.158 | 42.933 | 43.674 |
Table 6. Mass ratio and natural frequency of structure with k = 1500 kN/m and c = 16.6132 kN-s/m
| Mass | structure (rad/s) | ||||
|---|---|---|---|---|---|
| ratio | undamped | Minimum displacement | Minimum acceleration | ||
| 0.012 | 36.116 | 33.816 | 34.023 | ||
| 0.018 | 36.116 | 33.251 | 33.530 | ||
| 0.026 | 36.116 | 32.611 | 32.982 | ||
| 0.034 | 36.116 | 32.050 | 32.509 | ||
| 0.042 | 36.116 | 31.543 | 32.087 | ||
Table 9 and 10 show peak displacement and peak acceleration result of structure subjected to accelerogram El-Centro 1940 NS respectively using time history analysis in order to minimize the displacement and acceleration response of the structure.
Based on the result, the peak displacement and peak acceleration decreased significantly when TMD applied. It should be noted that there needs to be further review about the maximum mass ratio which potentially increasing the total mass of building. The other variable which must considered further is building which has long period because this paper only
Table 7. Mass ratio and natural frequency of structure with k= 723.38 kN/m and c = 11.537 kN-s/m
| Mass | structure (rad/s) | ||||
|---|---|---|---|---|---|
| ratio | Undamped | Minimum displacement | Minimum acceleration | ||
| 0.012 | 25.052 | 23.483 | 23.627 | ||
| 0.018 | 25.052 | 23.091 | 23.285 | ||
| 0.026 | 25.052 | 22.647 | 22.904 | ||
| 0.034 | 25.052 | 22.257 | 22.576 | ||
| 0.042 | 25.052 | 21.905 | 22.282 | ||
Table 8. Mass ratio and natural frequency of structure with k = 474.61 kN/m and c = 9.345 kN-s/m
| structure (rad/s) | |||
|---|---|---|---|
| Mass ratio Undamped | Minimum displacement | Minimum acceleration | |
| 0.012 | 20.315 | 19.021 | 19.138 |
| 0.018 | 20.315 | 18.704 | 18.861 |
| 0.026 | 20.315 | 18.344 | 18.553 |
| 0.034 | 20.315 | 18.028 | 18.287 |
| 0.042 | 20.315 | 17.743 | 18.049 |
Table 9. Peak displacement of structure without and with TMD subjected to El Centro 1940-NS
| Peak Displacement (m) | |||||
|---|---|---|---|---|---|
| Mass Ratio | Frame Number | ||||
| 1 | 2 | 3 | 4 | 5 | |
| without TMD | 0,936111111 | 0,858333333 | 1,272222222 | 2,233333333 | 2,328472222 |
| 0.012 | 0,691666667 | 0,803472222 | 1,109722222 | 2,101388889 | 1,910416667 |
| 0.018 | 0,677777778 | 0,793055556 | 1,041666667 | 2,045138889 | 1,880555556 |
| 0.026 | 0,664583333 | 0,783333333 | 1,039583333 | 1,976388889 | 1,842361111 |
| 0.034 | 0,652777778 | 0,777083333 | 1,040277778 | 1,9125 | 1,807638889 |
| 0.042 | 0,640972222 | 0,772222222 | 1,038194444 | 1,854166667 | 1,775 |
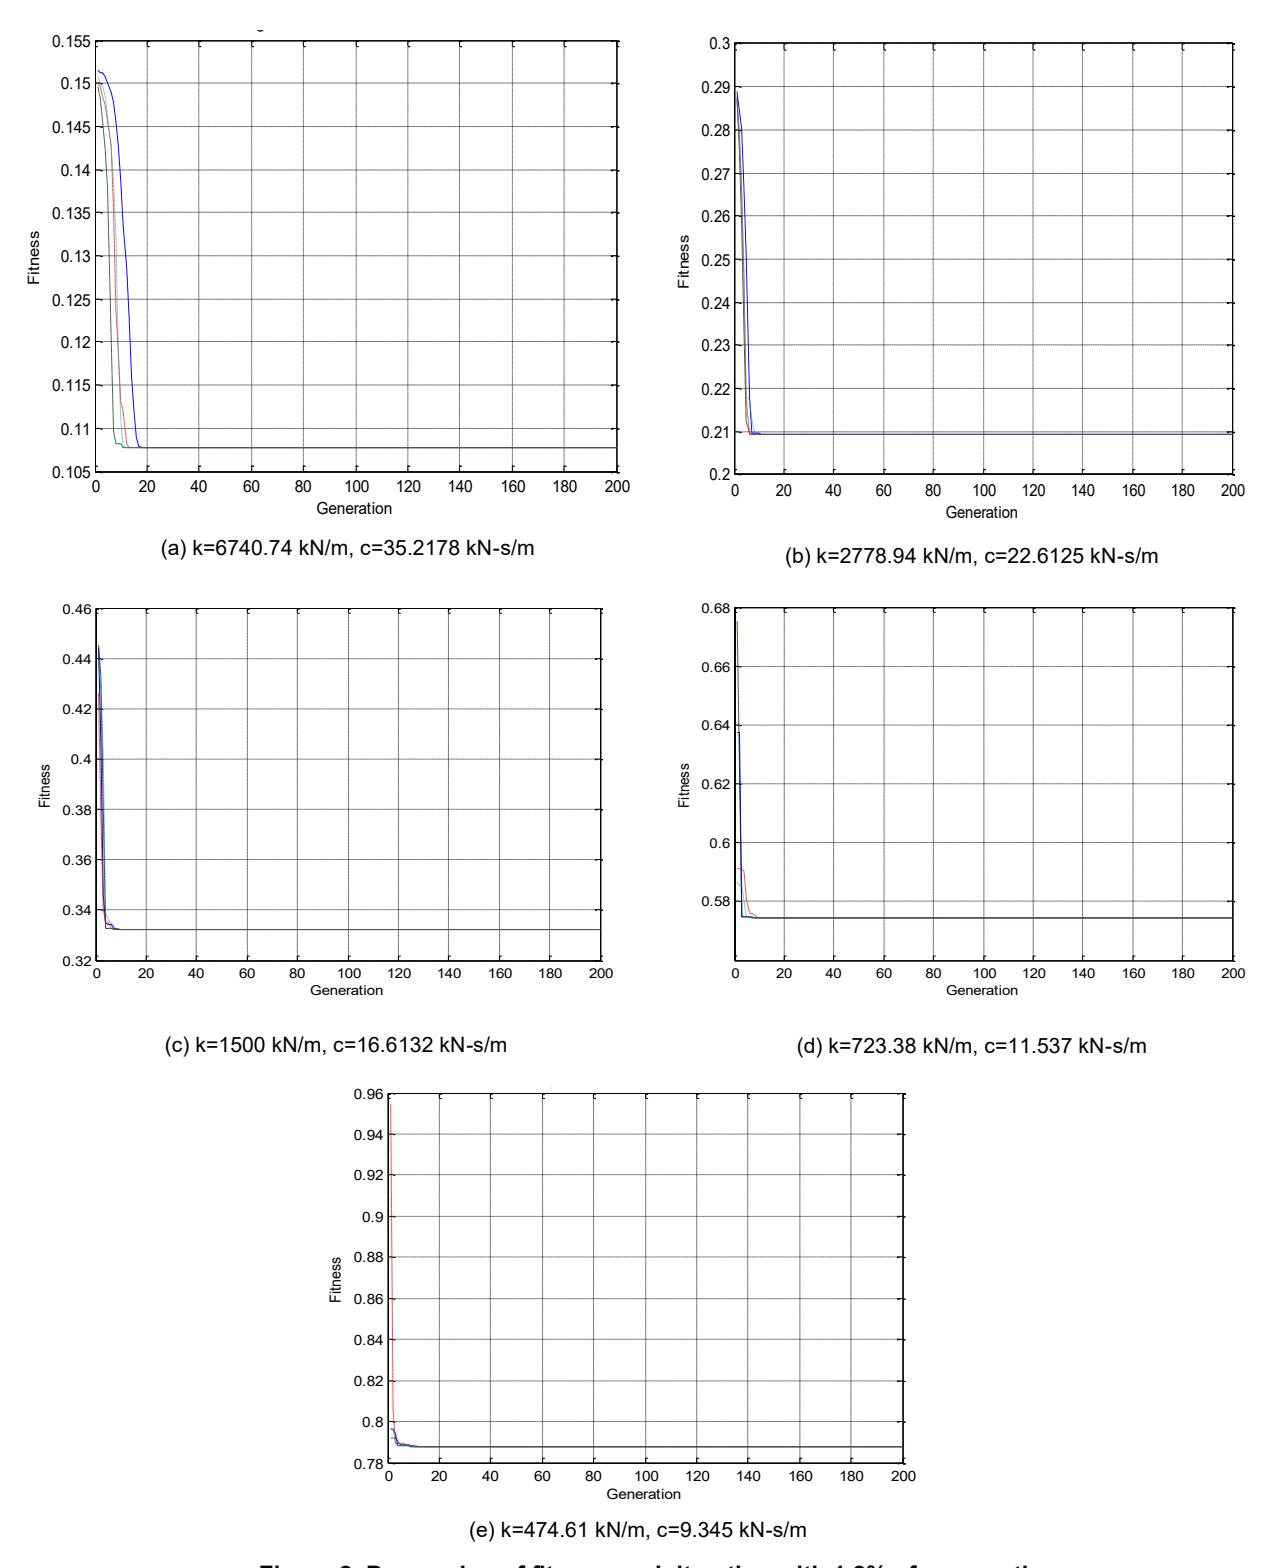
Figure 2. Decreasing of fitness each iteration with 1.8% of mass ratio (objective function: minimization of peak displacement)
considered building with short period of natural frequency. Due to space limitation, only the displacement response versus time graph of case 1 shown (Figure 4).
Empirical equations have been developed determining the damping ratio and frequency ratio of
TMD in order to obtain the optimum stiffness and optimum damping of TMD. Figure 5 shows relationship between mass ratio vs damping ratio of TMD. Power regression used for developing empirical equation. The correlation coefficient was 1 which mean there is strong correlation between the mass ratio and damping ratio of TMD. While the relationship between
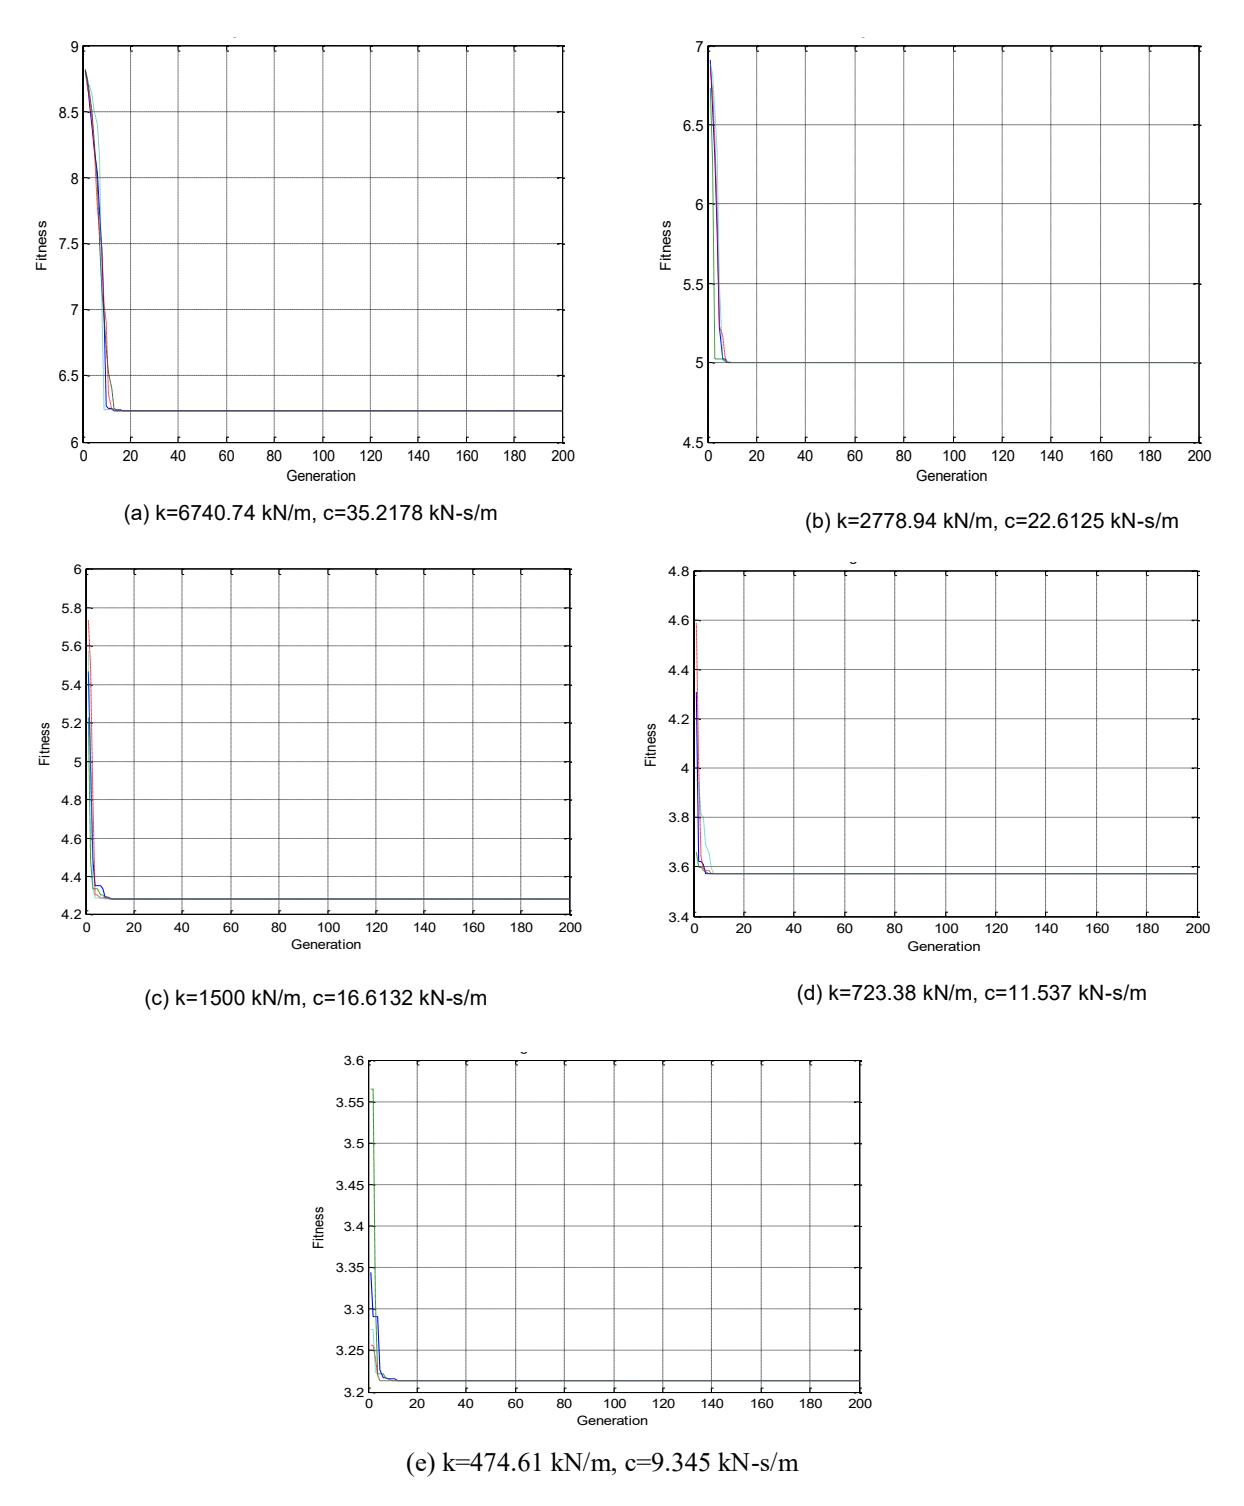
Figure 3. Decreasing of fitness each iteration with 1.8% of mass ratio (objective function: minimization of peak acceleration)
mass ratio vs frequency ratio had one empirical equation caused by optimization result for two objective function was similar (displacement minimization and acceleration minimization), the relationship between mass ratio vs frequency ratio had two empirical equations due to difference of optimization result for each objective function (Figure 6). Second polynomial order used to develop the empirical equation. From Figure 6, it can be seen the correlation coefficient was also 1.
5. Conclusions
One story fixed mass building with various building's stiffness considered. From the result, building which used TMD has a better result compared with building
Table 10. Peak acceleration of structure without and with TMD subjected to El Centro 1940-NS
| Peak Acceleration (m/s2 ) | |||||
|---|---|---|---|---|---|
| Mass Ratio | Frame Number | ||||
| 1 | 2 | 3 | 4 | 5 | |
| without TMD | 75.491 | 50.232 | 40.532 | 37.478 | 30.440 |
| 0.012 | 58.218 | 28.029 | 20.610 | 19.017 | 11.357 |
| 0.018 | 56.497 | 27.378 | 19.237 | 18.492 | 11.158 |
| 0.026 | 55.132 | 26.651 | 19.032 | 17.856 | 10.906 |
| 0.034 | 53.855 | 26.050 | 18.869 | 17.275 | 10.668 |
| 0.042 | 52.625 | 25.518 | 18.698 | 16.740 | 10.442 |
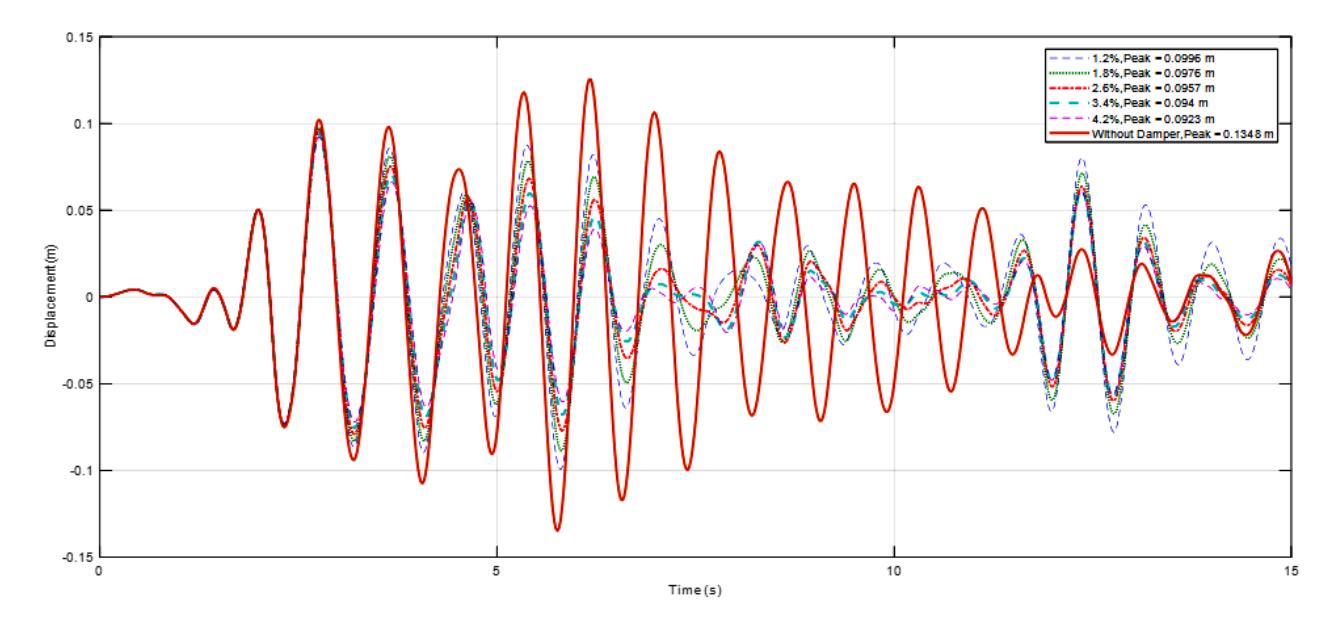
Figure 4. Displacement response of first case structure subjected to El Centro 1940-NS using time history analysis
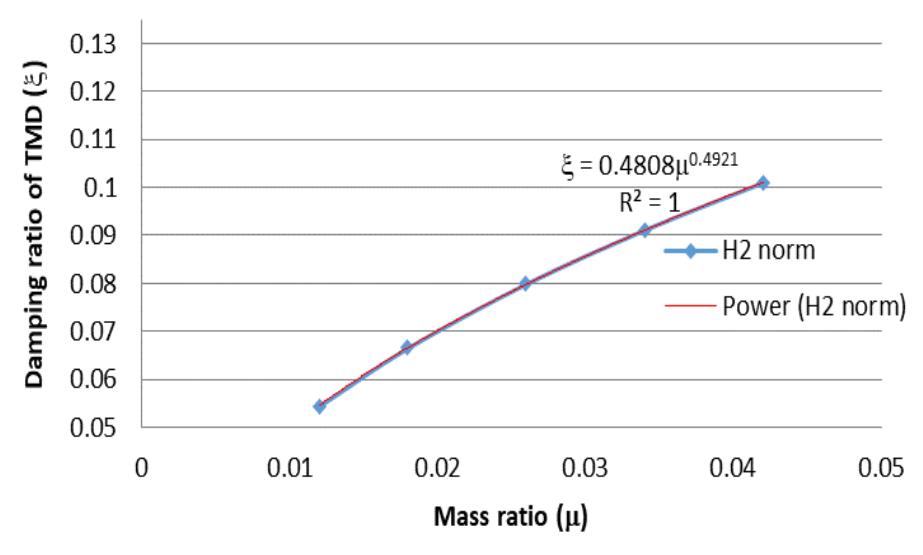
Figure 5. Relationship between mass ratio vs damping ratio of TMD
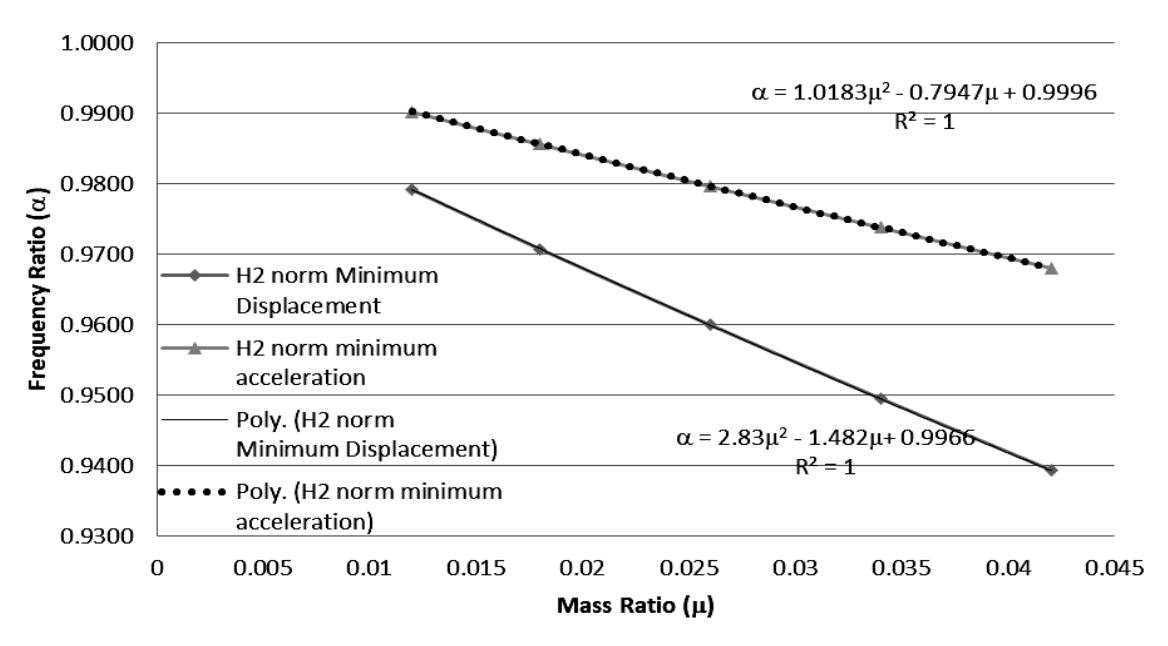
Figure 6. Relationship between mass ratio vs frequency ratio of TMD
without TMD. Empirical equations have been developed for easily determining the optimum parameters (stiffness and damping) of TMD. One empirical equation for obtaining the damping ratio of TMD (0. 0.4921), while two empirical equations were built for obtaining the frequency ratio of TMD which depend of the minimization case. If the case is to minimize the peak displacement of the structure then 2.83 -1.482, if the case is to minimize peak acceleration of structure then 1.0183 -0.7947 It should be noted that the structure which considered in this paper was structure with short natural period, hence must a further review about building structure with long period.