
Abstrak
Evaluasi kondisi Jalan Soekarno Hatta dengan menggunakan metode PCI menunjukan bahwa yang paling banyak di temukan adalah kondisi "Good" baik pada perkerasan kaku maupun perkerasan lentur, dengan persentase masing-masing adalah 61,9 % dan 21,6 %. Sedangkan dengan menggunakan metode PSI yang paling banyak di temukan adalah kondisi "Fair" baik pada perkerasan kaku maupun perkerasan lentur, dengan persentase masingmasing adalah 81 % dan 48,9 %. Dengan menggunakan metode SDI pada perkerasan lentur yang paling sering di temukan adalah kondisi "Sedang" dengan persentase 65,9 %. Analisis parametrik antara PCI dan PSI pada perkerasan kaku menghasilkan nilai \(R^2 = 0.0548\) dengan persamaan regresi yaitu PCI = 96.66 - 3.9352 x PSI, sedangkan korelasi PCI dan PSI pada perkerasan lentur menghasilkan nilai \(R^2 = 0.8163\) dengan persamaan regresi yaitu \(PCI = 27,673 + 16,848 \times PSI\), dan korelasi PCI dan SDI pada perkerasan lentur menghasilkan nilai \(R^2\)0,8653 dengan persamaan regresi yaitu PCI = 94,663 - 0,4462 x SDI. Analisis non parametrik antara PCI dan PSI pada perkerasan kaku menghasilkan nilai koefisien korelasi sebesar 0,043 , sedangkan nilai PCI dan PSI pada perkerasan lentur menghasilkan nilai koefisien korelasi sebesar 0,397, dan nilai PCI dan SDI pada perkerasan lentur menghasilkan nilai koefisien korelasi sebesar 0,492. Berdasarkan kedua metode analisis baik analisis parametrik maupun non parametrik hubungan PCI dan SDI dinilai lebih baik dibandingkan hubungan PCI dan PSI karena menghasilkan nilai \(R^2\) dan koefisien korelasi yang lebih besar.
Kata Kunci: Pavement condition index, present serviceability index, surface distress index, analisis parametrik, analisis non parametrik.
1. Introduction
The selection of the right form of road maintenance is done by evaluating the road surface conditions that can be obtained by a measurement using the Pavement Condition Index (PCI), Present Serviceability Index (PSI) and Surface Distress Index (SDI) methods.
Serviceablity is the ability of certain pavement segments to serve traffic under existing conditions (AASHTO, 1993). The value is made on a scale of 0 - 5. A value of 0 states that the pavement condition has collapsed and a value of 5 states that the pavement is in a very good condition. The Present Serviceability Index (PSI) method has been developed by researchers to be correlated with the International Roughness Index (IRI). Similarly, AASHTO in 1999 also revealed the relationship between PSI and IRI for rigid and flexible pavements.
Surface Distress Index (SDI) is a result of a visual inspection with total damage area, average damage width, number of potholes and rut depth as the data parameters. According to the Guide no. SMD-03/RCS, DJBM, 2011, to determine the functional conditions, it must be combined with the IRI.
Pavement Condition Index (PCI) PCI is an assessment of road pavement conditions that range between 0-100, where the value of 0 indicates the worst condition and the value of 100 indicates the best. PCI is determined through visual surveys including the distress types, distress severity and the distress density.
A research on the relationship between PCI and PSI is expected to be able to eliminate subjectivity in the PCI method. As it has been explained before, the PSI method which is a function of the IRI is obtained objectively because it uses a measuring instrument.
Meanwhile, a research on the relationship between PCI and SDI is expected to reduce the data collection time, because the number of distress types in the SDI method is smaller than the PCI method.
2. Research Methodology
This research was carried out through the following stages:
- a. Collection of primary and secondary data. The primary data for PCI and SDI road conditions were obtained through visual surveys, while the secondary one, in the form of road roughness data, were obtained from P2JN Bandung.
- b. The PCI analysis refers to Shahin's Pavement Management for Airports, Roads, and Parking Lots book. The Present Serviceability Index (PSI) refers to the relationship between the Present Serviceability Index (PSI) and the International Roughness Index (IRI) proposed by AASHTO in 1999. Meanwhile, the Surface Distress Index (SDI) refers to Road Condition Survey Guide no. SMD-03/RCS.
c. The PCI prediction model as a function of both the PSI and PCI was obtained through a simple regression analysis with a linear equation model.
3. Research Location
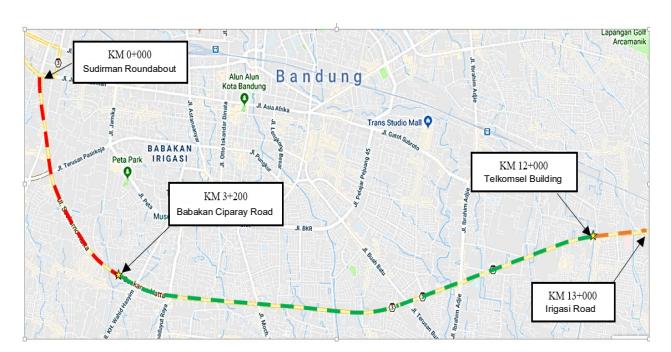
Figure 1. Research location
Figure caption :
: Rigid Pavement (4,2 km) : Flexible Pavement (8,8 km)
The study location for this research is on Jalan Soekarno Hatta, Kota Bandung, starting from the Sudirman roundabout to the intersection of Irigasi road.
4. Data Analysis and Presentation
4.1 Road roughness data
The road surface roughness data presented here was obtained from the measurement of IRI using a tool named Hawkeye 2000. This data, which was the result of a survey conducted in July 2018, was obtained from the West Java P2JN. The average IRI for the rigid pavement is 5.3 and is in the "Medium" category.
Meanwhile, the average IRI for the flexible pavement is 4.6 and is in the "Medium" category. The average IRI was then analysed to obtain the average PSI by using an equation by AASHTO in 1999.
Rigid Pavement
\[PSI_{Average} = 5,769 - 1,589\sqrt{IRI}_{Average}\] \[PSI_{Average} = 5,769 - 1,589\sqrt{5},3 = 2,1\] (1)
Flexible Pavement
\[PSI_{Average} = 5,671 - 1,714\sqrt{IRI}_{Average}\] \[PSI_{Average} = 5,671 - 1,714\sqrt{4},6 = 2,01\] (2)
Based on the analysis of the PSI above, it is shown that the average road conditions for the rigid pavement with a value of 2.1 fall into the "Fair" category, and the average road conditions for the flexible pavement with a value of 2.01 also fall into the "Fair" category.
From the results of the analysis, it can be concluded that PSI and IRI has a strong relationship as explained by the similarity of the average functional conditions between PSI and IRI. The relationship between PSI and IRI is illustrated in the following graph.
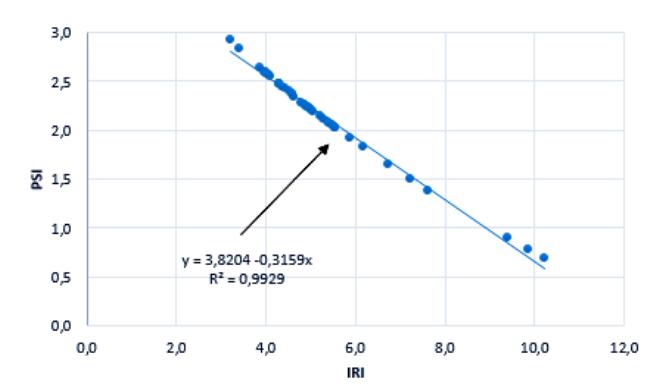
Figure 2. Relationship between the PSI and IRI for the rigid pavement.
The relationship of the regression analysis above has a linear equation, which is \(PSI = 3.8204-0.3159 \times IRI\), with an R<sup>2</sup> value of 0.9929, which means that IRI affects the PSI value of 99.29%.
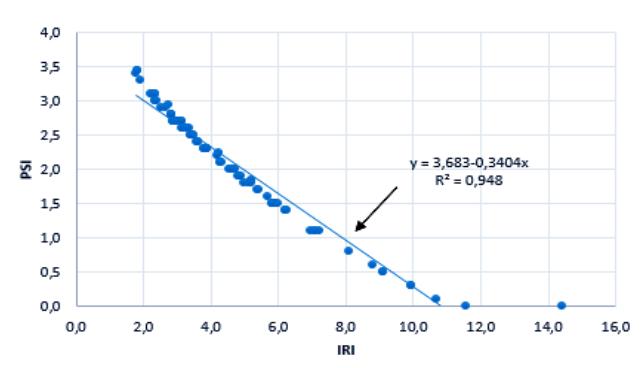
Figure 3. Relationship between the PSI and IRI for the flexible pavement.
The regression analysis relationship above has a linear equation, which is PSI = 3.683-0.3404 x IRI, with an \(R^2\)value of 0.948, which means that IRI affects the PSI of 94.8%.
Each sample unit was then analyzed using the same analysis method. The following is a recapitulation of the PSI calculation on the Soekarno Hatta road segment which is displayed in a graphical form.
From the results of the analysis, it could be concluded that the functional conditions of the rigid pavement roads varied from the lowest condition, namely "Very Poor" with a PSI of 0.7 to the highest condition, "Fair," with a value of 2.9. Meanwhile, the functional conditions of the flexible pavement roads varied from the lowest "very poor" condition with a PSI of 0 and "good" as the highest condition with a PSI of 3.5.
In general, the functional conditions on Soekarno Hatta road, Bandung can be concluded as follows.
4.2 Pavement Condition Index (PCI) analysis
The road condition analysis using the Pavement Condition Index (PCI) method was carried out on the rigid pavement and the flexible pavement on Soekarno Hatta road, Bandung. The road condition data is displayed as follows
Table 1. Road functional condition percentage based on the PSI method
| No | Road Condition | % Road Condition | ||
|---|---|---|---|---|
| NO | Road Condition | Rigid Pavement | Flexible Pavement | |
| 1 | Good | - | 11,4 | |
| 2 | Fair | 81,0 | 48,9 | |
| 3 | Poor | 11,9 | 29,5 | |
| 4 | Very Poor | 7,1 | 10,2 | |
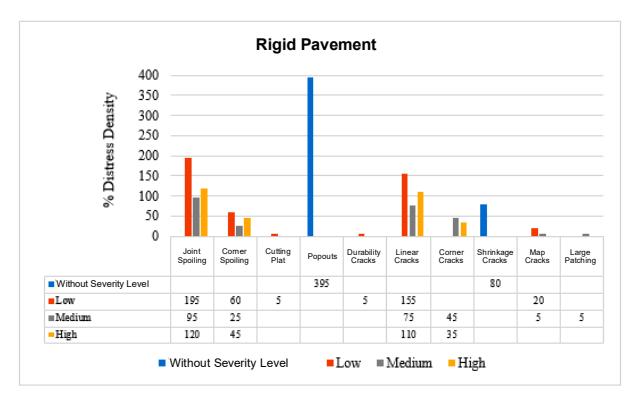
Figure 4. Pavement condition index (PCI) on the rigid pavement
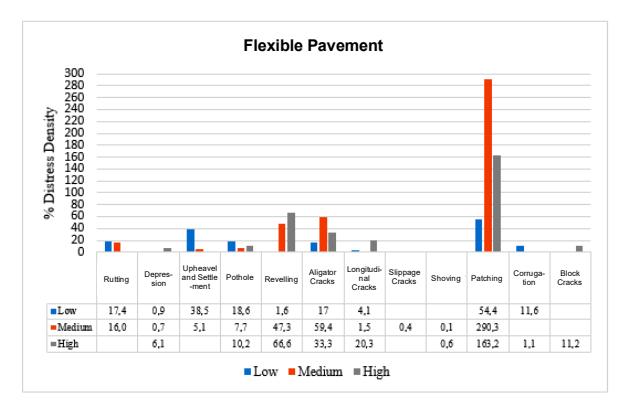
Figure 5. Pavement condition index (PCI) on the flexible pavement
From the survey results, it was found that the type of damage with the highest percentage for the rigid and the flexible pavements were popouts (395%) and patching, with medium severity level of 290,3 %. The pavement distress data mentioned above is the total pavement distress quantity percentage grouped by its severity, then analyzed by the PCI method.
From the analysis results, it was found that the functional conditions of the rigid pavement varied from the lowest condition of "Very Poor" with a PCI of 38, to the highest "Good" condition with a PCI of 100. Meanwhile, for the flexible pavement, the lowest condition was "Serious" with a PCI value of 11, to the highest condition of "Good" with a PCI value of 100.
4.3. Surface Distress Index (SDI) analysis
Analysis of road condition using the Surface Distress Index (SDI) method was carried out on the flexible pavement on Soekarno Hatta road, Bandung. The road condition data is displayed as follows.
Table 2. Flexible pavement functional condition percentage based on the PCI method
| 1 9 | |||||||
|---|---|---|---|---|---|---|---|
| % Road Condition | |||||||
| No | Road Condition | Rigid Pavement | Flexible Pavement | ||||
| 1 | Good | 61,9 | 21,6 | ||||
| 2 | Satisfactory | 21,4 | 12,5 | ||||
| 3 | Fair | 11,9 | 20,5 | ||||
| 4 | Poor | 2,4 | 18,2 | ||||
| 5 | Very Poor | 2,4 | 15,8 | ||||
| 6 | Serious | - | 11,4 | ||||
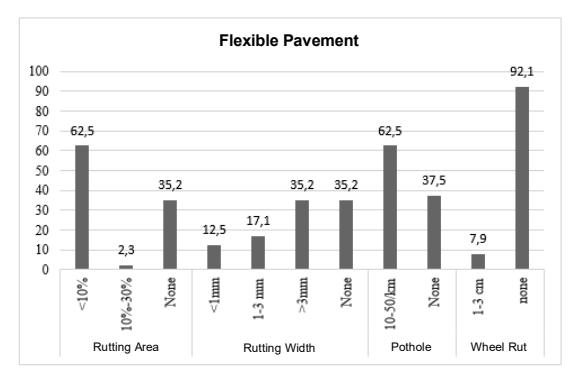
Figure 6. Surface distress Index (SDI) on the flexible pavement
The distress data above was then analyzed based on the Surface Distress Index (SDI) method. From the results of the analysis, it was concluded that the functional condition of the Soekarno Hatta road on the flexible pavement with the SDI method varied from the lowest "Severe Damage" condition with an SDI of 85 and an IRI of 14.4 to the highest condition of "Good" with an SDI of 0 and an IRI value of 1.8.
Table 3. Road functional condition percentage based on the SDI method
| No | Road Condition | % Road Condition |
|---|---|---|
| 1 | Good | 22,7 |
| 2 | Fair | 65,9 |
| 3 | Poor | 10,3 |
| 4 | Very Poor | 1,1 |
4.4 PCI formula analysis
The degree of road damage according to the PCI method is a function of the damage type, the severity of the damage and the amount or quantity of damage. To produce one measure that can represent the three factors, the term "deduct value" was introduced. Therefore, in determining the damage index in the PCI method, deduct value is the main factor that has a significant effect on damage assessment.
This analysis was carried out at the minimum density that occurred in a rigid pavement with segment intervals per 100 m, which was 5%. In the above analysis, all the low, medium, and high severity of blow up damage have a significant effect on the deduct value, which means that the damage gives a significant
disruption to the driver of the vehicle. Where the maximum density for low and medium severity is 100% and deduct values of 45 and 82, which means that it takes 20 low severity slabs which undergo a blow up damage for the "poor" condition and 20 medium severity slabs that undergo a blow up damage for "severe" condition, while the maximum density for high severity is 60% and it has a deduct value of 100, which means that it takes 12 high severity slabs that undergo a blow up damage for "failed" condition. This analysis was carried out on a segment area of 350 m². In addition to the rigid pavement, an analysis on the flexible pavement was also carried out.
This analysis was carried out at the minimum density that occurred in a flexible pavement with a minimum density value of 0.1%. From the three analyzes above, all the low, medium and high severity of the Pothole damage type have a significant effect on the deduct value, which means that the damage gives a significant disruption to the driver of the vehicle. Where for the pothole damage type, the maximum density at the low severity level is 100% and it has a deduct value of 98 which means that it requires 350 potholes for the condition "failed", and at the medium severity level is 16% and it has a deduct value of 100, which means that it requires 56 potholes for the condition "failed", and at the high severity is 8% and it has a deduct value of 100, which means that only 28 potholes are needed for the "failed" condition.
4.5 SDI formula analysis
As known, the SDI is obtained from a formula that is done in stages (accumulatively) from several damage parameters to the road surface, such as cracks, potholes, and rutting. Analysis of the calculation of SDI needs to be done to determine the sensitivity of each measuring parameter that affects its value.
Table 4. Stages of the SDI analysis
| Stage 1 | Stage 2 | ||
|---|---|---|---|
| Cracking Area Percentage | Average Cracking Width | ||
| No Cracking SDI = 0 | No Cracking \(SDI_2 = 0\) | ||
| Area < 10% SDI = 5 | Width <1 mm \(SDI_2 = SDI_1\) | ||
| 10% < Area < 30% SDI = 20 | \(1 \text{mm} < \text{Width} < 3 \text{ mm}\) \(SDI_2 = SDI_1\) | ||
| Area | Width \(>\) 3mm \(SDI_2 = SDI_4*2 = 80\) | ||
| Stage 3 | Stage 4 | ||
| Number of Pothole | Rutting Depth | ||
| No pothole \(SDI_3 = 0\) | No Rutting \(SDI_4 = 0\) | ||
| Pothole < \(10/KM\) SDI3 = SDI2 + 5 | Rutting< 1 cm \(SDI_4 = SDI_3 + 2.5\) | ||
| \(10KM \le Pothole < 50/KM\) \(SDI_3 = SDI_2 + 75\) | 1 cm \(\leq\) Rutting \(\leq\) 3cm \(SDI_4 = SDI_3 + 10\) | ||
| Width \(> 50\)/KM SDI2 = SDI2 + 225 = 305 | Rutting SDI4 = SDI2 + 20 = 325 | ||
From the analysis above, it can be concluded that the lowest SDI that can be obtained is SDI = 0, while for the maximum SDI is SDI = 325. From the accumulative calculation stage above, it can be concluded that the stage 2 (SDI<sub>2</sub>) whose value is influenced by the variables from SDI<sub>1</sub> is unable to stand alone. Next, to know the sensitivity of each calculated parameter above, SDI will be calculated only if one parameter of damage occurs. It is displayed in the following graph.
From the results of the analysis of each damage above, it is known that the rutting damage contributes the smallest
weight among the damages reviewed, and potholes give the most impact.
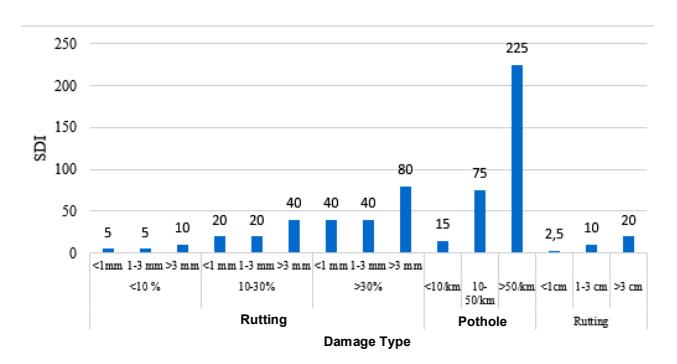
Figure 7. SDI for damage type
4.6 PCI and SDI formula analysis
This study aims to evaluate the PCI and SDI methods by comparing the types of damage that are the same in the PCI method and in the SDI method.
4.6.1 Comparing the effects of cracking on the value of PCI and SDI
This comparison is intended to see the extent of the effect of the cracking damage type on PCI and SDI, with each analysis as follows.
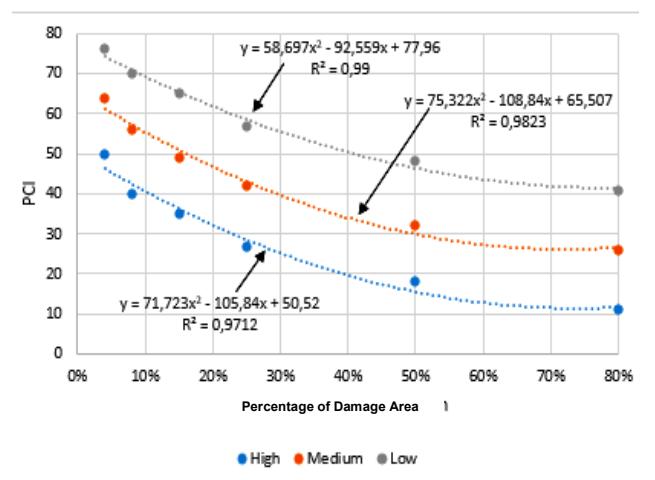
Figure 8. Regression equation for the alligator cracking type damage at low, medium and high levels
Based on the regression equation model above, the change in PCI value due to changes in the percentage of cracking damage area at the high, medium and low severity levels can be predicted by the following polynomial equation models.
\[PCI = 50,52 - 105,84x + 71,732x^{2}\] (3)
with a coefficient of determination (R2 )= 0,9712 on high severity
\[PCI = 65,507 - 108,84x + 75,332x^{2}\] (4)
with a coefficient of determination (R2 )= 0,9823 on medium severity
\[PCI = 77,96 - 92,559x + 58,697x^{2}\] (5)
with a coefficient of determination (R2 )= 0,99 on low severity
Where, x: damage area percentage
The PCI due to changes in the percentage of cracking area can be obtained using the equation above.
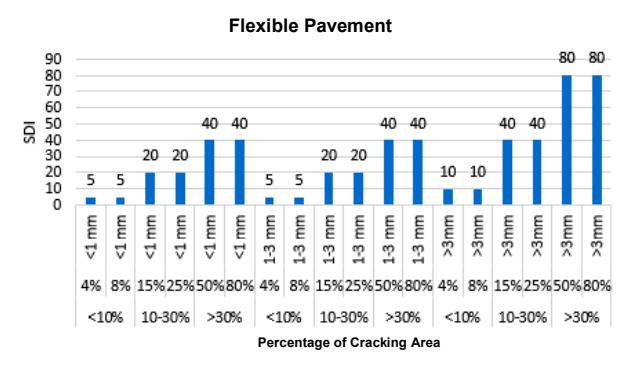
Figure 9. Comparing the effects of cracking on the value of PCI and SDI
From the analysis above, it can be concluded that both the PCI and SDI analysis methods have a similarity: the effect of the cracking width in determining the index of both methods. In the PCI method, the cracking width is indicated by the severity of low, medium, high, while for SDI, it is grouped into three: <1mm, 1-3mm, and> 3mm, which serves as a control of the value of each method.
For the cracking type damage, in the PCI method, with low, medium or high severity, the index moves in the opposite direction, meaning that the greater the percentage of the cracking, the PCI gets smaller, thus the regression equation model can be formed as follows.
4.6.2 Comparing the effects of potholes on PCI and SDI
This comparison is intended to see the extent of the effect of pothole damage on the PCI and SDI, with each analysis as follows.
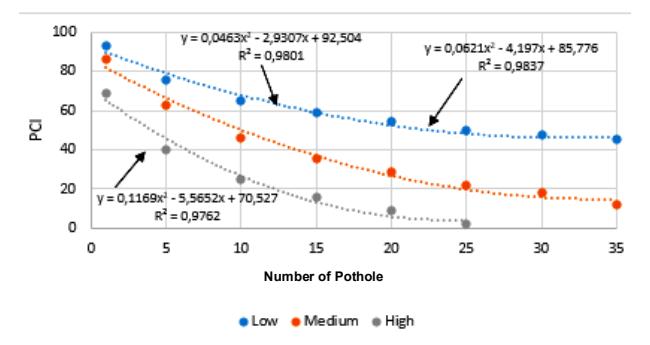
Figure 10. Regression equations for the pothole type damage at low, medium and high levels
Based on the regression equation model above, the change in PCI value due to changes in the percentage of cracking damage area at the high, medium and low
severity levels can be predicted by the following polynomial equation models.
\[PCI = 70,527 - 5,5652x + 0,1169x^{2}\] (6)
with a coefficient of determination (R2 )= 0,9762 on low severity
\[PCI = 85,776 - 4,197x + 0,0621x^{2}\] (7)
with a coefficient of determination (R2 )= 0,9837 on medium severity
\[PCI = 92,504 - 2,9307x + 0,0463x^{2}\] (8)
with a coefficient of determination (R2 )= 0,9801 on low severity
Where, x: number of potholes
PCI due to changes in the number of potholes can be obtained using the equation above.
Table 5. SDI method calculation for pothole type damage
| Number of Pothole | SDI value | |
|---|---|---|
| <10/km | 15 | |
| 10-50/km | 75 | |
| >50/km | 225 |
In the bar chart/table above, the difference between PCI and SDI, which is on the PCI method, considering the effect of the pothole damage severity (low, medium, high), which is a function of the diameter and depth of the pothole. Meanwhile, the SDI method only calculates the number of pothole damage.
From the analysis above, it can also be concluded that the PCI and SDI method have a similarity: there is an effect of the number of potholes in determining the index. But on the PCI method, changes in the number of potholes sensitively affect the index. While on the SDI method, changes in the number of potholes does not have a significant effect on the SDI, because there is a grouping of the number of potholes in determining the SDI which is <10 / km, 10-50 / km, and > 50 / km.
For the pothole type damage, in the PCI method, with low, medium, or high severity, the index moves in the opposite direction, which means that the more potholes there are, the PCI gets smaller, hence the regression equation model can be formed as follows.
4.6.3 Comparing the effects of rutting on PCI and SDI
This comparison is intended to see the extent of the rutting damage effect on the PCI and SDI by comparing the differences between each method and analyzing the rutting analysis equations by PCI and SDI. The analysis is as follows.
Based on the regression equation model above, the change in PCI due to changes in the percentage of
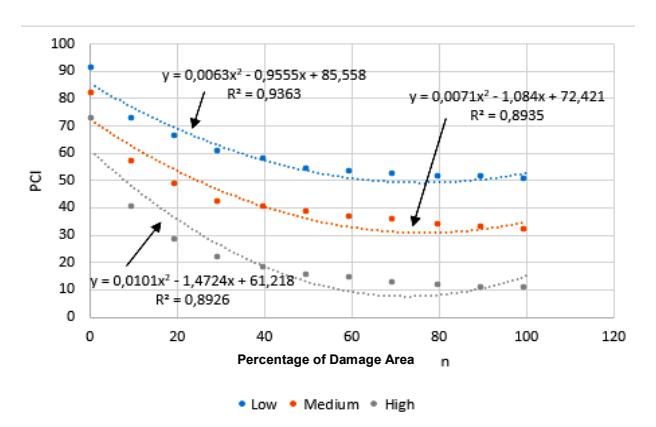
Figure 11. Regression equations for the rutting type damage at low, medium and high levels
rutting damage area at the high, medium and low severity levels can be predicted by the following polynomial equation models
\[PCI = 61,218 - 1,4724x + 0,0101x^{2}\] (9)
with a coefficient of determination (R2 )= 0,8926 on high severity
\[PCI = 72,421 - 1,084x + 0,0071x^{2}\] (10)
with a coefficient of determination (R2 )= 0,8975 on medium severity
\[PCI = 85,558 - 5,9555x + 0,0063x^{2}\] (11)
with a coefficient of determination (R2 )= 0,9363 on low severity
Where, x: damage area percentage
The PCI due to changes in the percentage of rutting area can be obtained using the equation above.
Table 6. SDI method calculation for rutting type damage.
| Rutting | Density | SDI vlalue |
|---|---|---|
| 2 | 2,5 | |
| <1cm | 3 | 2,5 |
| 2 | 10 | |
| 1-3 cm | 3 | 10 |
| 2 | 20 | |
| >3cm | 3 | 20 |
From the above analysis, it can be concluded that both the PCI and SDI analysis methods have a similarity: the effect of the rut depth in determining the index of the two methods. In the PCI method, the rut depth is indicated by the severity of low, medium, and high, while for SDI, it is grouped into three: <1cm, 1-3cm, and> 3cm.
For the rutting type damage, in the PCI method, with low, medium or high severity, the index moves in the opposite direction, meaning that the greater the percentage of the rutting area, the PCI gets smaller, so the regression equation model can be formed as follows.
Table 7. The similarities and differences of the analysis methods on PCI and SDI for the same damage types
| Type of Road Damage | Description | Difference |
|---|---|---|
| Cracking | Influenced by cracking area | - |
| Influenced by width of cracking | - | |
| Pothole | Influenced by number of pothole | SDI method does not consider the severity level of pothole |
| Rutting | Influenced by depth of rutting | SDI method dose not consider the percentage of rutting area |
From the comparison of the three damage parameters above, the differences and similarities of the analysis methods in PCI and SDI can be concluded, as in the following table.
From the table of similarities and differences in the analysis methods for PCI and SDI for the same damage types above, comments can be given as follows.
- Even though it has similar analysis sfor the cracking damage, however, there are significant differences: in the PCI method, the change in percentage of damage area sensitively affects the PCI, while the percentage change in the cracking area is divided into groups of <10%, 10-30% and >30% so that the change does not have any effect if it is still in the range.
- Even though it has similar analysis for the cracking damage, however, there are significant differences: in the PCI method, the change in the number of potholes sensitively affects the PCI. Whereas, in the SDI method, the change in the number of potholes does not have a significant effect on the SDI, because there is a grouping of the number of potholes in determining the SDI value, which consist of: <10 / km, 10-50 / km, and > 50 / km.
- Even though it has similar analysis for the cracking damage, however, there are significant differences: in the PCI method, the changes in the percentage of rutting area affects the PCI. Meanwhile, in the SDI method, changes in the rutting area percentage does not affect the SDI, if it still has the same rut depth.
4.7 Comparison of functional conditions between PCI and SDI
From the functional conditions comparison between the PCI and SDI methods, it was found that 62 sample units differed in results from functional conditions from the 88 sample units reviewed. This is caused by; first, the effect of IRI in categorizing functional conditions in the SDI method. Second, the differences in the number of categorizations between PCI and SDI, where PCI has 7 categorizations while SDI only has 4. Therefore, there is a need for a comparative analysis between the functional conditions between PCI and SDI without any effect on the IRI of the road and to make a categorization between PCI and SDI.
4.8 Comparison of functional conditions between PCI and SDI (custom)
This analysis will compare the results of pavement conditions using the PCI and SDI methods with a modified scoring criteria scale, SDI categorization with IRI <8. Next, see the difference in the results of the analysis of functional conditions between the two methods, PCI and SDI, if the IRI value factor is omitted.
Table 8. PCI and SDI values with IRI <8 (custom)
| Custom PCI | Rating Scale | SDI with | IRI < 8 |
|---|---|---|---|
| 0-55 | Poor | <50 | Good |
| 56-70 | Fair | 50-100 | Fair |
| 71-100 | Good | >100 | Poor |
From the comparison of functional conditions between PCI and SDI in IRI <8 a reduction in the difference in the functional conditions of PCI and SDI from 62 to 55 was found
In addition to differences in the number of categorizations and the effect of IRI on the SDI method, one of the causes of differences in the functional conditions is the difference in analysis methods on PCI and SDI, therefore a modification of SDI formulas will be carried out mainly on the pothole type damage to have the similar analysis method as the PCI method. The analysis was done by analyzing the number of potholes required in the PCI method for the above three custom categorizations at each damage severity level. The results of this analysis will then be used to customize the analysis method for the pothole type damage in the SDI method.
Table 9. Analysis of PCI pothole damage
| N | Severity Level | |||||||
|---|---|---|---|---|---|---|---|---|
| Number of | Low | М | edium | High | ||||
| Pothole | PCI value | Functional Condition | PCI value | Functional Condition | PCI value | Functional Condition | ||
| 1 | 93 | Good | 86 | Good | 68 | Fair | ||
| 2 | 86 | Good | 77 | Good | 57 | Fair | ||
| 3 | 82 | Good | 70 | Fair | 50 | Poor | ||
| 4 | 80 | Good | 68 | Fair | 48 | Poor | ||
| 5 | 77 | Good | 66 | Fair | 41 | Poor | ||
| 6 | 75 | Good | 60 | Fair | 38 | Poor | ||
| 7 | 70 | Fair | 55 | Poor | 33 | Poor | ||
| 8 | 68 | Fair | 5 | Poor | 31 | Poor | ||
| 9 | 66 | Fair | 50 | Poor | 28 | Poor | ||
| 10 | 65 | Fair | 48 | Poor | 26 | Poor | ||
| 11 | 55 | Poor | 30 | Poor | 10 | Poor | ||
The categorization in the above analysis follows the categorization standard of the Custom PCI Rating Scale. Therefore, for the pothole damage formula in the SDI method, it is adjusted to the PCI method as follows (Table 10).
The above modifications are based on the adjustment of the effect of potholes in the PCI method. As shown in the table above, in the PCI method, 7 potholes with low severity are required to be in the "fair" category.
Therefore, in the SDI method (custom), adjustment was done in the required number of potholes in the "fair" category. The number of potholes, meanwhile, weighting of the indices at each severity level was done by adding weight according to the change in index in the PCI method. For example, the average change in PCI from the low severity level to the medium severity level is 10.875%, therefore, the change in weight from the low to medium level in the SDI method is also 10.875%.
Table 10. Pothole damage formula in the SDI method (custom)
| Severity Level | |||||||
|---|---|---|---|---|---|---|---|
| Low Weight Medium Weight High Weight | |||||||
| <70 /km | 15 | <30/km | 17 | <10/km | 21 | ||
| 70-100/km | 75 | 30-60/km | 83 | 10-20/km | 104 | ||
| >100/km | 225 | >60/km | 250 | >20/km | 313 | ||
Based on the modifications made to the categorization of each method, eliminating the effect of IRI on SDI and modifying the pothole damage formula in the PCI method, the PCI functional conditions were compared with the SDI in IRI < 8 and 42 functional conditions differences were found.
4.9 Sensitivity analysis
Table 11. Comparison of the average value of Soekarno Hatta road conditions based on changes in segment intervals
| No | Measurement Method | Road Condition based on Segment Interval | |||
|---|---|---|---|---|---|
| 1 | PCI | 100 m | 200m | 300m | |
| 2 | SDI | 66,1 | 64,9 | 60,5 | |
| 55,8 | 62,3 | 63,9 | |||
The overall PCI decreased with the increasing segment intervals. The change in index in the PCI method was caused by the prevalence of road damage which was analyzed when the segment intervals were made longer: per 200 m and 300 m. On the contrary, if the road segment is broken down into 100 m intervals, the damage to the road becomes centralized in several segments. The overall SDI increased with the increasing segment intervals. The road damage analyzed was evenly distributed due to the longer segment intervals, on the contrary if the road segment is broken down into 100 m intervals, the road damage becomes centralized in several segments, so that many road segments produce "none" when divided per 100 m. This results in SDI that tends to be larger if the interval segments are made large. The following is a change in the percentage of Soekarno Hatta road conditions in the PCI and SDI methods based on changes in the segment intervals.
Changes in the percentage of road conditions above also affect changes in the classification of road functional conditions. This is caused by changes in the total number of panels in the sample unit. The greater the segment interval, the percentage of damage density
Table 12. Percentage of road conditions due to changes in the PCI segment intervals
| No | Road Condition | % Road Condition based Segment Interval | ||||
|---|---|---|---|---|---|---|
| NO | Rigid Pavement | Flexible Pavement | ||||
| 100 m | 200m | 300 m | 100 m | 300 m | ||
| 1 | Good | 61,9 | 57,1 | 76,9 | 21,6 | 6,9 |
| 2 | Satisfactory | 21,4 | 28,6 | 15,4 | 12,5 | 10,3 |
| 3 | Fair | 11,9 | 14,3 | 7,7 | 19,3 | 17,2 |
| 4 | Poor | 2,4 | - | 18,2 | 20,7 | |
| 5 | Very Poor | 2,4 | - | 15,9 | 13,8 | |
| 6 | Serious | - | - | 12,5 | 31,1 | |
Table 13. Percentage of road conditions due to changes in the SDI segment intervals
| No | Road Condition | %Road Condition | |||
|---|---|---|---|---|---|
| 1 | Good | 100 m | 200 m | 300 m | |
| 2 | Fair | 22,7 | 22,7 | 24,1 | |
| 3 | Poor | 65,9 | 70,5 | 65,5 | |
| 4 | Very Poor | 10,3 | 6,8 | 10,3 | |
| 1,1 | - | ||||
Table 14. Standard error on each road condition measurement interval
| Metode | PCI Segment Interval | SDI Segment Interval | |||
|---|---|---|---|---|---|
| 100 m | 200m | 300 m | 100 m | 200m | |
| Deviation Standard | 26,7 | 26,2 | 27,3 | 34,9 | 32,4 |
| Number of Sample | 120 | 60 | 40 | 42 | 28 |
| Standard Error | 2,4 | 3,4 | 4,3 | 5,4 | 6,1 |
will decrease. Reducing the percentage of damage results in a large PCI value. So that the greater the interval segment, the less categorization of road conditions can be classified, so that recommendations for road treatment cannot be maximized. Therefore, it is recommended to use segmentation per 100 m for road conditions assessment.
From the standard error table above, the standard error at the per 100 m interval segment is smaller compared to the per 200 m and 300 m interval segments both for measurements with PCI and with SDI. Thus, it can be concluded that the more units of the sample, the smaller the error produced. Therefore, based on the standard error generated, the assessment of road conditions with per 100 m interval segments is more representative because it produces smaller errors compared to the per 200 m and 300 m interval segments.
4.10 Simple regression analysis for PCI and PSI correlation on the rigid pavement
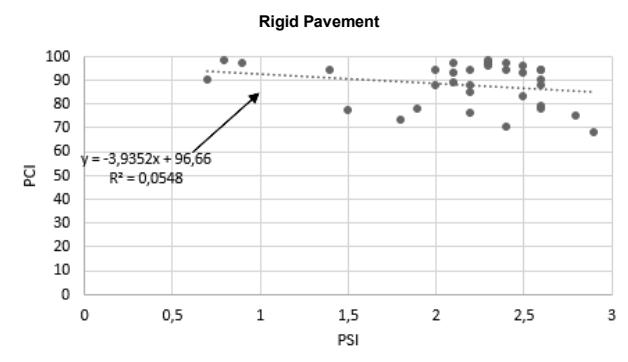
Figure 12. PCI and PSI correlation on the rigid pavement
After a simple regression correlation between PCI and PSI, the coefficient of determination (R2 ) is 0.0548 with the regression equation of PCI = 96.66 - 3.9352 x PSI.
4.11 Simple regression analysis for PCI and PSI correlation on the flexible pavement
From the results of the simple regression analysis carried out with a linear equation, the correlation relationships are generated as follows.
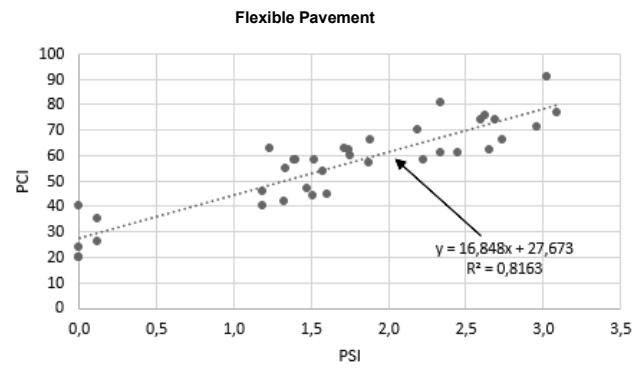
Figure 13. PCI and PSI correlation on the flexible pavement after correction
After a simple regression analysis, the coefficient of determination (R2 ) is generated, which is 0.8163 with a regression equation of PCI = 27.667 + 16.848 x PSI.
4.12 Simple regression analysis for PCI and SDI correlation on the flexible pavement
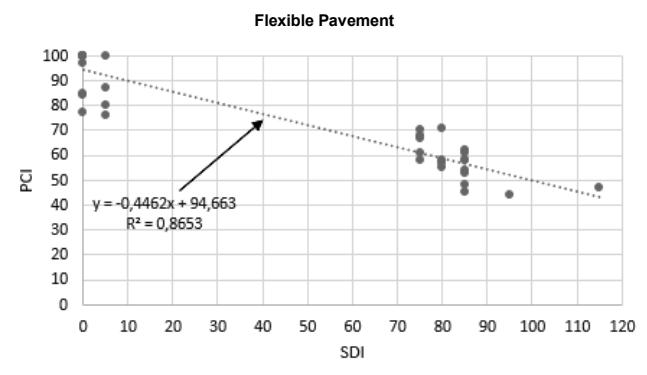
Figure 14. PCI and SDI correlation on the flexible pavement after correction
After a simple regression analysis, a better coefficient of determination (R2 ) is generated, which is 0,8653 with a regression equation of PCI = 94,663 – 0,4462 x SDI.
4.13 Spearman's rank analysis
Table 15. Spearman's rank analysis results
| Measurement Method | Correlation Coefficient | Coefficient sign | Pavement Type |
|---|---|---|---|
| PCI & PSI | 0,397 | + | AC |
| PCI & PSI | 0,043 | + | Concrete |
| PCI & PSI | 0,492 | + | AC |
- From the SPSS output, the correlation coefficient value based on the Spearman's Rank method was 0.397. According to the reference (Sugiono, 2017) the correlation coefficient which is between 0.2 - 0.399 is said to be a low correlation. This means that the level of the relationship between PSI and PCI on the flexible pavement is low.
- From the SPSS output, the correlation coefficient value based on the Spearman's Rank method was 0.043. According to the reference (Sugiono, 2017) the correlation coefficient which is between 0.00 - 0.199 is said to be a very low correlation.
- From the SPSS output, the correlation coefficient value of 0.492 was obtained based on the Spearman's Rank method. According to the reference (Sugiono, 2017), the correlation coefficient which is between 0.4 - 0.599 is said to be a medium correlation.
5. Conclusions
- 1. The percentage of functional condition assessment of Soekarno Hatta road based on PSI, PCI and SDI methods:
- a. The PSI method on the rigid pavement is dominated by the "Fair" category with a percentage of 81%. The flexible pavement is also dominated by the "Fair" category and with a percentage of 48.9%.
- b. The PCI method is dominated by the "Good" category both on the rigid and flexible pavements with indexes of 61.9% and 21.6% respectively.
- c. The SDI method is dominated by the "Medium" category with an index of 65.9% on flexible pavement
- 2. Based on the sensitivity analysis, it is recommended to use the 100 m segment interval rather than the 200 m and 300 m, since the 100 m segment interval is more representative as more categorization of road conditions can be classified, and it also produces lower standard errors.
- 3. In the Spearman's Rank analysis for all types of road condition measurements, it was found that each correlation pair, both for the flexible and rigid pavements, had a mutually affecting relationship. But the PCI correlation coefficient on SDI is greater than the PCI correlation coefficient on PSI.