
Abstrak
Salah satu jenis struktur perkerasan yang paling banyak digunakan di Indonesia adalah struktur perkerasan lentur. Terdapat banyak metode dan program dapat digunakan untuk analisa struktur perkerasan lentur, salah satunya adalah Metode Analitis dengan menggunakan program Kenlayer. Variasi tipe pembebanan (single-axle, dualtandem, dan dual-tridem) serta karakteristik material (linear-elastik, dan nonlinear-elastik) digunakan sebagai pendekatan pada kondisi lapangan. Beban repetisi selama umur layan terhadap kriteria keruntuhan dengan beberapa variasi pada atribut desain struktur perkerasan lentur perlu dianalisis untuk mendapatkan pemahaman yang lebih dalam serta mendapatkan pola perilaku dan hubungannya. Penelitian ini bertujuan untuk menganalisis hubungan pada berbagai variasi beban, karakteristik material terhadap respon struktur, serta kriteria keruntuhan pada analisis umur layan dengan beberapa variasi atribut yang digunakan. Berdasarkan hasil yang didapatkan dar program Kenlayer, untuk variasi beban didapatkan titik respon maksimum adalah berada pada (0; 17,15) pada single-axle dan dual-tandem, serta (121,9; 17,15) pada dual-tridem. Defleksi terbesar terjadi pada beban dualtridem diikuti dengan dual-tandem, dimana variasi dari beban tersebut tidak berpengaruh secara signifikan terhadap tegangan dan regangan yang terjadi. Variasi karakteristik material menunjukkan bahwa material linear (L-L-L) menghasilkan nilai respons yang lebih besar dibandingkan dengan material non-linear (L-NL-NL). Dalam hal analisis umur layan, kriteria keruntuhan yang terjadi sebagian besar disebabkan oleh deformasi permanen pada variasi beban dan modulus resilien pada masing-masing layer, namun hasil yang berbeda didapatkan pada layer permukaan dan layer dasar yang tebal dimana kriteria retak lelah lebih dominan.
Kata kunci: Metode analitis, program Kenlayer, umur layan, retak lelah, deformasi permanen
1. Introduction
Pavement structural management system consists of various stages (i.e planning, design, construction, maintenance, and research). In general, pavement structural divided into 3 types: flexible, rigid, and composite structure. Flexible pavement use asphalt as the binding material. The methods for flexible pavement have been developed over the past century. The empirical method was the initial method used for flexible pavement. In 1943, Burmister introduce a method to determine stress, strain, and deflection using elastic methods for 2 layers-system, and in 1945, he developed it for 3 layers-system. Since then, many computer programs have been developed to calculate stress, strain, and deflection using elastic-linear methods where layers considered as homogenous.
A more appropriate approach to represent the factors to influence flexible pavement planning is to use analytical principle. This method can measure the effect of traffic load and material characteristics variant into structure response. This method has been developing since 1978, namely Shell method in Netherlands, the Nottingham method in the United Kingdom, and Asphalt Institute method in United States of America. The basic concept of this method is to assume that pavement structure is multilayer which will response to load and cause critical stress and strain which must be smaller than the permitted value of fatigue cracking and permanent deformation.
In the field and real condition, the assumption about elastic linear and homogenous pavement materials do not occur. Almost all of the pavement materials are not homogenous and linear elastic, but some are nonlinear and viscoelastic. The type of load in the field is not only one type but varies (i.e single-axle, dual-tandem, dualtridem). The response of the pavement structure to variation of load and material characteristics needs to be known due to gain better understanding about flexible pavement characteristics. Kenlayer (Huang, 1993) is one of the programs that can analyse the case.
The objectives of this research are: (1) to analyse the impact of load and material characteristics to flexible pavement structure; (2) to analyse the location of reference points which produce maximum response to the load given in the flexible pavement structure, and (3) to conduct service life analysis to variation of flexible pavement characteristics.
2. Literature Review
2.1 Analytical methods in flexible pavement
The concept of Analytical Methods is to use multilayer system for flexible pavement structural. Multilayer system has several assumptions for its use (Huang, 2004):
Homogeneity for each layer, although the material in a layer is not purely homogenous;
- Each layer has a certain thickness, except for the subgrade layer;
- Each layer has infinite horizontal direction and infinite depth of subgrade;
- Each layer has isotropic properties, which will have the same response in all direction when given load from different direction;
- The interface between two layers is very strong with full friction;
- The load is equal over the pavement surface with the pressure of contact area is assumed to be circular.
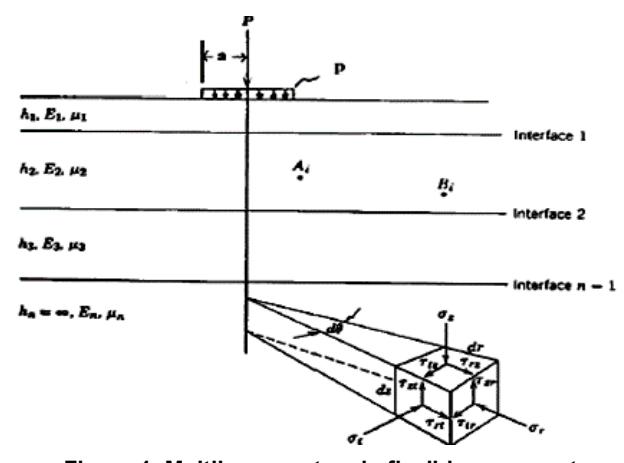
Figure 1. Multilayer system in flexible pavement structure (Huang, 2004)
Variation of response in flexible pavement structure such as vertical displacement (deflection), vertical stress and strain, horizontal stress and strain, may different for variation of depth, reference point, and other criteria including load type and material characteristics. The analysis for flexible pavement can be done using Kenlayer program developed by Huang (Huang, 1993).
2.2 Parameters in material characteristics
A. Linear-Elastic
Linear-Elastic characteristics in flexible pavement modeling have elastic properties which will return to its original form when the load is removed. The parameters used for linear-characteristic are as follow (Huang, 2004):
Resilient Modulus
Resilient modulus is a modulus of elasticity based on elasticity theory. Most of the pavement material is actually not elastic. However, if the load is small compared to the strength of the material and is repeated continuously, the deformation under repetitive loading is almost completely restored and the amount is proportional to the load so that it can be considered elastic. Modulus of elasticity based on strain restored due to repetition load is called resilient modulus, which can be written in equation (1):
\[E = \frac{\sigma_d}{\varepsilon_r} \tag{1}\]
: resilient modulus (kPa) • deviator stress (kPa)
\(\varepsilon_r\): radial strain
Poisson Ratio (μ)
Poisson ratio is lateral and axial strain (comparison of the direction X and Y strain). Based on the results of the axial and lateral strain tests during the test to determine the magnitude of the elastic modulus, Poisson Ratio can be measured.
B. Nonlinear-Elastic
Nonlinear-Elastic characteristics wherein the modulus of elasticity varies according to the amount of pressure caused. Consequently, solving the problem in elasticnonlinear characteristics requires iterative process to reach converging results.
The iteration for elastic modulus in Kenlayer program
• \(K - \theta\) model for unbound granular material
Grained and subgrade materials have nonlinear-elastic characteristics with variation of elasticity modulus according to the total of stress that occurs. resilient modulus of fine-grained material increase with the intensity of the stress, while resilient modulus of fine-grained soil will decrease with increasing stress. The relationship between resilient modulus and stress invariant can be stated as (Huang, 2004):
\[E = K_1 \theta^{K_2} \tag{2}\]
Where \(K_1\) and \(K_2\) are constants based on experiment, and \(\theta\) is the invariant stress calculated from the total of 3 normal stress (\(\sigma_x\), \(\sigma_y\), and \(\sigma_z\)) or main stress (\(\sigma_1\), \(\sigma_2\), and \(\sigma_3\).)
\[\theta = \sigma_x + \sigma_y + \sigma_z = \sigma_1 + \sigma_2 + \sigma_3 \tag{3}\]
If the weight of material volume is considered in the calculation, equation (3) can be written as:
\[\theta = \sigma_x + \sigma_y + \sigma_z + \gamma \cdot z \left(1 + 2K_0\right) \tag{4}\]
Where
= average volume weight
z = depth where the modulus will be determined
\(K_0\) = coefficient of soil pressure at rest
Resilient modulus for several granular materials and K<sub>1</sub> and K<sub>2</sub> for Untreated Granular materials (Shook, et.all, 1982) as in the following table (Rada and Witczak, 1981):
Table 1. Value of K<sub>1</sub> and K<sub>2</sub> for granular material
| Motorial Type | No of Data | K1 ( | psi) | \(K_2\) | ||
|---|---|---|---|---|---|---|
| Material Type | Points | Mean | Stdev | Mean | Stdev | |
| Silty sand | 8 | 1620 | 78 | 0.62 | 0.13 | |
| Sand-gravel | 37 | 4480 | 4300 | 0.53 | 0.17 | |
| Sand-aggregate blend | 78 | 4350 | 2630 | 0.59 | 0.13 | |
| Crushed stone | 115 | 7210 | 7490 | 0.45 | 0.23 | |
Table 2. Value of K<sub>1</sub> and K<sub>2</sub> for untreated granular material (Huang, 2004)
| , | |||
|---|---|---|---|
| Reference | Material | K1 (psi) | K2 |
| Hicks (1970) | Partially crushed gravel, crushed rock | 1600-5000 | 0.57-0.73 |
| Hicks and Finn (1970) | Untreated base at San Diego Test Road | 2100-5400 | 0.61 |
| Allen (1973) | Gravel, crushed stone | 1800-8000 | 0.32-0.70 |
| Kalcheff and Hicks (1973) | Crushed stone | 4000-9000 | 0.46-0.64 |
| Boyce et.al (1976) | Well-graded crushed limestone | 8000 | 0.67 |
| Monismith and Witczak (1988) | In service base and subbase materials | 2900-7750 | 0.46-0.65 |
Bilinear model for subgrade material
Bilinear modelling is one of the resilient modulus models which has been commonly used for the subgrade course through the relation of modulus deviator stress. The modulus of Fine-Grained soil will decrease with the increasing of deviator stress from triaxial test in the laboratory. Bilinear characteristics can be written as follows:
\[E = K_1 + K_3(K_2 - \sigma_d)\] ketika \(\sigma_d < K_2\)
\(E = K_1 - K_4(\sigma_d - K_2)\) ketika \(\sigma_d > K_2\) (5)
Where \(K_1\), \(K_2\) and \(K_3\) is material constants.
The value of resilient modulus at the breakpoint of the bilinear curve, as illustrated in Figure 2. The \(K_1\) curve in the image is a good indicator of the behavior of the resilient modulus, while \(K_2\), \(K_3\), \(K_4\) are less variable and have an influence on structural response pavement which is smaller in value than \(K_1\). They classify Fine-Grained Soil into 4 types, namely: very soft, soft, medium and rigid, with a relationship between resilient modulus and deviator stress as shown in the Figure 2.
Analysis with linear material in Kenalyer program is thicker than nonlinear for 2 and 3-layer model and the magnitude of allowable load is greater for linear than nonlinear (Lau, 2019).
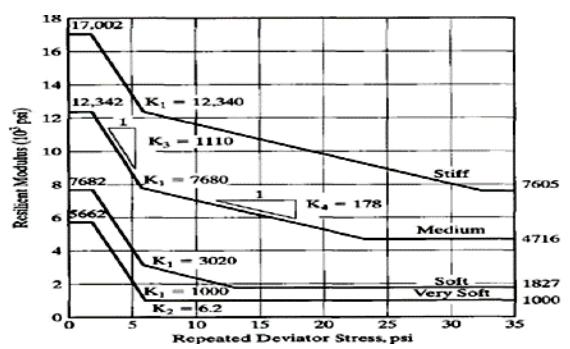
Figure 2. Resilient modulus and deviator stress for 4 type of subgrade
C. Load Configuration
Vehicle wheel loads can be determined as single axle, dual-tandem, and dual-tridem. The configuration of the load is as Figure 3.
Figure 3. Load configuration types
Where XW is the distance between the wheels of the vehicle in the direction of X and YW is the distance between wheels of vehicle in the direction of Y. The value of XW and YW used is following the standard: 121.9 cm and 34.3 cm
The contact vehicle stress is assumed to be the same as vehicle wheel stress range from 550-700 kPa, and the contact area is assumed to be circular, thus the radius of the contact area can be calculated using the following formula:
\[r = \sqrt{\frac{F}{p_{X}\pi}} \tag{6}\]
Where F is vehicle wheel load and P is the stress of the vehicle wheel which contact with the road surface.
2.3 Failure criteria in flexible pavement
Failure criteria which will be analyzed in this research are fatigue cracking and permanent deformation.
Fatigue Cracking
The fatique cracking occurs at the bottom of the asphalt layer due to horizontal tensile strain. Fatigue cracking is a phenomenon caused by repetitive loading with a maximum value is less than the material permitting stress (Brown et.al, 1977).
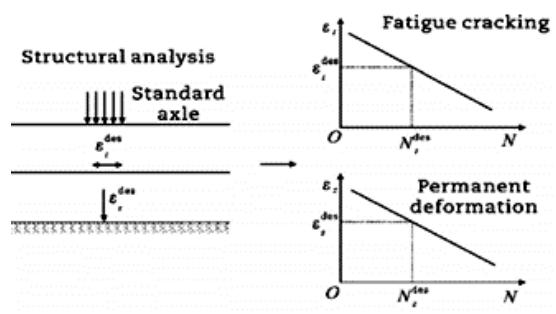
Figure 4. Fatigue cracking and deformation permanent location in flexible pavement structure (Monismith, 2004)
Tensile strain has great influence to cause a crack in material with high rigidity (Gerrard et.al, 1970).
The equation to calculate the load repetition based on tensile strain below the asphalt layer is as follow (Asphalt Institute, 1988):
\[N_f = f_1 (\varepsilon_t)^{-f_2} (E_1)^{-f_3}\] (7)
= number of load repetition allowed to prevent fatigue cracking
= horizontal tensile strain at the bottom of the asphalt layer (maximum)
= elasticity modulus of the asphalt layer
= constants form fatigue cracking test: 0,0796; 3,291; 0,854 based on Asphalt Institute method
Permanent Deformation
Permanent deformation occurs at the top of the base layer due to vertical strain. Permanent deformation is a permanent surface layer change due to traffic loads. This permanent deformation occurs due to compressive strain on the upper subgrade layer. In general, it is because of poor mixture or low-quality compaction.
The equation for permanent deformation is as follows:
\[N_d = f_4 \ (\varepsilon_z)^{-f_5} \tag{8}\]
= number of allowed repletion
= press strain above the subgrade layer
= constants form experiment based on the Asphalt Institute: ; and 4,477
3. Research Methodology
This research methodology shows in Figure 5. It started with determination of background and objectives, followed by literature review and methodology to reach the objectives. Subsequently, the scenario of flexible pavement will be arranged and analyzed. The analysis that will be conducted are variation of load and material
characteristics to flexible pavement response, and service life analysis.
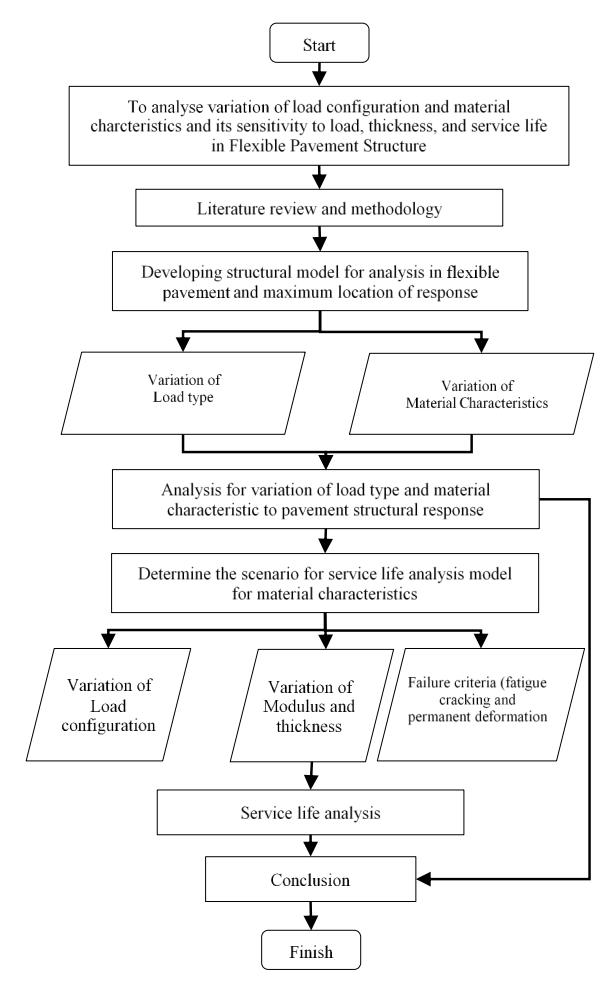
Figure 5. Research methodology
4. Assumptions and Scenarios
There are 3 layers used for flexible pavement in this research. Material characteristics for analysis are 2 types for modeling flexible pavement: Linear-Linear-Linear (L -L-L); and Linear-Nonlinear-Nonlinear (L-NL-NL). The surface course is always in linear characteristics in this research because it contains asphalt which has elastic characteristics. The load configuration divided into 3 types: single axle; dual-tandem; and dual-tridem.
In single-axle, dual-tandem, and dual-tridem, there are several reference points to be analyzed to determine the maximum response of the flexible pavement structure given by traffic load. The reference points are as in Figure 6.
In this research, the assumptions of flexible pavement characteristics can be written in Table 3. (Huang, 2004):
This research will compare the result of responses in flexible pavement structure i.e vertical and horizontal stress and strain, fatigue cracking, and permanent deformation for each reference point. Generally, the scenario consists of 3 major cases:
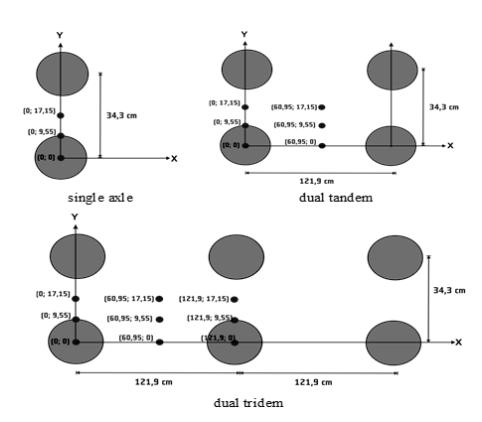
Figure 6. Reference points for load type
- Variation of load configurations
- Variation of material characteristics
- Service life analysis
Variation of load configurations divided into 3 load types, single-axle, dual-tandem, and dual-tridem (Figure 6) while variation of material charactersistis for 3 layers of flexible pavement are: linear elastic-linear elastic-linear elastic (L-L-L) and linear elastic-nonlinear elastic-nonlinear elastic (L-NL-NL).
Service life analysis conducted for each of material characteristics (L-L-L and L-NL-NL) and only single axle load type. It was conducted to determine the effect of variations to fatigue cracking and permanent deformation. The variations for service life analysis are as follow:
- Variation of load configuration (P)
- Variation in the thickness of surface course
- Variation in the thickness of base course
- Variation of surface course modulus
- Variation of base course modulus
- Variation of subgrade modulus
The parameters used for sensitivity and service life analysis can be written in Table 4.
5. Stress Strain and Defelection Analysis
This research consists of 4 major analysis: maximum response location for load types, variation of load configuration, material characteristics, sensitivity and service life analysis.
5.1 Maximum response location for load types
Reference point used for load types in this research can be seen in Figure 6. After calculated the response of flexible pavement structure using assumption in Table 3 and Kenlayer Program, the response for load types are:
Table 3. Assumption for research scenario
| Parameter | Description | Value |
|---|---|---|
| Surface course thickness | 100 mm | |
| Base course thickness | 300 mm | |
| Poisson raton-surface course | 0.40 | |
| Poisson ratio-base course | 0.38 | |
| Poisson ratio-subgrade course | 0.45 | |
| Resilient modulus-surface course | 3447 MPa | |
| Resilient modulus-base course | 172 MPa | |
| Resilient modulus-subgrade course | 55 MPa | |
| P | Traffic load | 700 kPa |
| CR | contact area radius | 19.1 cm |
| YW | the distance between the wheels of the vehicle in the direction of Y | 34.3 cm |
| XW | the distance between the wheels of the vehicle in the direction of X | 121.9 cm |
| Nonlinear material (base course) | ||
| Coefficient of earth pressure at rest | 0.60 | |
| Nonlinear coefficient of granular material | 62053 kPa | |
| Nonlinear exponent for granular material | 0,33 | |
| Subgrade course (fine-grained soil) | ||
| Coefficient of earth pressure at rest | 0.80 | |
| Break point elastic modulus | 52992 kPa | |
| deviator stress at breakpoint) | 43 kPa | |
| slope when deviator stress < | 7659 kPa | |
| slope when deviator stress > | 1228 kPa |
Table 4. Variation of service life analysis
| Variation | Contant value | |||||||
|---|---|---|---|---|---|---|---|---|
| P | : 50 mm; : 200 mm | |||||||
| : 100 mm | ||||||||
| : 50 mm | ||||||||
| : 10 mm, : 300 mm, : 100 MPa | ||||||||
| : 10 mm, : 300 mm , : 1000MPa | ||||||||
| : 10 mm, :300 mm, : 1000MPa | ||||||||
NB: The parameter that are no available are the same as Table 3
From Table 5 until Table 7, the locations of maximum responses are:
- Single-axle: between two wheels in Y direction (Y=17.15) and central of two wheels in X direction (X=0), so the coordinate is (0; 17.15) for L-L-L and L-NL-NL.
- Dual-tandem: between two wheels in Y direction (Y=17.15) and central of the first wheel in X direction (X=0), so the coordinate is (0,17.15) for both materials' variant.
- Dual-tridem: between two wheels in Y direction (Y=17.15), and the central of second wheel in X direction (X=121.19), so the coordinate is (121.19; 17.15) for both material characteristics.
In general, the location for maximum response of each load in Table 5 until Table 7 can be illustrated in Figure 7. The maximum responses location will be used for variation of load type and material characteristics.
5.2. Variation of load type
The parameter results which will be analyzed for variation of load type (single-axle, dual-tandem, and dual-tridem) are deflection, vertical stress, vertical strain, horizontal stress, and horizontal strain. The results can be seen in Figure 8 until Figure 12.
From Figure 8 until Figure 12, there are some pattern and difference, follow as
- The highest deflection was resulted from dual-tridem load configuration followed by dual-tandem and single -axle. It is because dual-tridem has the biggest load than others.
- The L-L-L material characteristics has bigger deflection than L-NL-NL for all of load types (Figure 8).
- The correlation between depth and deflection for all the load type and material characteristics is inversely proportional. The higher number of depth (deeper) the points of reference, the smaller deflection resulted in the flexible pavement structure (Figure 8).
Table 5. Maximum response location on single axle load
| Single Axle (L-L-L) | |||||||||||
|---|---|---|---|---|---|---|---|---|---|---|---|
| Ref Point | Coordinat | Depth | Vertical Deflection | Vertical Stress | Vertical S train | Horizontal Stress | Horiz ontal S train | ||||
| 0 | 0.228 | 700.00 | -6.59E-04 | 4404.00 | 4.40E-04 | ||||||
| 1 | (0;0) | -10 | 0.227 | 378.24 | 7.13E-04 | -2968.00 | -6.46E-04 | ||||
| -40 | 0.183 | 121.87 | 1.43E-03 | -179.30 | -9.88E-04 | ||||||
| 0 | 0.237 | 700.00 | -7.08E-04 | 4556.00 | 4.32E-04 | ||||||
| 2 | (0; 9.55) | -10 | 0.237 | 409.58 | 7.67E-04 | -3265.00 | -7.26E-04 | ||||
| -40 | 0.189 | 130.85 | 1.55E-03 | -192.50 | -1.04E-04 | ||||||
| 0 | 0.240 | 700.00 | -7.18E-04 | 4558.00 | 4.32E-04 | ||||||
| 3 | (0; 17.15) | -10 | 0.239 | 422.48 | 8.05E-04 | -3434.00 | -7.61E-04 | ||||
| -40 | 0.190 | 133.09 | 1.58E-03 | -195.90 | -1.06E-03 | ||||||
| Single Axle (L-NL-NL) | |||||||||||||
|---|---|---|---|---|---|---|---|---|---|---|---|---|---|
| Ref Point | Coordinate | Depth | Vertical Deflection | Vertical Stress | Vertical S train | Horizontal Stress | Horiz ontal S train | ||||||
| 0 | 0.176 | 700.00 | -4.24E-04 | 3253.00 | 3.20E-04 | ||||||||
| 1 | (0;0) | -10 | 0.176 | 468.83 | 3.96E-04 | -1327.00 | -3.34E-04 | ||||||
| -40 | 0.153 | 89.16 | 8.61E-04 | -404.40 | -7.06E-04 | ||||||||
| 0 | 0.182 | 700.00 | -4.50E-04 | 3294.00 | 3.00E-04 | ||||||||
| 2 | (0; 9.55) | -10 | 0.181 | 501.09 | 4.18E-04 | -1473.00 | -3.84E-04 | ||||||
| -40 | 0.157 | 95.04 | 9.33E-04 | -433.00 | -7.44E-04 | ||||||||
| 0 | 0.183 | 700.00 | -4.55E-04 | 3273.00 | 2.96E-04 | ||||||||
| 3 | (0; 17.15) | -10 | 0.183 | 521.42 | 4.47E-04 | -1592.00 | -4.11E-04 | ||||||
| -40 | 0.158 | 96.48 | 9.50E-04 | -440.00 | -7.54E-04 | ||||||||
Table 6. Maximum response location on dual tandem load
| Dual-T | andem (L-L | -L) | Dua | |||||||||||
|---|---|---|---|---|---|---|---|---|---|---|---|---|---|---|
| Ref Point | Coordinate | Depth | Vertical Deflection | Vertical Stress | Vertical Strain | Horizontal Stress | Horizontal Strain | Ref oint | Coordinate | Depth | Vertic Deflect | |||
| 0 | 0.293 | 700.00 | -6.48E-04 | 4247.00 | 4.70E-04 | 0 | ||||||||
| 1 | (0; 0) | -10 | 0.292 | 379.12 | 6.99E-04 | -2860.00 | -6.17E-04 | 1 | (0; 0) | -10 | ||||
| -40 | 0.248 | 127.43 | 1.41E-03 | -152.00 | -9.03E-04 | -40 | ||||||||
| 0 | 0.303 | 700.00 | -6.97E-04 | 4395.00 | 4.66E-04 | 0 | ||||||||
| 2 | (0; 9.55) | -10 | 0.302 | 410.49 | 7.53E-04 | -3154.00 | -6.95E-04 | 2 | (0; 9.55) | -10 | ||||
| -40 | 0.254 | 136.56 | 1.54E-03 | -164.70 | -9.54E-04 | -40 | ||||||||
| 0 | 0.305 | 700.00 | -7.09E-04 | 4423.00 | 4.66E-04 | 0 | ||||||||
| 3 | (0; 17.15) | -10 | 0.305 | 423.40 | 7.91E-04 | -3322.00 | -7.30E-04 | 3 | (0; 17.15) | -10 | ||||
| -40 | 0.256 | 138.83 | 1.57E-03 | -167.80 | -9.66E-04 | -40 | ||||||||
| 0 | 0.240 | 0.00 | -1.22E-05 | -450.60 | -2.08E-04 | 0 | ||||||||
| 4 | (60.95; 0) | -10 | 0.240 | 21.92 | -7.55E-05 | 796.9 | -1.22E-04 | 4 | (60.95; 0) | -10 | ||||
| -40 | 0.232 | 65.89 | 4.73E-04 | 38.02 | -6.87E-04 | -40 | ||||||||
| 0 | 0.244 | 0.00 | -1.42E-05 | -498.70 | -2.30E-04 | 0 | ||||||||
| 5 | (60.9; 9.55) | -10 | 0.245 | 23.59 | -7.72E-05 | 855.30 | -1.40E-04 | 5 | (60.9; 9.55) | -10 | ||||
| -40 | 0.236 | 69.00 | 5.07E-04 | 40.66 | -7.56E+04 | -40 | ||||||||
| 0 | 0.246 | 0.00 | -1.47E-05 | -510.70 | -2.35E-04 | 0 | ||||||||
| 6 | (60.9; 17.15) | -10 | 0.246 | 24.00 | -7.76E-05 | 869.70 | -1.45E-04 | 6 | (60.9; 17.15) | -10 | ||||
| -40 | 0.237 | 69.79 | 5.15E-04 | 41.33 | -7.74E-04 | -40 |
| Dual-Tandem (L-NL-NL) | ||||||||||||
|---|---|---|---|---|---|---|---|---|---|---|---|---|
| Ref Point | Vertical Deflection | Vertical Stress | Vertical Strain | Horizontal Stress | Horizontal Strain | |||||||
| 0 | 0.246 | 700.00 | -4.37E-04 | 3223.00 | 3.62E-04 | |||||||
| 1 | (0; 0) | -10 | 0.245 | 464.90 | 4.07E-04 | -1375.00 | -3.41E-04 | |||||
| -40 | 0.222 | 99.43 | 8.95E-04 | -348.30 | -6.82E-04 | |||||||
| 0 | 0.252 | 700.00 | -4.64E-04 | 3267.00 | 3.47E-04 | |||||||
| 2 | (0; 9.55) | -10 | 0.252 | 497.31 | 4.30E-04 | -1528.00 | -3.93E-04 | |||||
| -40 | 0.226 | 105.67 | 9.69E-04 | -374.90 | -7.17E-04 | |||||||
| 0 | 0.253 | 700.00 | -4.69E-04 | 3246.00 | 3.45E-04 | |||||||
| 3 | (0; 17.15) | -10 | 0.253 | 517.02 | 4.60E-04 | -1649.00 | -4.20E-04 | |||||
| -40 | 0.227 | 107.21 | 9.88E-04 | -381.40 | -7.24E-04 | |||||||
| 0 | 0.220 | 0.00 | -9.05E-05 | 72.67 | -7.34E-05 | |||||||
| 4 | (60.95; 0) | -10 | 0.221 | 10.73 | -5.04E-05 | 413.9 | -3.56E-05 | |||||
| -40 | 0.215 | 60.78 | 3.45E-04 | -10.90 | -5.36E-04 | |||||||
| 0 | 0.223 | 0.00 | -9.51E-05 | 57.06 | -8.50E-05 | |||||||
| 5 | (60.9; 9.55) | -10 | 0.224 | 10.92 | -5.22E-05 | 442.50 | -4.25E-05 | |||||
| -40 | 0.219 | 62.95 | 3.64E-04 | -8.66 | -5.83E-04 | |||||||
| 0 | 0.224 | 0.00 | -9.62E-05 | 53.30 | -8.78E-05 | |||||||
| 6 | (60.9; 17.15) | -10 | 0.225 | 10.95 | -5.27E-05 | 449.50 | -4.41E-05 | |||||
| -40 | 0.219 | 63.50 | 3.69E-04 | -8.09 | -5.95E-04 | |||||||
Table 7. Maximum response location on dual tridem load
| Dual-Tridem (L-L-L) | Du | ||||||||||
|---|---|---|---|---|---|---|---|---|---|---|---|
| Ref Point | Coordinate | Depth | Vertical Deflection | Vertical Stress | Vertical S train | Horizontal Stress | Horizontal Strain | Ref Point | Coordinate | Depth | Vert Defle |
| Total | 0 | 0.324 | 700.00 | -6.46E-04 | 4216.00 | 4.75E-04 | 101110 | 0 | Dene | ||
| 1 | (0; 0) | -10 | 0.323 | 379.08 | 6.97E-04 | -2848.00 | -6.14E-04 | 1 | (0; 0) | -10 | |
| -40 | 0.279 | 127.51 | 1.40E-03 | -145.80 | -9.04E-04 | -40 | |||||
| 0 | 0.334 | 700.00 | -6.95E-04 | 4364.00 | 4.71E-04 | 0 | |||||
| 2 | (0; 9.55) | -10 | 0.333 | 410.45 | 7.50E-04 | -3141.00 | -6.92E-04 | 2 | (0; 9.55) | -10 | |
| -40 | 0.286 | 136.64 | 1.53E-03 | -158.20 | -9.66E-04 | -40 | |||||
| 0 | 0.336 | 700.00 | -7.06E+04 | 4392.00 | 4.72E-04 | 0 | |||||
| 3 | (0; 17.15) | -10 | 0.336 | 423.36 | 7.89E-04 | -3309.00 | -7.27E-04 | 3 | (0; 17.15) | -10 | |
| -40 | 0.287 | 138.91 | 1.56E-03 | -161.40 | -9.82E-04 | -40 | |||||
| 0 | 0.282 | 0.00 | -3.97E-06 | -548.40 | -2.35E-04 | 0 | |||||
| 4 | (60.95; 0) | -10 | 0.282 | 21.98 | -8.06E-05 | 830.7 | -1.22E-04 | 4 | (60.95; 0) | -10 | |
| -40 | 0.274 | 66.78 | 4.50E-04 | 51.63 | -7.25E-04 | -40 | |||||
| 0 | 0.286 | 0.00 | -5.98E-06 | -597.50 | -2.57E-04 | 0 | |||||
| 5 | (60.9; 9.55) | -10 | 0.287 | 23.65 | -8.23E-05 | 889.60 | -1.41E-04 | 5 | (60.9; 9.55) | -10 | |
| -40 | 0.279 | 69.91 | 4.84E-04 | 54.48 | -7.95E-04 | -40 | |||||
| 0 | 0.288 | 0.00 | -6.47E-06 | -609.70 | -2.63E-04 | 0 | |||||
| 6 | (60.9; 17.15) | -10 | 0.288 | 24.07 | -8.28E-05 | 904.20 | -1.46E-04 | 6 | (60.9; 17.15) | -10 | |
| -40 | 0.280 | 70.70 | 4.92E-04 | 55.20 | -8.13E-04 | -40 | |||||
| 0 | 0.358 | 700.00 | -6.37E-04 | 4090.00 | 5.04E-04 | 0 | |||||
| 7 | (121.9; 0) | -10 | 0.357 | 380.00 | 6.85E-04 | -2752.00 | -5.87E-04 | 7 | (121.9; 0) | -10 | |
| -40 | 0.313 | 132.99 | 1.40E-03 | -125.10 | -9.40E-04 | -40 | |||||
| 0 | 0.368 | 700.00 | -6.86E-04 | 4235.00 | 5.00E-04 | 0 | |||||
| 8 | (121.9; 9.55) | -10 | 0.368 | 411.39 | 7.39E-04 | -3043.00 | -6.64E-04 | 8 | (121.9; 9.55) | -10 | |
| -40 | 0.320 | 142.26 | 1.53E-03 | -136.90 | -1.05E-03 | -40 | |||||
| 0 | 0.371 | 700.00 | -7.00E-02 | 4289.00 | 5.01E-04 | 0 | |||||
| 9 | (121.9; 17.15) | -10 | 0.370 | 424.31 | 7.77E-04 | -3210.00 | -6.99E-04 | 9 | (121.9; 17.15) | -10 | |
| -40 | 0.322 | 144.57 | 1.56E-03 | -139.80 | -1.08E-03 | -40 | |||||
| Dual-Tridem (L-NL-NL) | ||||||||||
|---|---|---|---|---|---|---|---|---|---|---|
| Ref Point | Coordinate | Depth | Vertical Deflection | Vertical Stress | Vertical Strain | Horizontal Stress | Horizontal Strain | |||
| 0 | 0.278 | 700.00 | -4.33E-04 | 3182.00 | 3.67E-04 | |||||
| 1 | (0; 0) | -10 | 0.277 | 464.92 | 4.05E-04 | -1372.00 | -3.41E-04 | |||
| -40 | 0.253 | 99.73 | 8.81E-04 | -332.60 | -6.87E-04 | |||||
| 0 | 0.284 | 700.00 | -4.60E-04 | 3225.00 | 3.55E-04 | |||||
| 2 | (0; 9.55) | -10 | 0.284 | 497.34 | 4.29E-04 | -1525.00 | -3.93E-04 | |||
| -40 | 0.258 | 105.98 | 9.56E-04 | -359.10 | -7.30E-04 | |||||
| 0 | 0.285 | 700.00 | -4.65E-04 | 3204.00 | 3.52E-04 | |||||
| 3 | (0; 17.15) | -10 | 0.285 | 517.05 | 4.59E-04 | -1646.00 | -4.20E-04 | |||
| -40 | 0.259 | 107.52 | 9.74E-04 | -365.60 | -7.40E-04 | |||||
| 0 | 0.264 | 0.00 | -8.49E-05 | -0.31 | -9.80E-05 | |||||
| 4 | (60.95; 0) | -10 | 0.264 | 11.08 | -5.30E-05 | 425.7 | -3.37E-05 | |||
| -40 | 0.260 | 62.74 | 3.27E-04 | 17.37 | -3.37E-05 | |||||
| 0 | 0.268 | 0.00 | -8.94E-05 | -16.97 | -1.10E-04 | |||||
| 5 | (60.9; 9.55) | -10 | 0.268 | 11.28 | -5.49E-05 | 454.40 | -4.04E-05 | |||
| -40 | 0.263 | 64.94 | 3.47E-04 | 19.98 | -6.23E-04 | |||||
| 0 | 0.268 | 0.00 | -9.06E-05 | -21.00 | -1.13E-04 | |||||
| 6 | (60.9; 17.15) | -10 | 0.269 | 11.31 | -5.54E-05 | 461.40 | -4.20E-05 | |||
| -40 | 0.264 | 65.49 | 3.52E-04 | 20.65 | -6.35E-04 | |||||
| 0 | 0.313 | 700.00 | -4.36E-04 | 3126.00 | 4.04E-04 | |||||
| 7 | (121.9; 0) | -10 | 0.312 | 466.65 | 3.99E-04 | -1326.00 | -3.29E-04 | |||
| -40 | 0.288 | 107.59 | 8.97E-04 | -307.90 | -7.31E-04 | |||||
| 0 | 0.319 | 700.00 | -4.63E-04 | 3167.00 | 3.88E-04 | |||||
| 8 | (121.9; 9.55) | -10 | 0.319 | 466.10 | 4.22E-04 | -1478.00 | -3.81E-04 | |||
| -40 | 0.293 | 113.99 | 9.73E-04 | -333.50 | -8.09E-04 | |||||
| 0 | 0.321 | 700.00 | -4.68E-04 | 3145.00 | 3.86E-04 | |||||
| 9 | (121.9; 17.15) | -10 | 0.321 | 518.82 | 4.52E-04 | -1599.00 | -4.08E-04 | |||
| -40 | 0.294 | 115.57 | 9.91E-04 | -339.80 | -8.28E-04 | |||||
Figure 7. Maximum response location
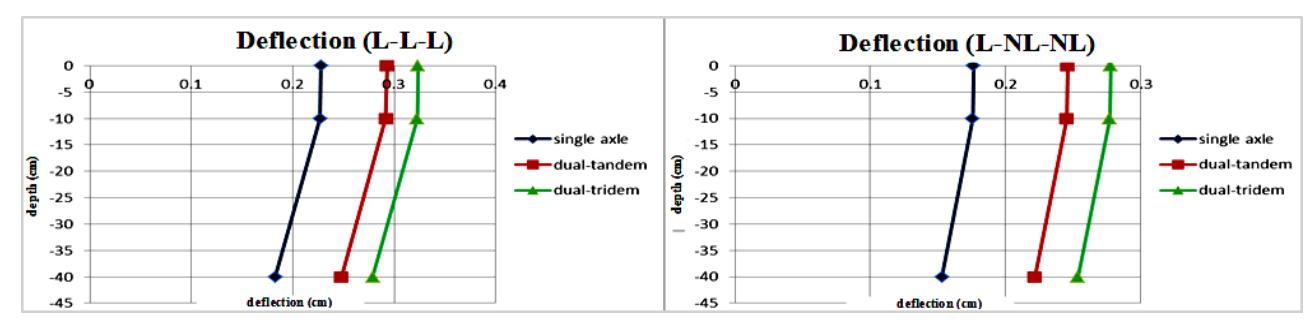
Figure 8. Deflection result for load configuration variant
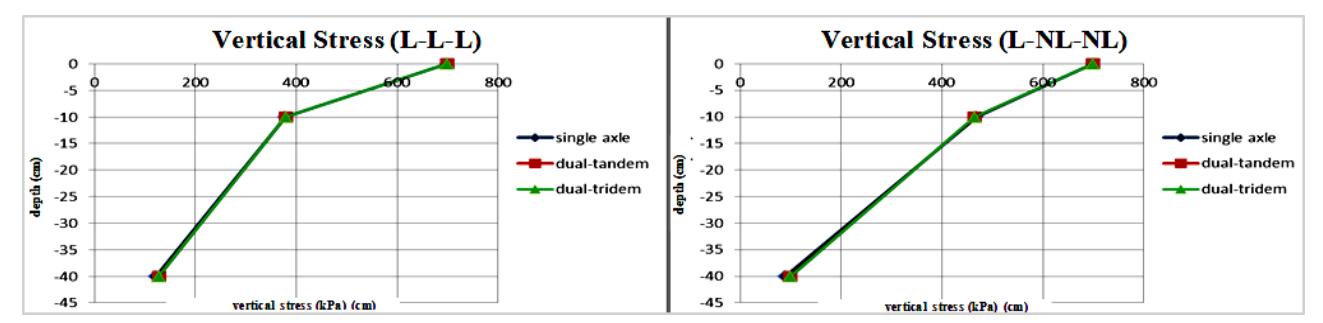
Figure 9. Vertical stress result for load configuration variant
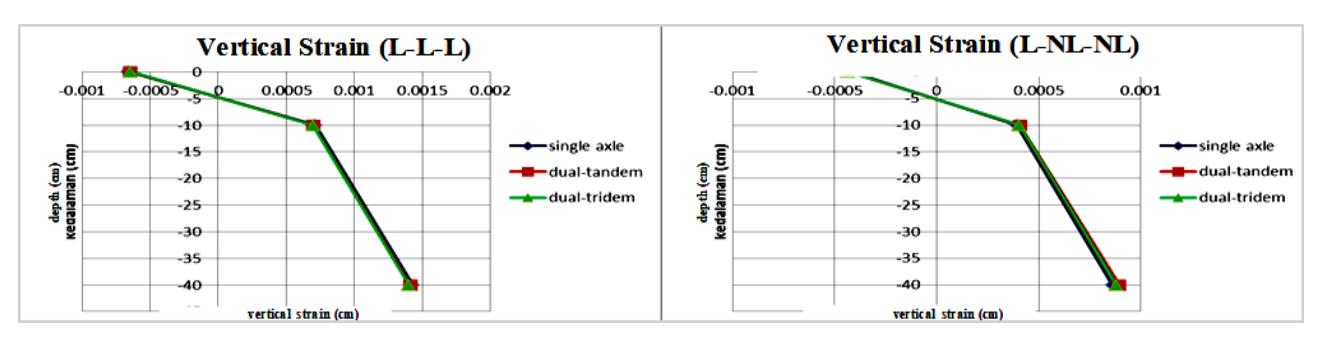
Figure 10. Vertical strain result for load configuration variant
- There is no significant changing of both vertical and horizontal stress and strain for all variation of load configuration or material characteristics in flexible pavement structure. It can be seen in Figure 9 to Figure 12 that the curves almost coincide with single-axle, dual-tandem and dual-tridem.
- The correlation between vertical stress (Figure 9) and depth for all material characteristic is inversely proportional, where the greater value of depth makes smaller number of vertical stress and strain while the vertical strain (Figure 10) is directly proportional to depth.
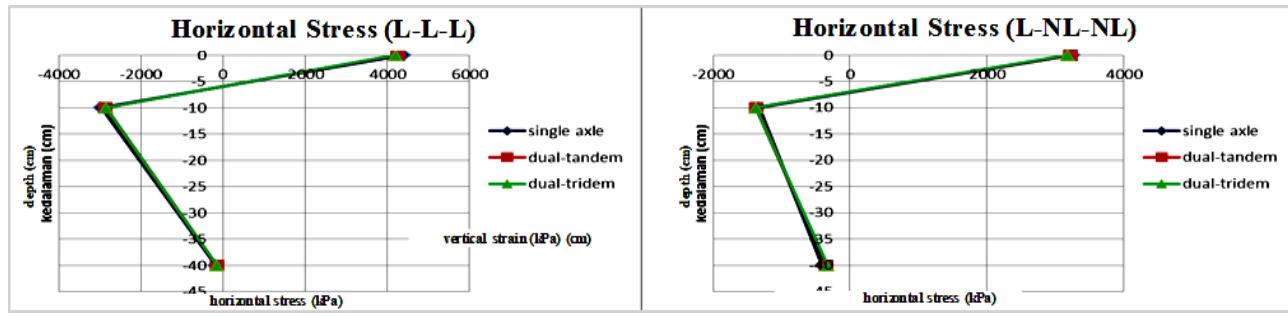
Figure 11. Horizontal stress result for load configuration variant
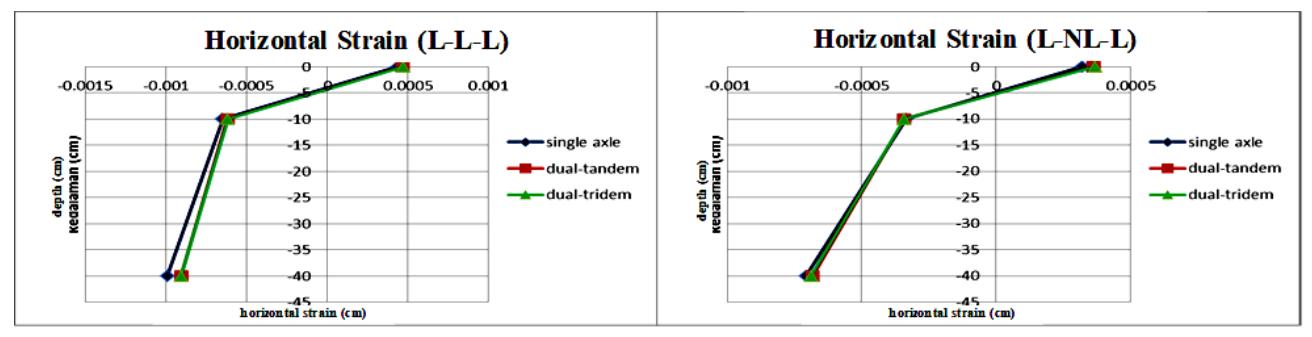
Figure 12. Horizontal strain result for load configuration variant
- The correlation between horizontal strain and strain (Figure 11 and Figure 12) and depth is inversely proportional. In this case the minus value indicates stress or strain is tensile and positive value is compressive. There are changes from compressive to tensile stress and strain for all material characteristics.
- Material characteristics for L-L-L produce higher response compared to L-NL-NL for vertical strain and horizontal stress and strain (Figure 10 to Figure 12) while L-NL-NL has higher number than L-L-L for vertical stress (Figure 10).
5.3. Variation of material characteristics
The variation of material characteristics in this research are linear and nonlinear where the combination for 3 layer flexible pavement structure are Linear-Linear-Linear (L-L-L) and Linear-Nonlinear-Nonlinear (L-NL-NL). The comparison of analysis for material characteristics variant aims to determine the response characteristics of the flexible pavement structure when receiving loads. In this case, the reference point is below the centre of the wheel axis and the load used is singleaxle load. The response can be seen in Figure 13 to Figure 15.
From Figure 13 to Figure 15, it can be analyzed as follow:
- The deflection for L-L-L produces higher deflection value than L-NL-NL.The relationship between deflection and depth is inversely proportional.
- The vertical stress value for L-NL-NL is higher than L-L-L expect for the depth 40 cm.
- The vertical strain value for L-L-L is higher than L-NL-NL. In this case the minus value indicates tensile and positive value is compressive.
- The horizontal stress and strain value for L-L-L has higher value than L-NL-NL.
- Nonlinear material is recommended to used compared to linear material for second and third layer because it gives lower responses to the flexible pavement structure.
From the analysis of material characteristics variant in this section, it can be seen that the results are consistent with variation of load type analysis.
5.4 Service life analysis
Service life is the number of years from the beginning of road operation until it needs structural reconstruction. Generally, service life is around 20 years for flexible pavement structure. In this case, the traffic loads are repetition during that time. The structural reconstruction can be a fatigue cracking xxxx-horizontal strain at the bottom of surface base course layer, and permanent deformation -vertical strain at the bottom of base course layer. Thus, the repetition value of traffic loads (N) which will cause failure (fatigue cracking or permanent deformation) needs to be considered. The relationship between repetition value of traffic loads (N) to failure criteria with some variation of loads (P), thickness and resilient modulus of surface and base cours ( and resilient modulus of subgrade course for L-L-L and L-NL-NL can be seen in Figure 16 to Figure 21.
From Figure 16 until Figure 21 it can be analyzed as:
Loads (P) has inversely proportional relationship with fatigue cracking and permanent deformation for both of materials. L-L-L material has smaller response of fatigue cracking and permanent deformation compared to L-NL-NL (Figure 16)
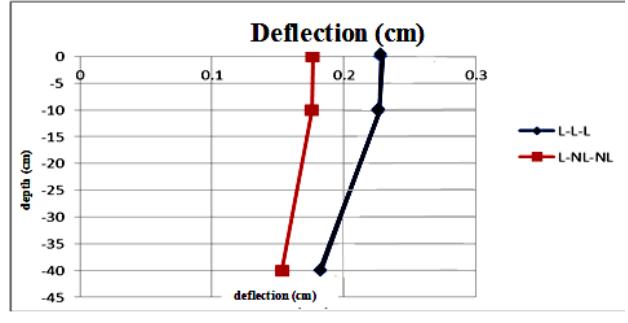
Figure 13. Deflection result for material characteristics variant
- Thickness of surface course ( , basecourse , resilient modulus of surface course , base course , and subgrade course are inversely proportional with fatigue cracking and permanent deformation (Figure 17 to Figure 21) for both materials except and for L-NL-NL material which have almost constant relationship with fatigue cracking and permanent deformation (Figure 20 and Figure 21)
- Loads has bigger impact to fatigue cracking than permanent deformation (Figure 16) while , , xxx, aaaa, has bigegr impact to permanent deformation for both L-L-L and L-NL-NL.Figure 17 to Figure 21)
- Resilient modulus for base and subgrade course has insignificant effect to fatigue cracking and permanent
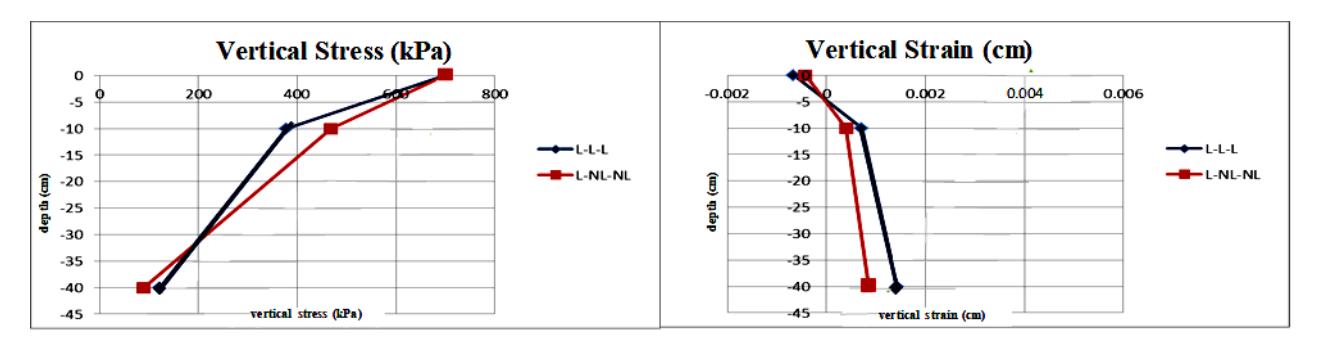
Figure 14. Vertical stress and strain result for material characteristics variant
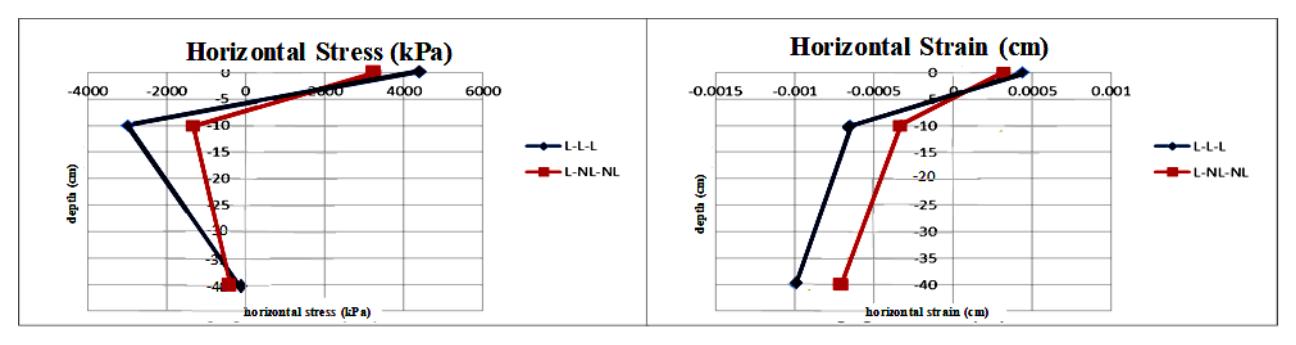
Figure 15. Horizontal stress and strain result for material characteristics variant
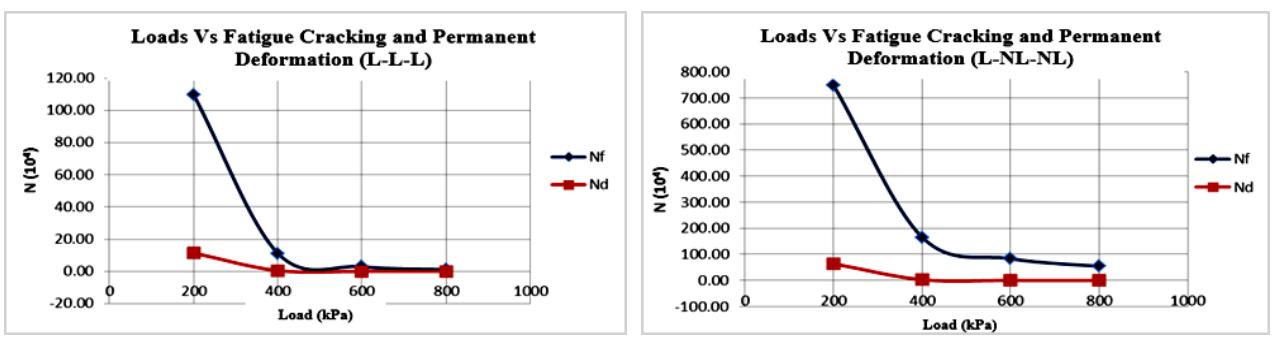
Figure 16. P (loads) to fatigue cracking and deformation permanent for L-L-L and L-NL-NL
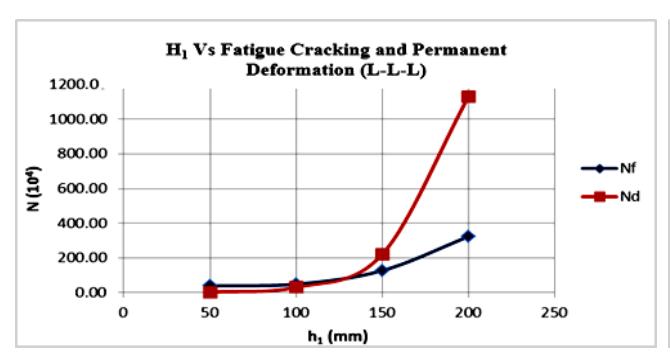
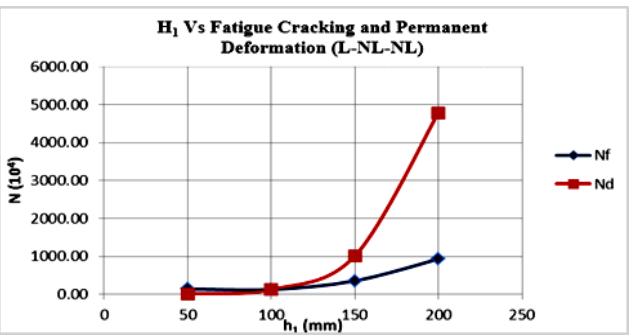
Figure 17. H1 to fatigue cracking and deformation permanent for L-L-L and L-NL-NL
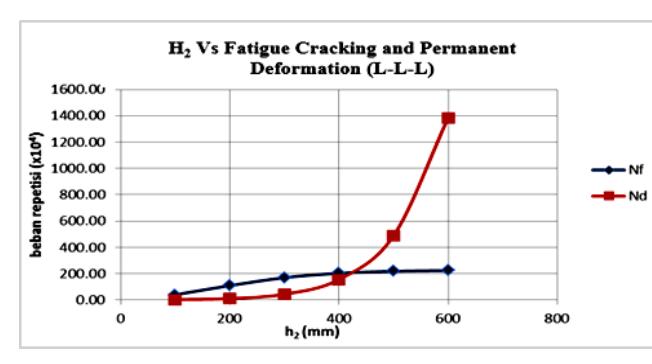
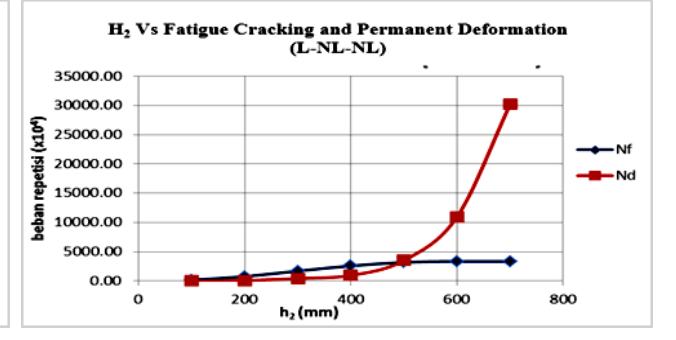
Figure 18. H2to fatigue cracking and deformation permanent for L-L-L and L-NL-NL
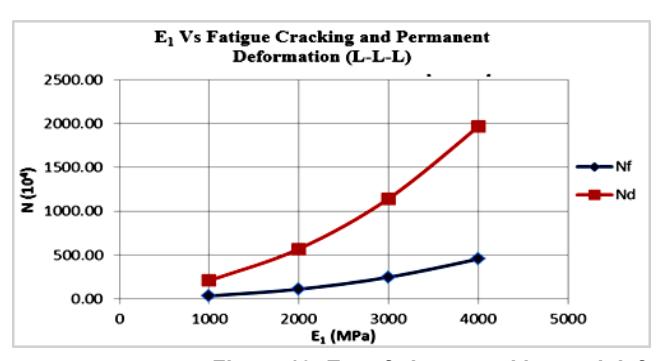
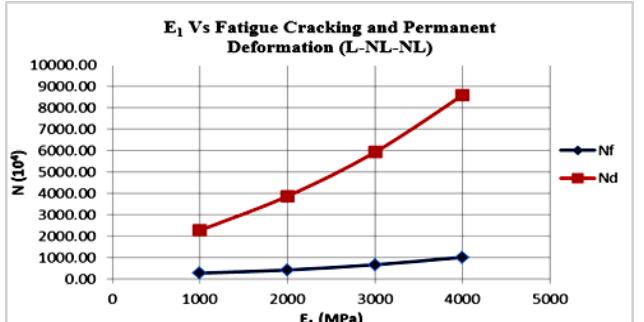
Figure 19. E1 to fatigue cracking and deformation permanent for L-L-L and L-NL-NL
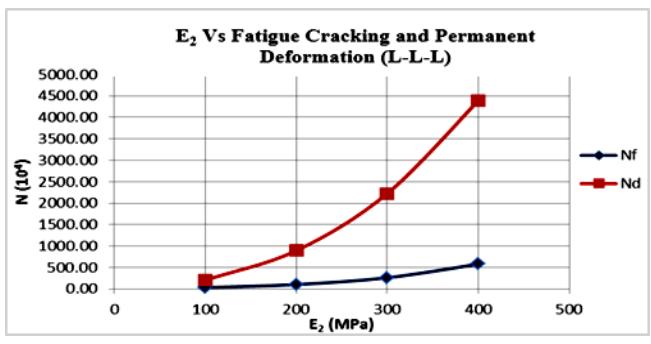
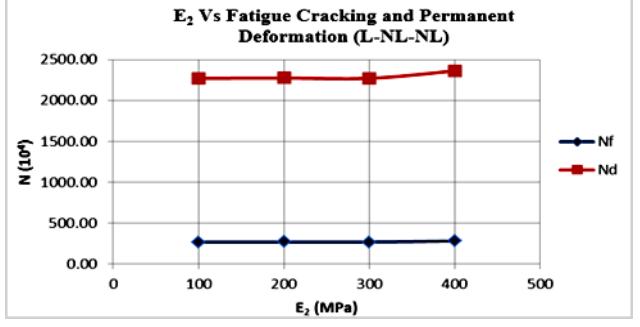
Figure 20. E2 to fatigue cracking and deformation permanent for L-L-L and L-NL-NL
deformation for L-NL-NL material , but they have significant effect for L-L-L material (Figure 20 and Figure 21).
- Variations of loads (P), thickness and resilient modulus of surface and base course ,
- and resilient modulus of subgrade course has lower value for L-L-L compared to L-NL-NL material (Figure 16 toFigure 21).
- The effect of load variation (Figure 16) to criteria failure of flexible pavement is determined by the
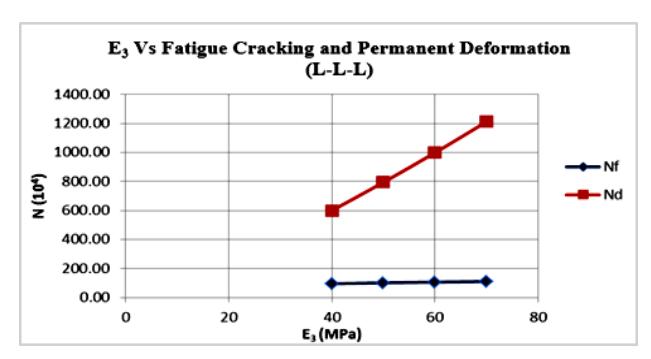
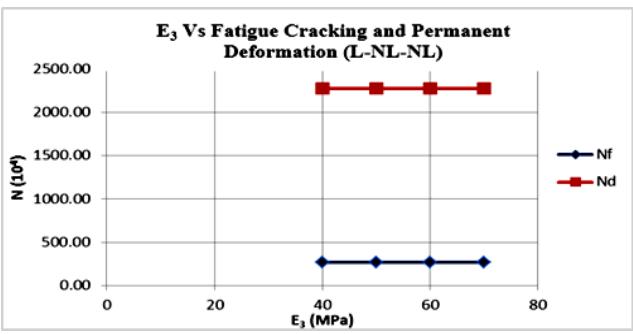
Figure 21. E3 to fatigue cracking and deformation permanent for L-L-L and L-NL-NL
criteria of permanent deformation for all material characteristics because Nd value is below Nf value.
- If the thickness of surface or base course is thin, the failure criteria is permanent deformation (Figure 17 and Figure 18) while if the thickness is higher, fatigue cracking is the failure criteria.
- The effect of resilient modulus of surface course , base course , and subgrade course (Figure 19 to Figure 21) is determined by criteria of fatigue cracking for all material characteristics.
- Thickness for base course is in optimal when the graph of permanent deformation intersects with fatigue cracking.
6. Conclusion
- Load type variant resulted that dual-tridem produce the biggest value of deflection followed by dualtandem and single-axle for all of material characteristics while vertical stress and strain, and horizontal stress and strain have insignificant impact to load configuration and its relationship is inversely proportional to depth.
- The variation of material characteristics shows that the flexible pavement responses (deflection, vertical strain, horizontal stress and stress) for L-L-L material are higher than L-NL-NL material, except for vertical stress which L-NL-NL has higher value than L-L-L.
- In service life analysis, the failure criteria for variation of loads (P), resilient modulus of surface course ( , base course ( , subgrade course xxxx is determined by the criteria of permanent deformation on all material characteristics; while thickness of surface course and base course is determined by permanent deformation if the thickness is low and fatigue cracking if its high and the optimum condition is the intersection of permanent deformation and fatigue cracking graph.