
Abstrak
Perubahan tata guna lahan yang tidak terkendali di daerah hulu aliran sungai dapat mengakibatkan erosi lahan, yang pada akhirnya akan meningkatkan sedimentasi di sungai dan banjir, mengurangi umur rencana waduk di hilirnya, serta menurunkan produktivitas tanah karena lapisan hara yang hilang. Penelitian ini ditujukan untuk mencari pola tata guna lahan yang terbaik dengan cara optimasi guna mengurangi tingkat erosi lahan. Model optimasi yang digunakan adalah metode program linier (LP) yang digabung dengan metode USLE dan software SIG (system informasi geografis) berbasis raster grid. Prediksi potensi sedimentasi dari data pengukuran sedimen di sungai digunakan untuk kalibrasi simulasi kondisi nyata erosi lahan. Hasil optimasi pada penelitian di Sub DAS Ciujung Hulu, Provinsi Banten, bisa didapat dengan merubah seluas mungkin areal ladang/tegalan yang sudah ada untuk menjadi kebun campuran atau hutan. Hasilnya dapat memperkecil tingkat erosi lahan sebesar 38,0%, atau turun dari semula sebesar 99.03 ton/ha/thn menjadi 61,32 ton/ha/thn. Namun hasil tersebut diatas tidak bisa berlaku secara umum di semua lokasi. Yang bisa berlaku umum adalah bahwa model optimasi dari studi ini dapat dipakai untuk mengurangi tingkat erosi lahan dengan mengatur luas areal dan penempatan lokasi jenis-jenis penggunaan lahan, dengan mempertimbangkan faktor erodibilitas tanah, kemiringan lereng, dan erosivitas hujan di lokasi.
Kata-kata kunci: Erosi lahan, tata guna lahan, program linier.
1. Introduction
Land erosion in upstream river basins is mainly caused by uncontrolled land use changes, where existing forest land is turned into farmlands, cornfields/moors or rice fields. Fields or land areas without sufficient vegetation cover will be susceptible to erosion by rain, especially on slope or steep terrain. A high level of land erosion
will eliminate the topsoil and its nutrients causing a decrease in soil productivity, flooding due to sedimentation in rivers, and a reduction in reservoir life plans.
Research related to the level of land erosion was conducted by Kim and Julien (2006) using the RUSLE and GIS (geographic information system) methods to model the level of erosion due to "Maemi" rainstorms in the Imha region, South Korea. Wulandari et al. (2013) conducted a simulation on land use change, but the spatial boundaries were not explained. Maryanto (2013) combined the USLE method with SDR to determine water quality indicators. Kaharuddin (2014) compared the results of SDR and USLE calculations as calibration measurements of sediment concentrations in the field. Nathalis (2013) used USLE and GIS to estimate erosion levels.
To reduce the land erosion level, proper planning and regulation of land use patterns in river basins is needed. To get the minimum erosion level and the best land use pattern, an optimization model with LP (Linear Programing) method can be used. The case study for this research was carried out in the Upper Ciujung river basin, where erosion and sedimentation were quite high due to uncontrolled land use changes.
The purpose of this study is to find the best land use pattern plan to reduce land erosion as much as possible and support the conservation of watersheds. Based on the current land use, a scenario for the best land use pattern is sought so that the erosion level in the Upper Ciujung river basin can be a minimum.
2. Research Location Condition
The location of this research is in the Upper Ciujung river basin (586,94 Km2 ), which is an upstream part of the Ciujung river basin in Pandeglang and Lebak districts, Banten province. The Upper Ciujung river basin is elongated with the Ciujung river as its main river which flows from south to north. Annual rainfall varies between 1,000 mm to 2700 mm, depending on location and topography.
The slope of the Upper Ciujung river basin varies from flat (2% - 7%) to very steep (> 24%). A flat area has a slope: 2-7% covering an area of 31,666 ha (54% of the total area). While the very steep area has a slope of > 24% covering an area of 411 ha (0.70% of the total area). Meanwhile, the remaining area (45.3% of the total area) slope varies between 7-24%. Forest land in the Upper Ciujung river basin is a secondary forest located on an area with steep slopes. The condition of land cover crops depends on land use, which is divided into forests, plantations, cornfields/moors, residential lands and rice fields. Plantations are dominated by rubber trees, and most cornfields/moors are planted with cassava. Rice fields consist of rainfed rice fields and irrigated fields.
There are 11 types of soil in the Upper Ciujung river basin. Based on its erodibility (sensitivity of soil to erosion), the type of soil that dominates is the reddishbrown latosol with an area of 145.50 Km2 or 25% of the watershed area. The reddish-brown latosol order is classified into the inceptisol order, and this type of soil is spread over gently sloping areas. The ultisol order yellow podzolic type has an area of 21% of the total watershed area and dominates in steep areas. Another type of soil that is quite widespread is the red podzolic by 15% or 86.5 Km2 of the total research area. The potential for erosion in the Upper Ciujung river basin is relatively high, so the potential for sedimentation in rivers will be high due to rain.
The map of Upper Ciujung river basin and the slope map at the research location can be seen in Figure 1 sections (a) and (b) on the next page.
3. Methodology
The methodology in this study consisted of several stages which included:
- Prediction of erosion levels using USLE and GIS (Geographic Information System) methods based on a 10 x 10 meter grid raster,
- determination of the erosion risk level and erosion risk index,
- sedimentation analysis, and
- optimization of land use patterns using the LP (Linear Programing) method to minimize land erosion.
3.1 Prediction of erosion levels
Prediction of land erosion level was obtained from the USLE formula: A = R x K x L x S x C x P, and the raster-based SIG software (Desmet, 1996). From the topographic map data, land use, soil types, rainfall data, and land management data (conservation efforts), the parameter in the USLE formula could be determined. The data was then processed using rasterbased GIS software to predict erosion levels. At this stage, the data used was a DEM (Digital Elevation Model) map to determine the LS factor, land cover to determine the C factor, land management (conservation efforts) for the P factor, regional rainfall for the R factor, and the soil type for the K factor.
Erosion on a land can be divided into 2 types:
1. Potential erosion, erosion focused on factors outside the influence of human activities, such as land slope and soil type. (1)
\[A\]-pot = \(R \times K \times LS\)
2. Actual erosion, similar to the potential erosion, but added with factors that are strongly influenced by human activities, such as land cover vegetation and land use conservation efforts (2)
\[A\]-\(act = R x K x LS x CP\)
3.1.1 Rain erosivity (R)
Bols, 1978 (in Arsyad, 2010), suggested that the rain erosivity factor (R) can be represented in the EI (erosivity index) of average monthly rainfall. The value of EI is proportional to the total rainfall for rainfall events multiplied by the maximum rainfall intensity of 30 minutes. Determining the value of the average monthly rain erosivity index is as follows:
\[EI_{30} = 6.12(RAIN)^{3.21}(DAYS)^{-0.47}(MAXP)^{0.53}\] (3)
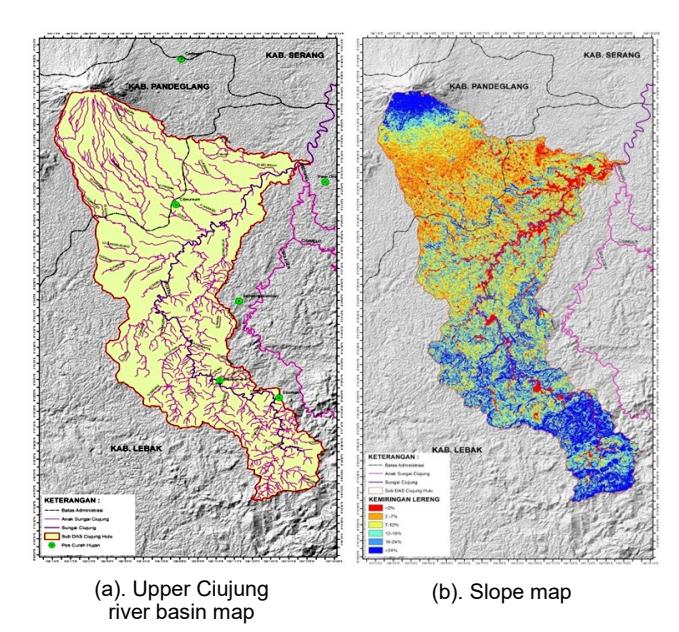
Figure 1. Research location map
where :
EI30 = Average rain erosivity index (unit/month)
RAIN = Monthly rainfall (cm)
DAYS = Monthly rainy day (day)
MAXP = Maximum rainfall of the month (cm)
3.1.2. Soil erodibility (K)
Soil erodibility factor (K) is a parameter that shows the ability of the soil to resist the release of soil grains by falling rainwater. The value of the soil erodibility factor is strongly influenced by soil structure / texture, slope, organic matter content, and soil permeability. Estimation of the value of soil erodibility can be determined by nomographs based on data on the percentage of very fine sand and dust, sand, organic matter, and soil structure and permeability. The estimated value of K for soil types in Indonesia is based on previous research published by the Bandung Water Resources Research and Development Center.
Besides using nomographs, soil erodibility can be calculated using the following equation:
\[100K = 1,292[2, IM^{1.21}(10^4)(12-a) + 3,25(b-2) + 2,5(c-3)]\] (4) where:
M = Percentage of very fine sand and dust (diameter of 0,1-0,05 and 0,05-0,02 mm) x (100 – clay percentage)
a = Percentage of organic matters
b = Soil structure code
c = Soil permeability class
3.1.3. Slope index (LS)
Slope length factor (L) and steepness factor (S) are erosion parameters of land with a slope length of 22.1 meters and a slope of 9%. In calculating the LS value, (Foster et.al., 1997) provided a formula:
\[L = \left(\frac{\lambda}{22 J_3}\right)^m \tag{5}\]
\[m = \frac{F}{(l+F)} \tag{6}\]
\[F = \frac{\sin \beta / 0,0896}{3(\sin \beta)^{0.8} + 0.56} \tag{7}\]
Slope length is measured from the map obtained, with the understanding that erosion occurred due to overland flow, with the slope length from overland flow to the water point entering the catchment channel. So, to determine the slope length of the overland flow, the following formula (Desmet dan Govers, 1996) is used:
\[\lambda_{(i,j)} = \frac{\left(A_{(i,j)} + D^2\right)^{m+l} - A_{(i,j)}^{m+l}}{x_{i,j}^{m} D^{m+2} (22,13)^m}\] (8)
Where:
L = slope length (m)
m = slope length constant
F = rill erosion ratio parameter
β = slope angle (o )
λ = slope length of overland flow per pixel unit (m)
x = sin ai,j + cos ai,j, ai,j= direction of the cell grid aspect with coordinates
A = contribution area to the inlet in the cell grid
D = pixel size in the map (x, y) as a correction factor
3.1.4. Cropping index (C)
The C parameter is the overall effect of vegetation, litter, soil surface conditions and land management on erosion. At this time, the C parameter in the USLE formula has been modified to be used in determining the amount of erosion in forests or lands (Hammer, 1981, dalam Hardjowigeno, 2007).
3.1.5. Soil conservation / management Index (P)
The P factor is the ratio between average eroded soil from land that received certain conservation treatment to average eroded soil from land cultivated without conservation action, provided the other factors causing erosion are assumed to be unchanged. The soil conservation index (P) value can be seen in the table. (Arsyad, 2010). In addition to the table, the soil conservation index (P) value in the field will be easier to determine if combined with the (C) factor, because the two factors are closely related. Some factor values (CP) can also be seen in the table (Arsyad, 2010).
Graphically, the procedure for predicting erosion levels using the USLE method and raster-based GIS software is as shown in the flow chart (Figure 2) on the following page.
3.2. Determining the erosion hazard level (EHL) and erosion hazard index (EHI)
The Erosion Risk Level (ERL) or Tolerable Soil Loss (TSL) is calculated according to the formula as follows (Hammer, 1981, in Banuwa, 2013):
\[TSL = \frac{De}{SRL} \tag{9}\] where :
TSL = Tolerable Soil Loss (mm/year)
De = Equivalent depth = Soil effective depth
(mm) x soil depth factors
SRL = Soil Resources Life, a sufficient time to preserve soil sustainability
Erosion Risk index (ERI) is an indication of the size of erosion hazard on a land, to find out to what extent erosion will endanger the sustainability of soil productivity. The difference between ERL and ERI lies in the method of determining its value. The erosion risk level (ERL) is determined based on the ratio between the amount of soil eroded to the effective soil without regard to the expected sustainability period, the amount of erosion allowed and the speed of the process of soil formation. While the erosion risk index (ERI) is determined based on the following equation:
\[ERI = \frac{Potential \ of \ Erosion}{TSL} \tag{10}\]
Where:
ERI = Erosion Risk Index Potential of Erosion = Erosion without human influence (ton/ha/year)
TSL = Tolerable Soil Loss (mm/year)
3.3 Sedimentation potential analysis
Comparison between the measured sediment in the channel or river and erosion in the land is called the ratio of sediment transport, the sedimentation potential or sediment delivery ratio (SDR). There is no precise method for estimating SDR even though the USDA has issued guidelines where SDR is very dependent on watershed area (Kim, 2006). SDR can be influenced by several factors including sediment source, texture, rainfall factor and its position with the main river (Boyce, 1975, Suresh, 1997, USDA-SCS, 1972, and Vanoni, 1975). In estimating SDR (sedimentation potential), the size of the watershed area must be defined. The wider the watershed size, the smaller the SDR value. This is because a broad watershed has many opportunities for deposition of soil particles. There are three SDR equations:
Vanoni (1975) SDR = 0,4724 A-0,125 Boyce (1975) SDR = 0,3750 A-0,2382 USDA SCS (1972) SDR = 0,5656 A-0,11
Thus, the sediment production in a year for a watershed area of A km2 can be formulated as:
\[S-spot = E_A (SDR)\] (11)
where:
S-pot = Yearly sediment production SDR = Sediment Delivery Ratio EA = Total erosion per unit area A = Watershed area (km2 )
Figure 2. Procedure for predicting erosion levels using the USLE method.
3.4. Land use optimization with linear program
Optimization of land use planning here is done as an effort to minimize erosion and emphasizes the modification of land use factor (factor C) because this factor is a factor that can be engineered. There are 3 scenarios used in formulating the mathematical optimization models in the Upper Ciujung river basin, where the difference is in the composition and the extent of land use. The general form of a linear programming model (Bazaraa, 1990, dan Mays, 1992) is as follows:
Objective Function:
Minimize: \[Z = c_1 x_1 + c_2 x_2 + \dots + c_n x_n\] (12)
Constraint:
\[a_{11}x_{11} + a_{12}x_{12} + \dots + a_{1m}x_{1m} \ge b_1\] \[a_{21}x_{21} + a_{22}x_{22} + \dots + a_{2m}x_{2m} \ge b_2\] \[\dots\] \[a_{n1}x_{n1} + a_{n2}x_{n2} + \dots + a_{nm}x_{nm} \ge b_n\] \[x_1, x_2, \dots, x_n \ge 0\] where:
= area of land use type n
n = 1, 2,……, m.
= objective function value
= erosion value of each land use (n), in this case of minimization shows erosion (ton/ha/ year).
= previous land use area.
= the number of n preferences needed to produce the area of the m-land allocation.
3.4.1. Scenario I
Scenario I is a simulation of land use patterns that currently exist in the Upper Ciujung river basin. The data used in this study are land use data in 2014. The purpose of this scenario is to see the erosion and sedimentation conditions caused by land use in the current real condition.
3.4.2. Scenario II
Scenario II is the composition of land use based on the optimization of spatial use patterns approaching the direction of the spatial regional plan (Indonesian: RTRW) especially in Lebak and Pandeglang Regencies, Banten Province, especially in the Upper Ciujung river basin.
The land use allocation scheme for this scenario is as follows:
- 1. Sub-watershed area is the total area.
- 2. The residential land area is assumed to be constant.
- 3. At least 4% of the cornfields/moors area is converted to rice fields.
- 4. At least 10% of the cornfields/moors area is converted to forest land.
- 5. At least 26% of the cornfields/moors area is converted to plantation.
- 6. The maximum area for conversion of cornfields/ moors area is 60% from the initial.
- 7. The plantation area is increasing and serves to reduce erosion.
- 8. The land area must be positive.
Based on those assumptions, the mathematical model scenario from optimization analysis to minimize erosion (Z) can be stated with the following equation:
Objective Function:
Minimum \[Z = \frac{C_1X_1+C_2X_1+C_3X_3+C_4X_4+C_5X_5}{X_1+X_2+X_3+X_4+X_5}\] (13)
Constraint:
\[X_1+X_2+X_3+X_4+X_5 = InX_1+InX_2+InX_3+InX_4+InX_5\]
where:
: Erosion (ton/ha/year)
: Erosion level of forest land use
: Erosion level of plantation land use
: Erosion level of field/dry land use
: Erosion level of residential land use
: Erosion level of rice field use
: Forest area
: Plantation area
: Cornfields/moors area
: Residential land area
: Rice field area
: Initial forest area
: Initial plantation area
: Initial cornfields/moors area
: Initial residential land area : Initial rice field area
3.4.3 Scenario III
Scenario III is the composition of land use based on the optimization of spatial use patterns approaching the direction of the spatial regional plan (Indonesian: RTRW) especially in Lebak and Pandeglang Regencies, Banten Province, especially in the Upper Ciujung river basin. The land use allocation scheme for this scenario is as follows:
- 1. Sub-watershed area is the total area.
- 2. The residential land area is assumed to be constant.
- 3. At least 8% of the cornfields/moors area is converted to rice fields.
- 4. At least 19% of the cornfields/moors area is converted to forest land.
- 5. At least 33% of the cornfields/moors area is converted to plantation.
- 6. The maximum area for conversion of cornfields/ moors area is 80% from the initial.
- 7. The plantation area is increasing and serves to reduce erosion.
- 8. The land area must be positive.
Based on those assumptions, the mathematical model scenario from optimization analysis to minimize erosion (Z) can be stated with the following equation and inequation:
Objective Function:
\[Minimum Z = \frac{C_1X_1 + C_2X_1 + C_3X_3 + C_4X_4 + C_5X_5}{X_1 + X_2 + X_3 + X_4 + X_5}\] (14)
Constraint:
4. Results and Discussion
4.1 Erosion analysis based on land use optimization
The results of the erosion estimation analysis for each unit area of land obtained by the USLE method were from the erosivity factor (R), erodibility (K), slope and slope length (LS), land use (C), and conservation effort factors (P), along with spatial data from GIS. The linear program formulation for obtaining land use allocation for each scenario is as follows:
\[Min Z = \frac{54,75X_1 + 101,21X_1 + 137,81X_3 + 7,64X_4 + 1,83X_5}{X_1 + X_2 + X_3 + X_4 + X_5}\](15)
: Erosion (ton/ha/year)
: Forest area
: Plantation area
: Cornfields/moors area : Residential land area
: Rice field area
The optimization results are shown in Tables 1, 2 and 3.
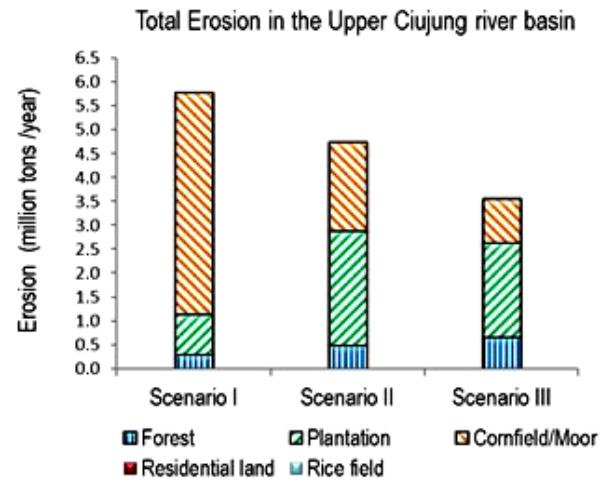
From the optimization results, Tables 1 and 2 on the previous page show the optimal land use patterns to make land erosion minimal. Land use for cornfields/ moors that had the greatest level of erosion, most of the area was converted to forests, plantations, residential lands, and rice fields. This caused the erosion rate of Upper Ciujung river basin to be reduced from the original. Table 1 displays the total erosion in the Upper Ciujung river basin in scenario I (existing condition) of 5,812,717 tons/yr, reduced in scenarios II and III to 4,777,619 and 3,598,928 tons/yr. The total erosion in the Upper Ciujung river basin optimization results for each land use scenario is shown in Figure 3. Table 3 shows the erosion risk index (ERI) which could be reduced from 8.0 in existing conditions (scenario I) to 4.9 in scenario III.
4.2 Optimization Result Calibration
Calibration of the scenario I optimization results (simulation of existing conditions) was done by comparing the calculation results of direct measurement sediment data from locations near the Rangkas II bridge (Ciujung river), and near the Keong bridge (Ciboleger river), near the meeting point of the
Ciujung river and Ciboleger river (Ciujung tributary). Sediment data from the Upper Ciujung river basin were obtained from sediment data from the Rangkas bridge minus sediment from the Keong bridge. The elevated sediment measurement procedure followed the SNI 3414-2008 standard. Measurements were made once a month (year 2013-2015). From the data obtained, river discharge during the measurement varied greatly, which was likely to be triggered due to the recent heavy rainfall upstream.
Table 4 and table 5 show the sediment data conversion measurement to land erosion based on potential sedimentation analysis (SDR). From tables 4 and 5, the average SDR calculation result with Boyce method shows the value closest to the optimization results in Scenario I, so that the land erosion optimization results in the Upper Ciujung river basin with linear programming can be considered as approaching the conditions in the field.
Source: Optimization Result
Figure 3. Total erosion in upper Ciujung river basin (million tons/year) for each land use scenario
Table 1. Total Land Erosion based on land use optimization scenarios in the Upper Ciujung river basin
| Optimization | Forest (ton/year) | Plantation (ton/year) | Cornfields/Moors (ton/year) | Residential Land (ton/year) | Rice Field (ton/year) | Total Erosion in Sub Watersheds (ton/year) |
|---|---|---|---|---|---|---|
| Scenario I | 282.331 | 834.533 | 4.664.550 | 13.614 | 17.687 | 5.812.717 |
| Scenario II | 467.643 | 2.410.373 | 1.865.820 | 13.614 | 20.166 | 4.777.619 |
| Scenario III | 652.955 | 1.965.027 | 932.910 | 13.614 | 34.420 | 3.598.928 |
Table 2. The area in the Upper Ciujung river basin based on land use optimization scenarios
| No | Land Use | Scenario I | Scenario II | Scenario III | |||
|---|---|---|---|---|---|---|---|
| (ha) | (%) | (ha) | (%) | (ha) | (%) | ||
| 1 | Forests | 5.156,9 | 9 | 8.541,7 | 15 | 11.926,6 | 20 |
| 2 | Plantations | 8.245,6 | 14 | 23.815,8 | 41 | 19.415,5 | 33 |
| 3 | Cornfields/Moors | 33.848,2 | 58 | 13.539,3 | 23 | 6.769,6 | 12 |
| 4 | Residential Lands | 1.782,8 | 3 | 1.782,8 | 3 | 1.782,8 | 3 |
| 5 | Rice Fields | 9.660,7 | 16 | 11.014,6 | 19 | 18.799,7 | 32 |
| Total | 58.694,2 | 100 | 58.694,2 | 100 | 58.694,2 | 100 | |
218 Jurnal Teknik Sipil
Table 3. ERI (Erosion Risk Index) Recapitulation for each scenario in the Upper Ciujung river basin
| No | Land Use | Average Erosion | TSL | ERI | |
|---|---|---|---|---|---|
| Lana 036 | (ton/ha/year) | (ton/ha/year) | |||
| 1 | Scenario I | 99,03 | 12,42 | 8,0 (high | |
| 2 | Scenario II | 81,40 | 12,42 | 6,6 (medium high) | |
| 3 | Scenario III | 61,32 | 12,42 | 4,9 (low high) | |
Table 4. Erosion prediction results using the SDR method from the measurement data
| Year | Total Sediment/Year (10³ ton/year) | Erosion (Vanoni) ton/ha/year | Erosion (Boyce) ton/ha/year | Erosion (USDA) ton/ha/year |
|---|---|---|---|---|
| 2013 | 401,33 | 32,11 | 83,24 | 24,37 |
| 2014 | 469,83 | 37,59 | 97,45 | 28,54 |
| 2015 | 496,75 | 39,75 | 103,04 | 30,17 |
| Average | 455,97 | 36,48 | 94,58 | 27,69 |
Table 5. Comparison of sediment volume for each scenario
| Analysis Type | Erosion ton/ha/year | Subwatershed Area km² | SDR-Boyce | S-pot 10³ ton/year | γsi ton/m³ | Vol S-pot m³/year |
|---|---|---|---|---|---|---|
| SDR Method | 94,58 | 587 | 0,08 | 455,97 | 1,5 | 303.981,1 |
| Scenario I | 99,03 | 587 | 0,08 | 477,45 | 1,5 | 318.302,3 |
| Scenario II | 81,40 | 587 | 0,08 | 392,43 | 1,5 | 261.620,7 |
| Scenario III | 61,32 | 587 | 0,08 | 295,61 | 1,5 | 197.076,0 |
Where \(\gamma_{si}\) = volume weight of sediment in water (1,5-1,8 ton/m<sup>3</sup>), \(V_{S-pot}\) = potential volume of sediment
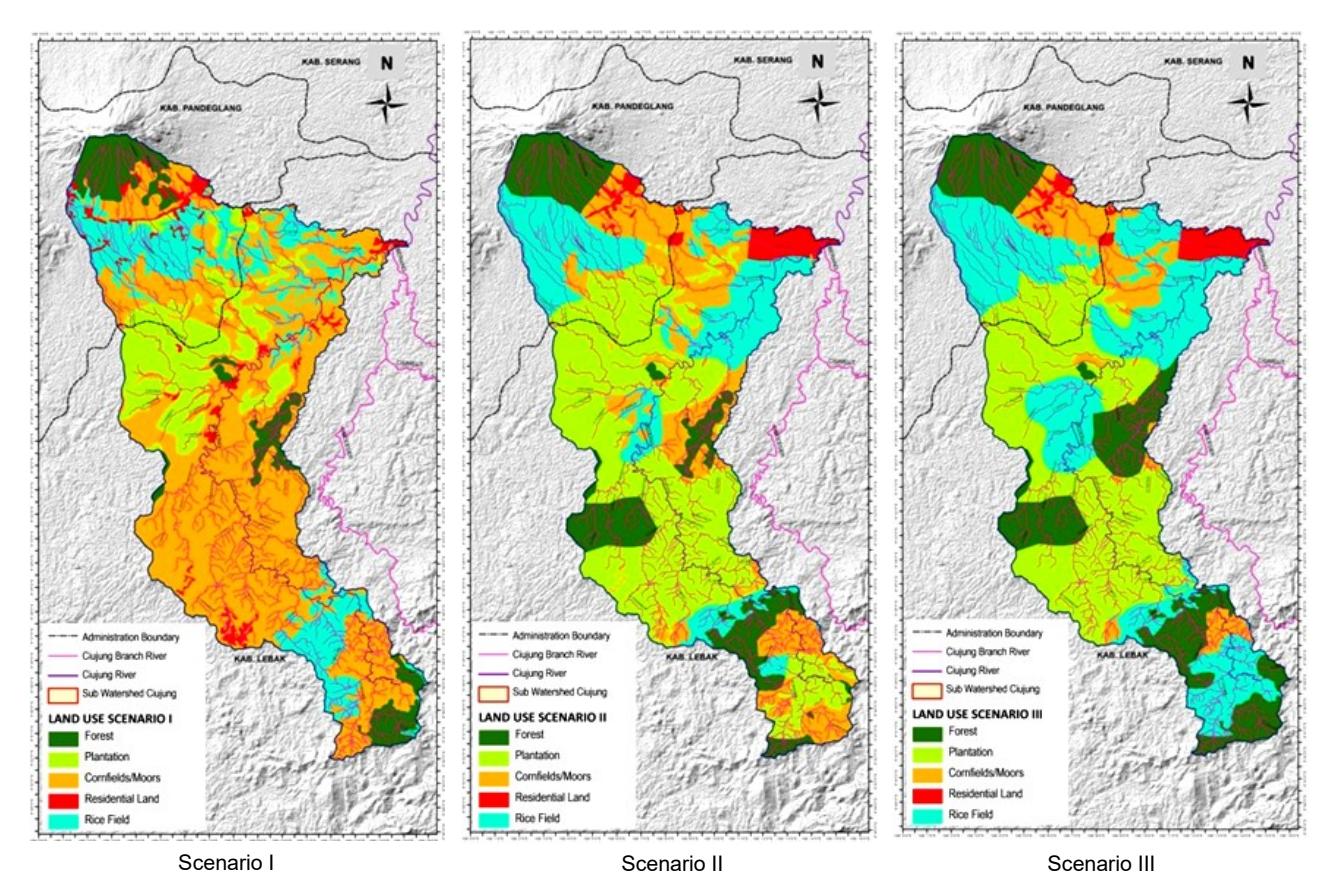
Figure 4. The optimal land use map for each land use scenario in the Upper Ciujung river basin (Source: optimization result)
4.3. Land use and land erosion level
Based on the calibration results above and the optimization calculation data in Table 1 and Table 2, an erosion level map for each land use scenario in the Upper
Ciujung river basin is displayed in Figure 5. Table 6 shows a recapitulation of land erosion level (tons/ha/ year) of each optimal land use (forest, plantation, cornfields/moors, residential lands, and rice fields) for each land use scenario in the Upper Ciujung river basin.
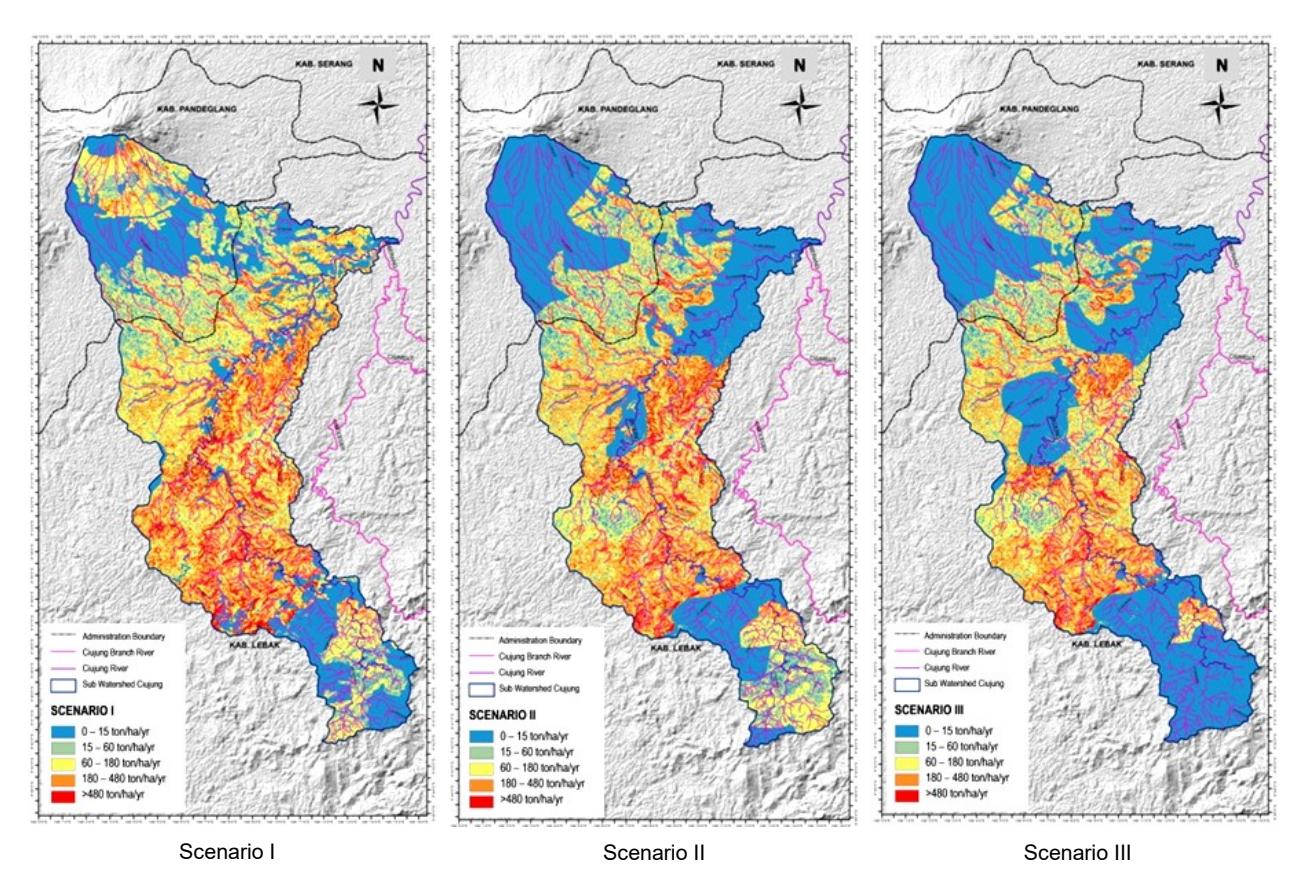
Figure 5. Erosion level map for each land use scenario in the Ciujung hulu sub watershed (Source: optimization result)
Table 6. Recapitulation of optimal land use erosion level for each scenario
| Optimization | Erosion | Forest | Plantation | Cornfields/Moors | Residential Land | Rice Field |
|---|---|---|---|---|---|---|
| ton/ha/year | (ha) | (ha) | (ha) | (ha) | (ha) | |
| Scenario 1 | 99,03 | 5156,93 | 8245,64 | 33848,18 | 1782,84 | 9660,66 |
| Scenario 2 | 81,40 | 8541,75 | 23815,81 | 13539,27 | 1782,84 | 11014,59 |
| Scenario 3 | 61,32 | 11926,57 | 19415,54 | 6769,64 | 1782,84 | 18799,67 |
4.4. Discussion
Simulation results of the existing conditions of land use patterns in the Upper Ciujung river basin calibrated using the SDR method show that the area had a level of land erosion risk of 99.03 tons/ha/yr. The erosion risk level could be reduced if land use patterns could be set based on the location of land use types (forests, plantations, cornfields/moors, residential lands, rice fields) along with the area of each location. The location of this type of land use was determined by the factors of soil erodibility, slope, and rain erosivity.
From the land use patterns optimization results in Scenario II, allocating 15% of land area for forests, 41% for plantations, 23% for cornfields/moors, 3% for residential lands, and 19% for rice fields could reduce the land erosion level to 81.40 ton/ha/yr, 17.8% smaller than the initial (99.03 tons/ha/yr).
From the optimization results in Scenario III, allocating 20% of land area for forests, 33% for plantations, 12% for cornfields/moors, 3% for residential lands, and 32% for rice fields, could reduce the land erosion level by 38.0%, or decrease to 61,32 tons/ha/yr from the initial (99.03 tons/ha/yr)
The percentage allocation of optimal land use in scenario II and III above resulted from the constraints compiled in the land use allocation scheme for scenarios II and III in sub-chapters 3.3.2 and 3.4.3 of this paper. Optimal results in this case study are by changing the area of cornfields/moors as large as possible to become plantations or even forests. In principle, land use areas that resulted in high erosion levels should be changed as large as possible to land use areas that resulted in lower erosion levels.
5. Conclusions
1. Optimization models in the land use planning pattern using the linear program method (LP) could be used to reduce the land erosion level by regulating or improving the location of land use types (forests, plantations, cornfields/moors, residential lands, and rice fields) along with the area of each location.
- 2. In the case study in the Upper Ciujung river basin, optimal results could be achieved by changing the largest possible land area (existing) into plantations or even forests, like the results of optimization in scenario III. By allocating 20% of land area for forests, 33% for plantations, 12% of cornfields/ moors, 3% for residential lands, and 32% for rice fields, it could reduce the land erosion level by 38.0%, or decreasing from the initial 99.03 tons/ha/ year to 61.32 tons/ha/year.
- 3. Percentage changes in land use as mentioned above to reduce the land erosion level, however, they cannot be generally applied in all locations. What can be generally accepted is that the optimization model of this study can be used to reduce the land erosion level by regulating the area and location of land use types (for example: forests, plantations, cornfields/ moors, residential lands, and rice fields) in the right location. The location is determined by the factors of soil erodibility, slope, and rain erosivity at the site being reviewed.