
Abstrak
Sungai Tanggul terletak di Kabupaten Jember Provinsi Jawa Timur mengalami luapan banjir setiap tahun. Adanya peningkatan debit banjir, penurunan kapasitas sungai dan kemiringan yang landai diduga menjadi penyebab luapan banjir. Pada kajian ini akan menganalisis Sungai Tanggul kondisi full bank capacity dengan debit banjir rencana periode ulang 2, 5, 10, 20 dan 25 tahun, selanjutnya menganalisis skenario pengendalian banjir, indeks kehandalan dan kelayakan ekonomi. Upaya pengendalian banjir dilakukan secara struktural dengan normalisasi sungai, pembangunan pelimpah samping, peninggian tanggul dan kombinasi dari ketiga kegiatan tersebut. Analisis hidrolika 1 dimensi dan 2 dimensi menggunakan software HEC-RAS versi 5.06, analisis indeks kehandalan dengan metode Safety Factor (SF) dan First-Order Second Moment (FOSM), dan analisis kelayakan ekonomi dengan metode Benefit Cost (B/C) Ratio. Komponen benefit berupa pengurangan genangan banjir yang dianalisis dengan software QGIS dan Open Street Map (OSM), sedangkan komponen cost berupa biaya konstruksi pengendalian banjir. Berdasarkan hasil kajian, diperoleh kapasitas Sungai Tanggul kondisi full bank capacity yang bersesuaian dengan banjir periode ulang 5 tahun, upaya pengendalian banjir yang direkomendasikan berupa normalisasi sungai dan peninggian tanggul dengan nilai B/C Ratio 1,7, reduksi banjir 62,88 %, Indeks kehandalan metode SF 1,07 dan metode FOSM 97,05%.
Kata-kata Kunci: Reduksi banjir, indeks kehandalan, kelayakan ekonomi.
1. Introduction
Tanggul River, located in Jember Regency with a length of about 48.5 km, experiences floods almost every year. A great flood that occurred in 2013 resulted in the inundation of approximately 1000 residential areas and 500 ha of agricultural land with a height of inundation between 0.5 to 1.5 m. Floods can be caused by extreme rainfall, damage to watersheds, planning
errors in river channel construction and silting of rivers (Maryono, 2005). In addition, the morphological conditions of the meandering river downstream and low slope are thought to be the cause of flood in Tanggul River. In certain conditions, the flood can disrupt activities and cause losses both materially and fatality, so control efforts are needed to reduce the impact of losses (Kodoatie, R.J. and Sugiyanto, 2002).
This study is intended to determine the existing capacity of Tanggul River and flood control efforts to be carried out. Meanwhile, the aim is to analyze the existing river capacity in full bank capacity, reduction of flood inundation with discharge plan for a 25-year return period (Q25), river reliability index for existing conditions and based on river handling scenarios and economic feasibility analysis.
2. Literature Review
2.1 Reliability analysis
Reliability is the probability of successful performance; thus, it is the converse of the term probability of failure (Haldar and Mahadevan, 2000). Meanwhile, according to Tung et.al. (2006), reliability is the possibility of non-failure where the level of resistance of the system exceeds the load it receives. In general, reliability is related to the chances of a building succeeding from threats that might occur, so the concept of probability becomes an important thing in reliability analysis. The concept of probability is indispensable for consistent building and based on a logical basis for carrying out reliability analysis and for developing feasible planning criteria (Ang, 1975).
There are two parameters in the reliability analysis: load and resistance. The load parameter is the average discharge in the river, while the resistance parameter is the average river capacity, which is influenced by several variables: river depth (h), river width (b), river slope (m), river longitudinal slope (i), and manning's roughness value (n) which are free and random.
2.2 Safety factor (SF) method
Safety Factor (SF) is the comparison of random average resistance (R) and average load (L). In engineering, they are known as the nominal resistance and nominal load, with the following equation:
\[\frac{Rn}{Ln} \ge SF \tag{1}\]
Where
Rn = Nominal resistance
Ln = Nominal load
SF = Safety factor
\[Rn = R + sRF-1(aR)\] (2)
with aR=5% - 10%
\[Ln = L + sLF-1(1-aL)\] (3)
with aL=50% - 2%
Where σR = Standard deviation of resistance
σL = Standard deviation of load
Φ = Cumulative standard normal distribution
αR = Design Failure Resistance
αL = Design Failure Load
2.3 First - order second moment (FOSM)
The concept of the FOSM method is to make the load, resistance and parameters that produce the load and resistance in a normal distribution, so that the probability of failure can be determined from the distribution (Mays, 2005). The average load and resistance equation, standard deviation and coefficient of variation are obtained from estimates of the first order of Taylor series expansion (Benjamin dan Cornell, 1970), with the following equation:
\[P_{\rm r} = \Phi \left( \frac{\overline{R} - \overline{L}}{\sqrt{\sigma_{\rm R}^2 + \sigma_{\rm L}^2}} \right) \tag{4}\]
\[P_{\rm r} = \Phi\left(\frac{\overline{R} - \overline{L}}{\sqrt{(\overline{R}\Omega_{\rm R})^2 + (\overline{L}\Omega_{\rm L})^2}}\right)\] (5)
Where
Pr = Resistance probability and = Average resistance and load and = Standard deviation and = Coefficient of variation
= Cumulative standard normal distribution
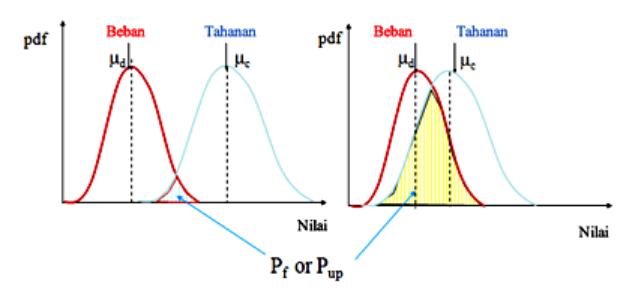
Figure 1. Load and resistance probability distribution function
2.4 Hydraulic analysis
The hydraulic analysis in this study was carried out with unsteady flow for 1-dimension and 2-dimension. The 2-dimensional equation is presented as follows: (Users Manual HEC-RAS 5.06, 2018).
1. Mass Conservation Equation
\[\frac{\partial H}{\partial t} + \frac{\partial hu}{\partial x} + \frac{\partial hv}{\partial y} + q = 0 \tag{6}\]
Where
H = Surface elevation
h = Water depth
u and v = Velocity in the direction of cartesian axis
q = Flow discharge
2. Shallow Water (SW) Equation
The Shallow Water (SW) Equation in momentum conservation is:
\[\frac{\partial \mathbf{u}}{\partial \mathbf{t}} + \frac{\partial \mathbf{u}}{\partial \mathbf{x}} + \mathbf{v} \frac{\partial \mathbf{u}}{\partial \mathbf{v}} = -\mathbf{g} \frac{\partial \mathbf{H}}{\partial \mathbf{x}} + \mathbf{v} \mathbf{t} \left( \frac{\partial^2 \mathbf{u}}{\partial \mathbf{x}^2} + \frac{\partial^2 \mathbf{u}}{\partial \mathbf{v}^2} \right) - \mathbf{c} \mathbf{f} \mathbf{u} + \mathbf{f} \mathbf{v}\] (7)
Where u and v = Velocity in the direction of cartesian axis
g = Speed of gravity
vt = Coefficient of eddy viscosity
cf = Coefficient of friction R = Hydraulic radius F = Coriolis Parameters 3. The diffusive wave approximation of the shallow water (DSW) equation is:
\[\frac{\partial H}{\partial t} - \nabla \cdot \beta \nabla H + q = 0 \tag{8}\]
\[\beta = \frac{(RH)^{(\frac{5}{2})}}{n(\nabla H)^{\frac{1}{2}}} \tag{9}\]
Where
= Surface elevation gradient
n = Manning's roughness
3. Data and Methodology
3.1 Data collection
The data used for analysis in this study include the daily rainfall data on 7 (seven) rain station (the last 13 years), Pondok Waluh weir daily discharge data (the last 13 years), river geometry data, digital elevation model data (resolution of 8.1 m), hourly tidal data (18 days), land use data (2014), flood distribution data and infrastructure data from the open street map.
3.2 Hydrological analysis
The hydrological analysis began with a test for consistency of rainfall data. This test was conducted to find any deviation from the original trend using the Double Mass Curve method (Sri Harto, 1993). Furthermore, an abnormality test was conducted using the Outlier-Inlier method to find any deviation from the trend of the group because it would interfere with the hydrological analysis (Chow, 1988). The regional average rainfall was carried out using the Polygon Thiessen method (Soemarto, 1999), while the design rainfall was carried out using the Normal, Log Normal, Person III, Log Person III and Gumbel distribution methods, then the frequency distribution suitability test was carried out using the Smirnov-Kolmogorov and Chi-Square methods (Soewarno, 1995).
In addition to the design rainfall, land use analysis was carried out to obtain the value of drainage coefficient (c) as input data for design flood discharge. Watersheds that are in good condition have drainage coefficient values near 0. Meanwhile, watersheds that are in damaged condition have drainage coefficient values near 1 (Kodoatie dan Syarief, 2005). The design flood discharge analysis was carried out by the Nakayasu Synthetic Unit Hydrograph (SUH) method, SCS, ITB 1 and ITB 2, which was then calibrated with the observation discharge in the Pondok Waluh Dam to obtain the SUH design
flood discharge approaching the real conditions in the field.
3.3 Hydraulic analysis
The hydraulics analysis in this study was done by doing 1 and 2 dimensional unsteady flow flood modeling using the HEC-RAS software version 5.06. Modeling was done for the existing river condition and the structural flood control planning. The flood control was carried out structurally through 5 (five) handling scenario plans, including: river normalization; side overflow construction; river normalization and embankment elevation; river normalization and side overflow construction; river normalization, side overflow construction and embankment elevation.
3.4 Resistance analysis
The river resistance analysis was carried out using the Safety Factor (SF) and First Order Second Moment (FOSM) methods. The resistance analysis with SF method was done by comparing the nominal resistance and the nominal load. The result of the comparison was a number with a certain value, where if SF ³ 1, the river capacity would be able to flow the water discharge safely. But if SF < 1, the river capacity would not be able to flow the water discharge safely. In calculating the nominal load and nominal resistance, the level of probability of failure that would acceptable for planning was determined, with the R value of 5% and the L value of 25%.
In the FOSM method, the concept of reliability analysis was done by dividing the average load and resistance value by the standard deviation of the average load and resistance, then the probability was calculated based on the values in the normal distribution. The average load and resistance calculations were based on the first derivation in the Manning's general formula. In this method, the probability of the safety rate and failure rate of the river capacity was obtained.
3.5 Economic analysis
The economic analysis was carried out using the Benefit Cost (B/C) Ratio method. The benefit was obtained from the infrastructure value due to the reduction of flood inundation through the interconnection between the flood inundation area resulted from running the 2-dimensional HEC-RAS and the infrastructure data from Open Steet Map (OSM) using the QGIS software. While cost was a budget plan needed in carrying out the flood control in accordance with the planned scenario.
4. Result and Discussion
4.1 Hydrological analysis
Based on the analysis results, the Gumbel Distribution was the most suitable distribution for the calculation of design rainfall. The flow coefficient (c) value in Tanggul watershed was 0.34. According to Kodoatie and Syarief, 2005, Watersheds that are in good
condition have drainage coefficient values near 0. Meanwhile, watersheds that are in damaged condition have drainage coefficient values near 1. For the design flood discharge that was close to the field measurement discharge in Pondok Waluh Dam was the ITB-2 SUH method with an NSE value of 0.95 (very good).
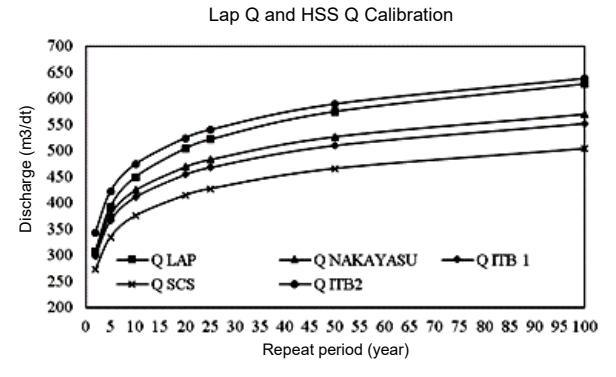
Figure 2. Field Q and SUH Q calibration graph
4.2 Hydraulics analysis
1. Existing condition
The river reference point in this study was 20 km with upstream boundary conditions in the form of selected design flood discharge data and downstream river boundary conditions in the form of hourly tidal data. Based on observations at the Pondok Waluh Dam, the highest discharge data that had occurred during the last 12 years was 483.68 m3 /second, where the value was close to the Q20 year design flood discharge. For safety considerations, the design flood discharge in this study was Q25 years, then the data was used in modeling the conditions of the existing and design river.
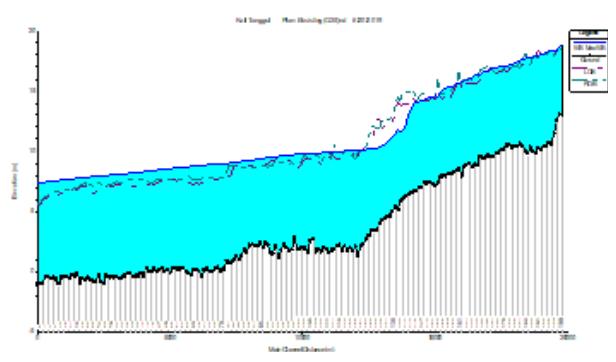
Figure 3. Longitudinal profile of the existing river
According to the results of the modeling, the existing conditions of the Tanggul River experienced flood runoff from downstream to cross-section 130 of 0.75 - 1.75 m and from cross-section 152 to upper river of 0.3 - 0.75 m with inundation area of 1,256.37 ha. The flood inundation covered 3 villages in Kencong Subdistrict: Kencong Village, Kraton Village, and Paseban Villages, with a flood inundation depth between 0.75 - 2 meters. Then, the results of the modeling were calibrated with flood events at the study site, which was the flood report of UPT PSDA East Java Province in Lumajang, with the flood inundation depth between 0.7 - 1.5 meters.
Figure 4. Flood inundation in the existing river
Based on the model accuracy test of the Root Mean Square Error (RMSE) method, a value of 0.44 was obtained, where the value was in the range of 0-1, so that the flood inundation modeling could be accepted because the inundation height of the modeling results approached the history of real flood events.

Figure 5. Inundation modeling with flood events calibration (2013)
2. River normalization
According to the results of field survey and measurements, the existing cross-section of the Tanggul River was with a shape of a double trapezoid with an average riverbed width (b) of 20 m, average river top width of 80-90 m and depth (h) of 6-7 m. The first scenario of a flood control plan was river normalization by widening the riverbed (b) by 30 m and the slope of the embankment of 1:2.
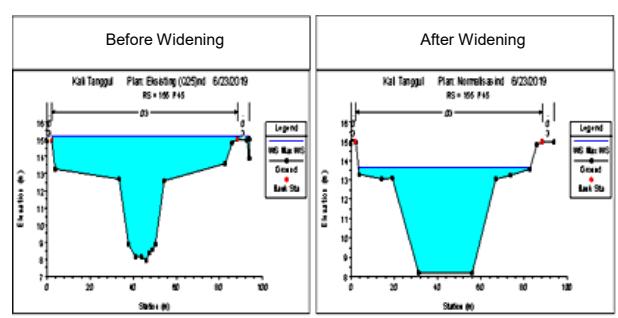
Figure 6. Cross-profile of the tanggul river before and after widening
Handling with river normalization could reduce flood inundation from 1256.37 ha to 884.75 ha, or a decrease by 371.62 ha (29.58%).
3. Side overflow contruction
The flood inundation scenario was carried out by constructing a side overflow downstream of river
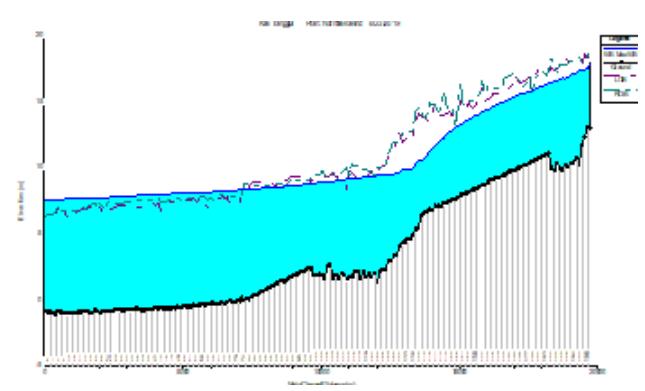
Figure 7. Longitudinal profile of river normalization
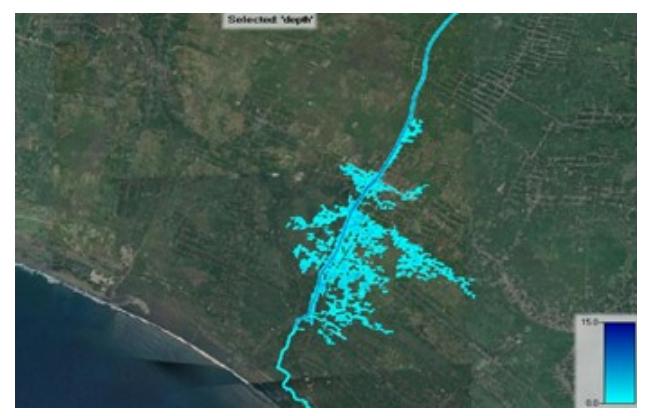
Figure 8. Flood inundation handling of river normalization
bends in cross-section 82. The side overflow design was made with the existing river scenario, still functioning to flow 200 m<sup>3</sup>/second of discharge downstream and a plan width (b) of 50m in order to be able to drain and reduce the peak discharge load of with a height (h) of 3 m from the riverbed in the upstream and 4.5 m from the riverbed in the downstream.
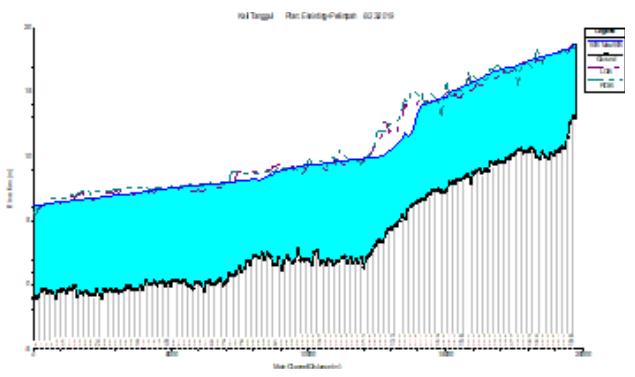
Figure 9. Longitudinal cross section of flood overflow handling
Handling floods with the side overflow construction could reduce the peak flood discharge by 173.88 m<sup>3</sup>/sec by reducing flood inundation from 1256.37 ha to 647.31 ha, or a decrease by 609.06 ha (48.48%).
4. River normalization and embankment elevation
Flood handling was done by river normalization and embankment elevation at locations that experienced flood runoff from downstream to cross section 73. The design of the embankment was in the form of an additional height of \(1.5\,\,\text{m}\), a base width of \(6\,\,\text{m}\) and an upper width of \(4\,\,\text{m}\). The number of embankment elevation cross sections was 74 points with a total length of 7,400 m and an elevation volume of 111,000
Figure 10. Food inundation of side overflow handling
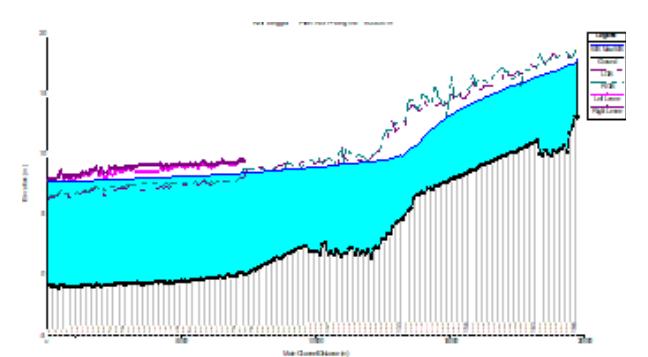
Figure 11. Longitudinal cross section of river normalization and embankment elevation
Figure 12. Flood inundation of river normalization and embankment elevation
5. River normalization and side overflow construction
River normalization aimed to increase the embankment capacity of the Tanggul River, while the construction of side overflow aimed to reduce the peak flood discharge. The combination of these activities was expected to reduce flood inundation well. Handling with river normalization and side overflow construction could reduce flood inundation from 1256.37 ha to 319.22 ha, or a decrease by 937.15 ha (74.59%).
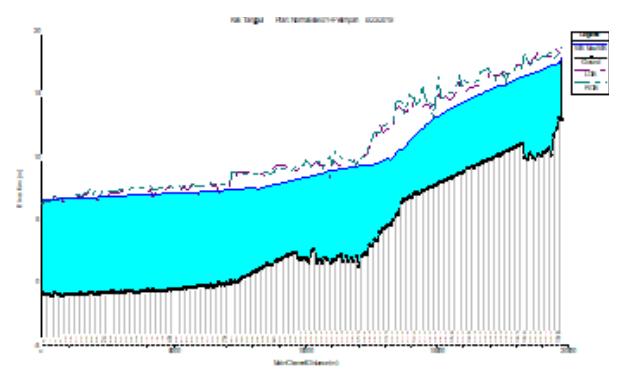
Figure 13. Longitudinal cross section of river normalization and side overflow construction
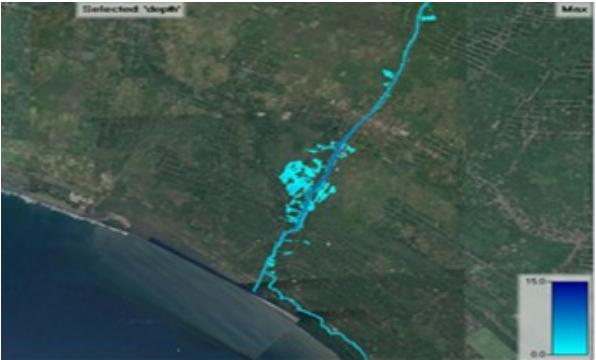
Figure 14. Flood inundation of river normalization and side overflow construction
6. Normalization, side overflow construction, and embankment elevation
The fifth flood handling scenario was carried out with a combination of the three activities to significantly reduce the inundation. The results of modeling with this handling could reduce flood inundation by a total of 1256.37 ha (100%).
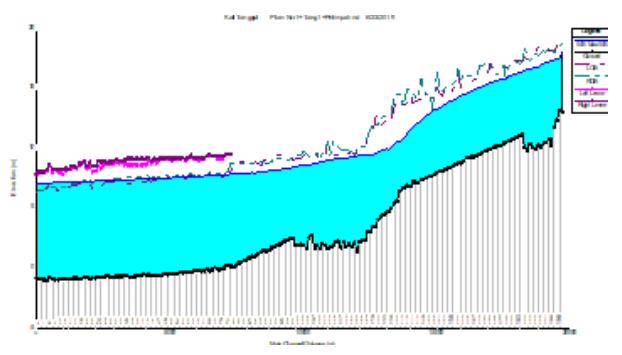
Figure 15. Longitudinal cross section of river normalization, side overflow construction, and embankment elevation
4.3 Reliability index analysis
1. Load and resistance parameters
Based on the analysis results, the load parameter had an average discharge (μ) of 322,28 m3 /s, a coefficient of variation (Ω) of 0,3 and a standard deviation (σ) of 97,45. The resistance parameter on the existing river had an average discharge (μ) of 375,7 m3 /s, a coefficient of variation (Ω) of 0,39 and a standard deviation (σ) of 144,74. The resistance parameter on
Figure 16. Flood inundation of river normalization, side overflow construction and embankment elevation the river normalization had an average discharge (μ) of 548,83 m3 /s, a coefficient of variation (Ω) of 0,22 and a standard deviation (σ) of 121,44. The resistance parameter on the river normalization and embankment elevation had an average discharge (μ) of 745,07 m3 /s, a coefficient of variation (Ω) of 0,27 and a standard deviation (σ) of 201,67. The resistance parameter on the side overflow construction had an average discharge (μ) of 149,83 m3 /s, a coefficient of variation (Ω) of 1,01 and and a standard deviation (σ) of 345,07.
2. Existing condition
The analysis results showed that the river capacity was unable to flow the Q25 year design flood discharge safely with a reliability rate (Pɣ) of 62.02% and failure rate (Pf) of 37.98%, where the positions of the dotted line (load) and solid line (resistance) were almost united or sliced from the two curves (Figure 17).
Existing Load and Resistance Function Graph
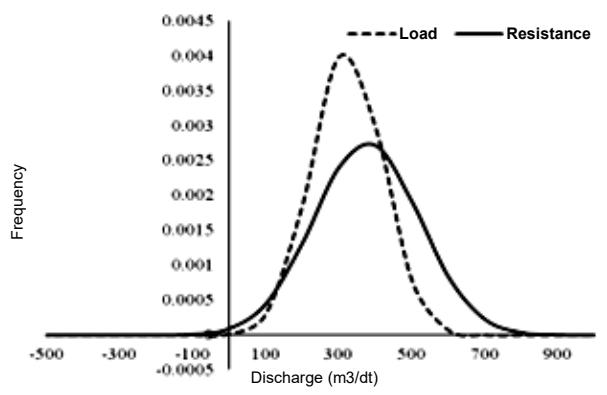
Figure 17. Load and resistance function graph of the existing river
3. River normalization
The analysis results showed that flood handling with river normalization was unable to flow the Q25-year design flood discharge safely with a reliability rate (Pɣ) of 89.89% and a failure rate (Pf) of 10.11%, where the positions of the dotted line (load) and solid line (resistance) united, although there was a movement away between the load and the resistance curve (Figure 18).
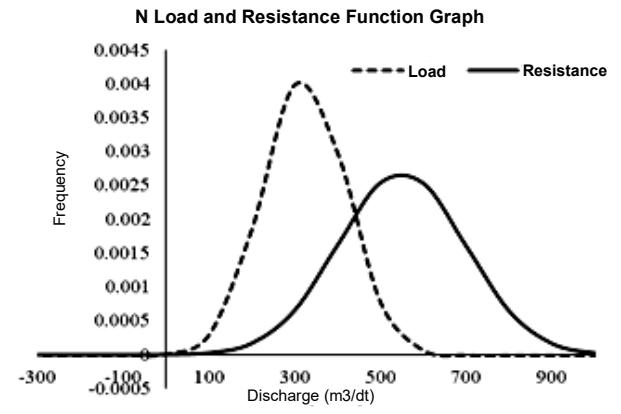
Figure 18. Load and resistance function graph of the river normalization
4. Side overflow construction
The analysis results showed that flood handling with side overflow construction was unable to safely flow the Q25 year design flood discharge with a reliability rate (Pɣ) of 80.65% and a failure rate (Pf) of 19.35%, where positions of the dotted line (load) and solid line (resistance) united, although there was a movement away between the load and the resistance curve (Figure 19).
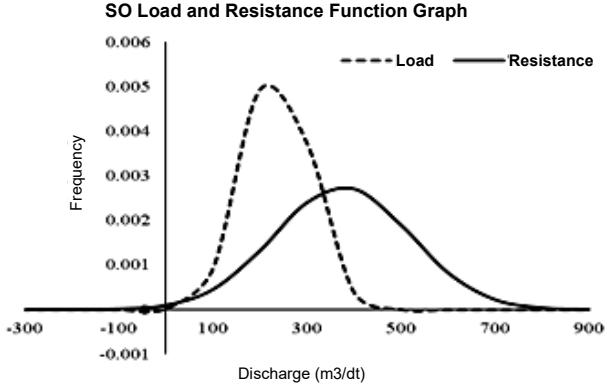
Figure 19. Load and resistance of the side overflow construction function graph
5. River normalization and embankment elevation
The analysis results showed that flood handling by river normalization and embankment elevation could flow the Q25 year design flood discharge with a reliability rate (Pɣ) of 97.05% and a failure rate (Pf) of 2.95%, but a combination of these activities was unable to completely overcome the flood runoff that occurred. On the graph, it can be seen that the curve of the dotted line (load) and solid line (resistance) is getting farther away even though there are still slices (failure rate) of the two curves (Figure 20).
6. River normalization and side overflow construction
The analysis results showed that flood management with river normalization and embankment elevation could flow the Q25 year design flood discharge with a reliability rate (Pɣ) of 98.68% and a failure rate (Pf) of 1.32%, a combination of these activities would increase the reliability rate, although it was still unable to completely overcome the runoff that occurred. On the graph, it can be seen that the curve of the dotted line
(load) and solid line (resistance) is getting farther away with the slice (failure rate) that is getting smaller (Figure 21).
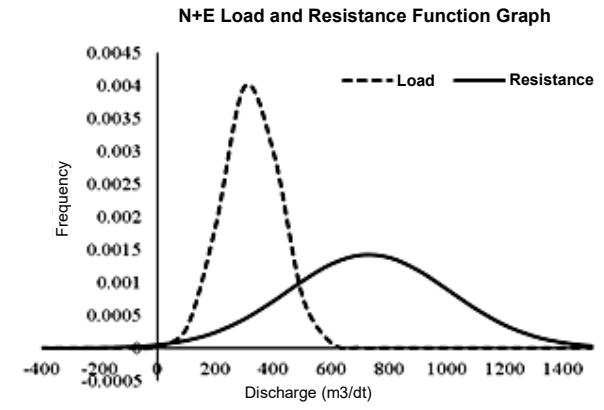
Figure 20. Load and resistance of the river normalization and embankment elevation function graph
N+SO Load and Resistance Function Graph
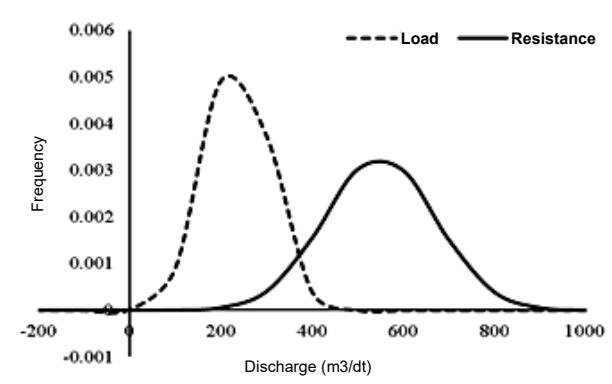
Figure 21. Load and resistance of the river normalization and side overflow construction function graph
7. River normalization, side overflow construction, and embankment elevation
The analysis results showed that flood handling with river normalization, side overflow construction and embankment elevation could deliver the safest Q25 year design flood discharge with the highest reliability rate (Pɣ) of 99.13% and the lowest failure rate (Pf) of 0.87%. On the graph, we can see the position of the dotted line (load) and the solid line (resistance) curves moving away and almost separating with the slice (failure rate) that is getting smaller (Figure 22).
4.4 Flood inundation analysis
In this study, an analysis of flood inundation was carried out in the existing conditions and conditions after flood handling with several scenarios. Flood inundation analysis was carried out with the help of the QGIS software and infrastructure data available on the Open Street Map (OSM).
The analysis results were data on flood inundation reduction on the area of agricultural lands, residential lands, roads, and other infrastructure. Table IV.1
N+E+SO Load and Resistance Function Graph
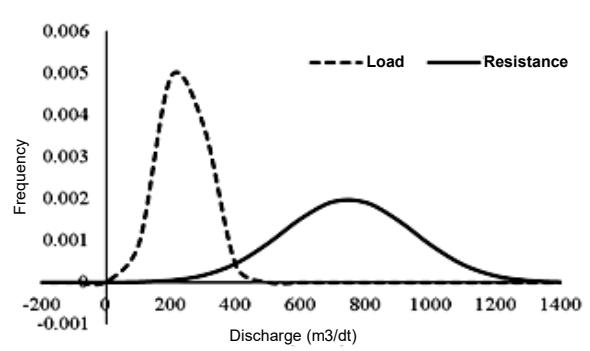
Figure 22. Load and resistance of the river normalization, side overflow construction, and embankment elevation function graph
presents the results of inundation analysis in a recapitulation of flood inundation reduction.
Based on Table IV.1, we can see the effect of each flood handling scenario on reducing inundation and its impact on the area of agricultural land and other infrastructure. Handling scenarios with river normalization, side overflow construction and embankment elevation could reduce flood inundation completely compared to the other handling scenarios.
4.5 Economic feasibility analysis
In this study, the economic feasibility analysis was carried out using the Benefit/Cost (B/C) Ratio. This method compares the construction cost plus the operating and maintenance cost based on a certain time with the benefits of flood handling. The benefit value was obtained from the decrease in the area of rice fields, residential lands, and other infrastructure not affected by flooding as well as annual gain from harvests. In the previous RAB calculation, the value of wages and materials used in this analysis refers to the price from the Government of the Province of East Java in 2016. For this reason, this value will be used as a Future Value (FV) by considering the inflation value of 5.01%, bank interest rates of 6.7% and the planned work year in 2020.
Based on the analysis results, the B/C Ratio value was generally above 1. The lowest B/C ratio value of 0.87 was the flood handling scenario of river normalization and side overflow construction, while the highest B/C
Ratio value of 1.70 was the flood handling by river normalization and embankment elevation. The flood reduction rate was increasing from the first scenario to the last scenario, where the lowest flood reduction rate of 29.58% was from the river normalization. Meanwhile, the highest flood reduction rate of 100% was from the river normalization, side overflow construction, and embankment elevation scenario.
The lowesy reliability rate with an SF value of 0,78, P of and Pf of 19,35% was from the side overflow construction. Meanwhile, the highest reliability rate with an SF value of 1,45, P of and Pf of 0,87 % was from the river normalization, side overflow construction, and embankment elevation activities. The reliability rate in this study was the current reliability rate with river dimensions according to the existing river conditions and flood handling scenarios. The reliability rate can change with time according to changes in river dimensions caused by sedimentation, erosion and other natural influences.
In this study, the main consideration in recommending flood handling activities in the Tanggul River was the economic aspect supported by other technical aspects, so based on Table IV.2, the river normalization and embankment elevation activities were chosen with a B/ C ratio of 1.70, flood reduction value of 60.26%, SF value of 1.07, reliability rate of 97.05% and failure rate of 2.95%. The following is a recapitulation of flood reduction, reliability rate, and B/C ratio.
5. Conclusions and Recommendations
5.1 Conclusions
- 1. The existing Tanggul River capacity was unable to accommodate flood discharge with the full bank capacity on the 5-year return period (Q5) flood discharge.
- 2. Tanggul River flood handling was carried out structurally and resulted in 29.58% of flood reduction for river normalization, 48.48% for side overflow
- 3. The reliability index analysis showed that for the river normalization, the SF method result was 0.78 and the FOSM method result was 89.89%. For the side overflow construction, the SF method result
Table 1. Recapitulation of inundation reduction based on flood handling scenarios
| No. | Scenario | Rice field (Ha) | District Road (Km) | Environmental Road(Km) | House (m²) | Warehouse (unit) | Bridge (unit) | ||||||
|---|---|---|---|---|---|---|---|---|---|---|---|---|---|
| Before | After | Before | After | Before | After | Before | After | Before | After | Before | After | ||
| 1 | N | 1,243.7 | 367.9 | 5,8 | 1.7 | 29,5 | 8.7 | 126.312 | 16 | 5 | 3 | 3 | 1 |
| 2 | SO | 1,243.7 | 602.9 | 5,8 | 2.8 | 29,5 | 14.3 | 126.312 | 16 | 8 | 3 | 3 | 1 |
| 3 | N + E | 1,243.7 | 782.0 | 5,8 | 3.7 | 29,5 | 18.6 | 126.312 | 16 | 10 | 3 | 3 | 2 |
| 4 | N + SO | 1,243.7 | 927.7 | 5,8 | 4.3 | 29,5 | 22.0 | 126.312 | 16 | 12 | 3 | 3 | 2 |
| 5 | N + SO + E | 1,243.7 | 1,243.7 | 5,8 | 5.8 | 29,5 | 29.5 | 126.312 | 16 | 16 | 3 | 3 | 3 |
Statement: N = Normalization, SO = Side Overflow, E = Embankment
Table 2. Recapitulation of flood reduction, reliability rate, and B/C ratio
| No. | Ctivity Plan | Flood Reduction | Reliability Level | B/C Ratio | |
|---|---|---|---|---|---|
| SF | PY | ||||
| 1 | Normalization | 29.58% | 0.78 | 89.89% | 1.30 |
| 2 | Side Overflow | 48.48% | 0.48 | 80.65% | 1.21 |
| 3 | Normalization and embankment | 62.88% | 1.07 | 97.05% | 1.70 |
| 4 | Normalization and side overflow | 74.59% | 1.23 | 98.68% | 0.87 |
| 5 | Normalization, overflow and embankment | 100.00% | 1.45 | 99.13% | 1.04 |
was 0.48 and the FOSM method result was 80.65%. For the river normalization and embankment elevation, the SF method result was 1,07 and the FOSM method result was 97.05%. For the river normalization and side overflow construction, the SF method result was 1.23 and the FOSM method result was 98.68%. And for the river normalization, side overflow construction, and embankment elevation, the SF method result was 1.45 and the realibility was 99.13%.
- 4. The economic feasibility analysis results showed that the B/C Ratio for river normalization was 1.3, the B/ C Ratio for side overflow construction was 1.21, the B/C Ratio for river normalization and embankment elevation was 1.7, the B/C Ratio for river normalization and side overflow construction was 0.87, and B/C Ratio for river normalization, side overflow construction, and embankment elevation was 1.04.
- 5. Flood handling recommendations in the Tanggul River based on economic feasibility considerations were river normalization and embankment elevation with a B/C ratio of 1.7, flood inundation reduction by 62.88%, an SF value of 1.07, and a FOSM of 97.05%.
5.2 Recommendations
- 1. The design of this flood handling plan needs further detailed study because it is still a basic design.
- 2. The use of DEM data in this study has a resolution level of 8.1 m. For a more detailed result, a higher resolution can be used.
- 3. For further studies, an Early Warning System analysis can be conducted at the study site in Tanggul River.