
4. Analysis of Bridge Structure Performance Due to Standard Loads
The bridge structure performance against the standard load is assessed based on the deflection of the bridge floor, the stress on the girder, the stress on the cable, and the pylon capacity. Differences in bridge performance parameters during design and evaluation time are shown in Table 3.
Table 2. Performance level of the bridge structure
| Level | Description | Steel Strain | Concrete Strain | % Drift | Displacement Ductility |
|---|---|---|---|---|---|
| I | Fully operational | <0.005 | <0.0032 | <1.0 | <1.0 |
| II | Operational | 0.005 | 0.0032 | 1.0 | 1.0 |
| Ш | Life safety | 0.019 | 0.01 | 3.0 | 2.0 |
| IV | Near collapse | 0.048 | 0.027 | 5.0 | 6.0 |
| v | Collapse | 0.063 | 0.036 | 8.7 | 8.0 |
According to Table 3, the evaluation of allowable deflection is L/250 for service loads and L/800 for vehicle loads. From the analysis results, the deflection value for service load and vehicle load was still below the allowable deflection as shown in Table 4.
The allowable stress requirement on the bridge girders uses the SNI 2847: 2013 Structural concrete requirements for buildings. The allowable compressive stress is 0.45fc = 18.67 MPa and the allowable tensile stress is 0.62fc = 4.011 MPa. The results of the stress analysis on the girder can be seen in Table 5. The girder stress due to service load was still below the allowable stress except for the Ic Load where there was an overstress of 112% (4.49 MPa).
The maximum allowable cable stress was taken from Cable-stayed Bridge Technical Planning Guidelines No. 08 of 2015. The allowable stress is 0.45fpu = 0.45x1860 = 837 MPa for the service load and 0.6fpu = 0.6x1860 = 1116 MPa for the ultimate load. From the results of the analysis, it was found that most of the stress that occurred was still below the allowable voltage, except for several combinations that exceeded the allowable stress on cable 7 (see Table 6).
Pylon was analyzed based on its capacity from the interaction diagram. The results of the analysis show that the pylon structure is still capable of carrying ultimate loads and service loads except for the lower pylon. In the lower pylon, the force caused by the combination due to earthquake load (Extreme I) cannot be borne by the pylon. To verify this, an additional analysis was conducted using the SpColumn program (see Table 7).
From the SpColumn results, there was a value of \(\Phi\)Mn/ Mu smaller than one, which was the load combination of Extreme Ix and Extreme Iy, which was a
Table 3. Bridge performance parameters
| Parameters | Design Cı | riteria | Evaluation C | riteria |
|---|---|---|---|---|
| Deflection | RSNI T-12-2004 Planning of Concrete | L/250 & L/800 | 08_SE_M_2015 Cable-stayed Bridge Technical Planning Guidelines | L/400 & L/800 |
| Girder Stress | Structures for Bridges Planning of Concrete Structures for Bridges | SNI 2847:2013 | ||
| Compressive | 0,45fc' | Compressive | 0,45fc' | |
| Tensile | 0,5√fc' | Tensile | 0,62√fc' | |
| Pylon Capacity | SNI 2847:2002 | Reduction 0,7 - 0,8 | SNI 2847:2013 | Reduction 0,7 - 0,9 |
| Cable Force | RSNI T-12-2004 Planning of Concrete Structures for Bridges | Cable-stayed Bridge Technical Planning Guidelines (2015) | ||
| Service Load | 0,45fpu | Service Load | 0,45fpu | |
| Ultimate Load | 0,6fpu |
Tabel 4. Deflection due to standard load SNI 1725:2016
| Loading | Deflection F | Requirements | Deflection from Csi Bridge | |||
|---|---|---|---|---|---|---|
| Combination | Requirements | Value (mm) | Max (mm) | Min (mm) | Desc. | |
| Service 1a | L/250 | 480,00 | 2,33 | -32,97 | OK | |
| Service 1b | L/250 | 480,00 | 190,05 | -151,64 | OK | |
| Service 1c | L/250 | 480,00 | 184,19 | -150,14 | OK | |
| Service 2 | L/250 | 480,00 | -0,67 | -66,41 | OK | |
| Service 3 | L/250 | 480,00 | 7,58 | -15,10 | OK | |
| Service 4 | L/250 | 480,00 | 86,63 | -5,65 | OK | |
| Vehicle Load | L/800 | 150,00 | -1,94 | -29,46 | OK | |
combination of earthquake load. The lower pylon structure can be concluded as not being able to bear the load of an earthquake.
5. Performance Based Analysis
5.1 Nonlinear static pushover analysis
The pushover analysis is a static procedure in which a lateral load pattern is applied to a structure and the load is gradually increased until the displacement of the structure reaches its limit state. Prior to pushover the structure will be loaded by the bridge's fixed load in the form of dead load and additional dead load, plus a traffic load of 50%. Figure 5 shows the capacity curves with three load distribution patterns used, which are the uniform distribution load, static equivalent distribution, and modal analysis distribution.
Using the Csi Bridge program, an analysis with the Capacity Spectrum Method was used to determine the bridge performance. The performance point was obtained
Tabel 5. Stress on girder beam due to service SNI 1725:2016
| Loading | Girder | Top Fib | er Stress | Bottom Fiber Stress | ||
|---|---|---|---|---|---|---|
| Combination | Position | Max | Min | Max | Min | |
| Service Ia 2016 | Left Girder | -2,159 | -11,303 | -2,436 | -13,988 | |
| Service la 2016 | Right Girder | -2,160 | -10,938 | -2,796 | -13,759 | |
| Service Ib 2016 | Left Girder | -1,080 | -11,999 | 3,573 | -16,712 | |
| Right Girder | -1,198 | -11,628 | 3,414 | -16,937 | ||
| Service Ic 2016 | Left Girder | -1,173 | -11,973 | 4,491 | -16,998 | |
| Service ic 2016 | Right Girder | -1,131 | -11,626 | 4,156 | -17,107 | |
| Service II 2016 | Left Girder | -1,530 | -11,013 | -2,532 | -15,688 | |
| Service II 2010 | Right Girder | -1,449 | -11,019 | -2,608 | -15,796 | |
| Service III 2016 | Left Girder | -2,565 | -11,122 | -2,007 | -12,930 | |
| Service III 2016 | Right Girder | -2,482 | -11,116 | -2,203 | -13,027 | |
| Service IV 2016 | Left Girder | -3,462 | -11,094 | 1,789 | -13,585 | |
| Scivice IV 2010 | Right Girder | -3,439 | -10,911 | 1,454 | -13,672 | |
by finding a meeting point between the capacity curve and the demand curve in the form of ADRS. The results of the analysis in determining the performance point of the bridge structure can be seen in Figure 6.
Bridge element performance was also required, which was obtained from the moment-curvature value that occurred on the bridge element. In this study, the element performance evaluation was focused on the structure of the lower segment pylon because it was the most critical element. Figure 7 shows the performance point achieved by the lower segment pylon.
From the two results of performance analysis, it can be concluded that from the pushover analysis with the three load patterns used, the structure and elements of the bridge were still safe. The performance level of the
Table 6 Overstress on cable no 7
| Cable No. | Load Combination | LNS | SNS | LSS | SSS | ||||
|---|---|---|---|---|---|---|---|---|---|
| Cable Stress | %fpu | Cable Stress | %fpu | Cable Stress | %fpu | Cable Stress | %fpu | ||
| Strength la | 1162,029 | 104,1% | 1145,796 | 102,7% | 1184,858 | 106,2% | 1150,530 | 103,1% | |
| Strength lb | 1003,511 | 89,9% | 987,189 | 88,5% | 1156,338 | 103,6% | 1122,031 | 100,5% | |
| S7 (2016 | Strength Ic | 1137,074 | 101,9% | 1121,003 | 100,4% | 1030,421 | 92,3% | 996,086 | 89,3% |
| Load) | Strength II | 1111,612 | 99,6% | 1095,409 | 98,2% | 1134,584 | 101,7% | 1100,253 | 98,6% |
| Extreme Ixa Max | 1105,227 | 99,0% | 1088,305 | 97,5% | 1128,816 | 101,1% | 1094,970 | 98,1% | |
| Service II | 841,298 | 100,5% | 828,878 | 99,0% | 859,191 | 102,7% | 832,785 | 99,5% | |
Table 7. SpColumn analysis results for lower segment pylon
| No. | Loading | Pu | Mux | Muy | ФМпх | ΦMny | ΦMn/ |
|---|---|---|---|---|---|---|---|
| INO. | Combination | kN | kNm | kNm | kNm | kNm | Mu |
| 1 | Strength Ia | 85.529,30 | 35,80 | 11.261,70 | 867,38 | 272.853,47 | 24,23 |
| 4 | Strength la | 82.568,50 | - 7,00 | 10.470,00 | - 180,37 | 269.790,53 | 25,77 |
| 5 | Strength Ia | 81.008,30 | - 228,90 | 93.543,50 | - 655,98 | 268.067,97 | 2,87 |
| 6 | Strength Ia | 72.205,60 | - 157,10 | 7.699,00 | - 5.259,54 | 257.752,00 | 33,48 |
| 7 | Strength la | 74.824,70 | - 45,60 | 37.034,40 | - 321,77 | 261.285,03 | 7,06 |
| 8 | Extreme Ix Max | 67.751,30 | 345.232,41 | 94.920,70 | 220.467,38 | 60.616,91 | 0,64 |
| 9 | Extreme Ix Min | 82.650,00 | -345.363,91 | - 73.350,10 | -238.549,27 | - 50.664,28 | 0,69 |
| 10 | Extreme Iy Max | 50.937,50 | 125.230,80 | 286.493,69 | 91.097,49 | 208.406,08 | 0,73 |
| 11 | Extreme Iy Min | 99.464,00 | -125.362,00 | -264.923,00 | -113.853,10 | -240.601,73 | 0,91 |
| 12 | Service Ia | 62.700,00 | 173,80 | 28.471,20 | 1.507,86 | 247.012,94 | 8,68 |
| 13 | Service Ib | 59.716,20 | 26.112,80 | 27.791,20 | 157.979,41 | 168.133,56 | 6,05 |
| 14 | Service Ic | 59.780,30 | - 25.699,60 | 27.620,60 | -157.237,45 | 168.990,64 | 6,12 |
| 15 | Service II | 62.882,50 | 73,40 | 6.008,50 | 3.018,04 | 247.057,55 | 41,12 |
| 16 | Service III | 59.229,20 | 35,70 | 4.871,70 | 1.778,98 | 242.764,78 | 49,83 |
| 17 | Service IV | 57.661,10 | - 101,80 | 46.357,70 | - 529,16 | 240.965,97 | 5,20 |
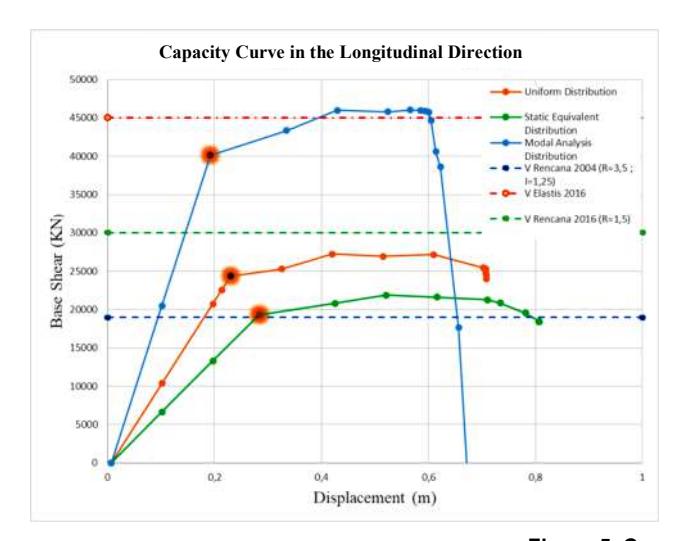
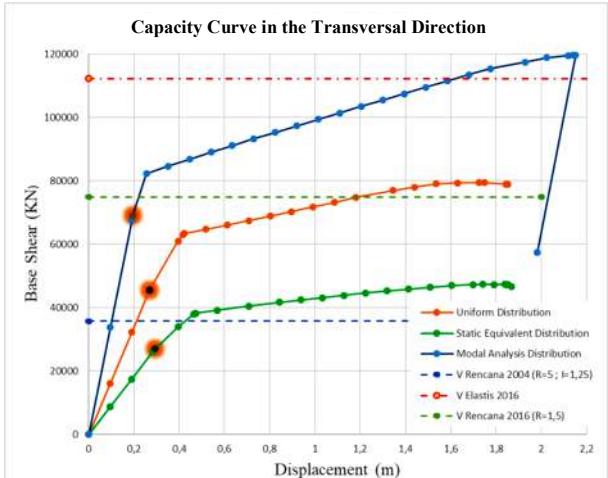
Figure 5. Capacity curves
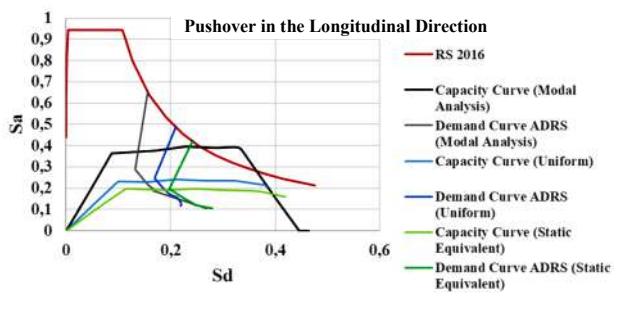
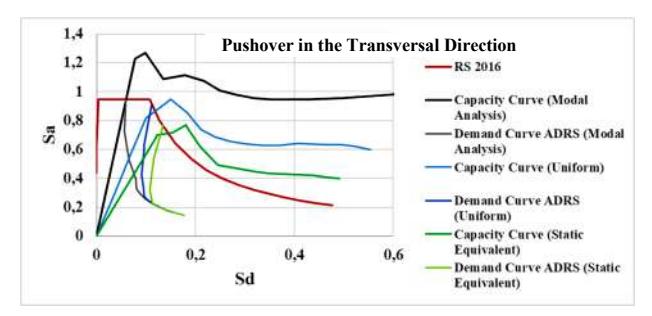
Figure 6. Pushover curves
bridge was at the fully operational level and the performance level of the bridge element was at the immediate occupancy level. Analysis of the girder stress and cable stress shows that overstress occurred on the bottom side of the bridge girder of 148% to 400% of the allowable stress, while the cable stress was far from the cable yield stress.
5.2 Nonlinear time history analysis
The Nonlinear Time History Analysis used the ground motion taken from the PEER Ground Motion Database. The stages in this analysis were the selection of ground motion and spectral matching, structural analysis using the Csi Bridge program and determination of bridge performance level. The choice
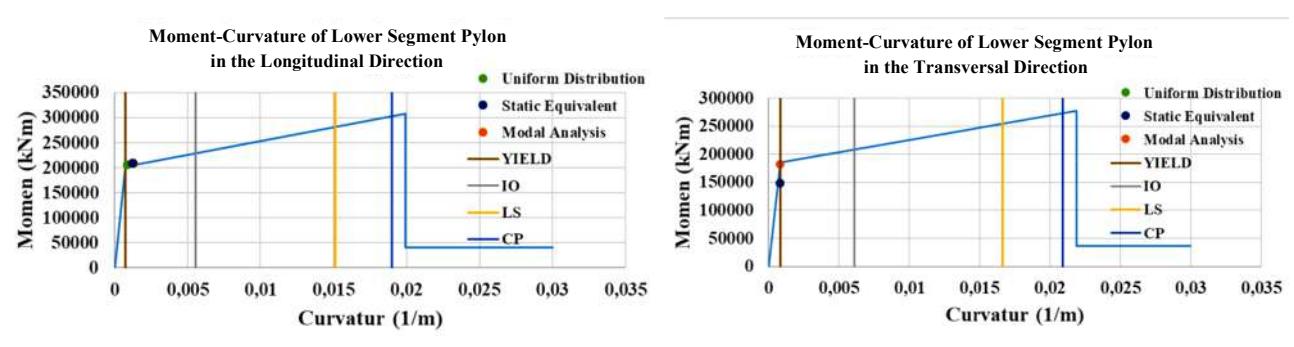
Figure 7. Lower segment pylon element performance due to NSPA
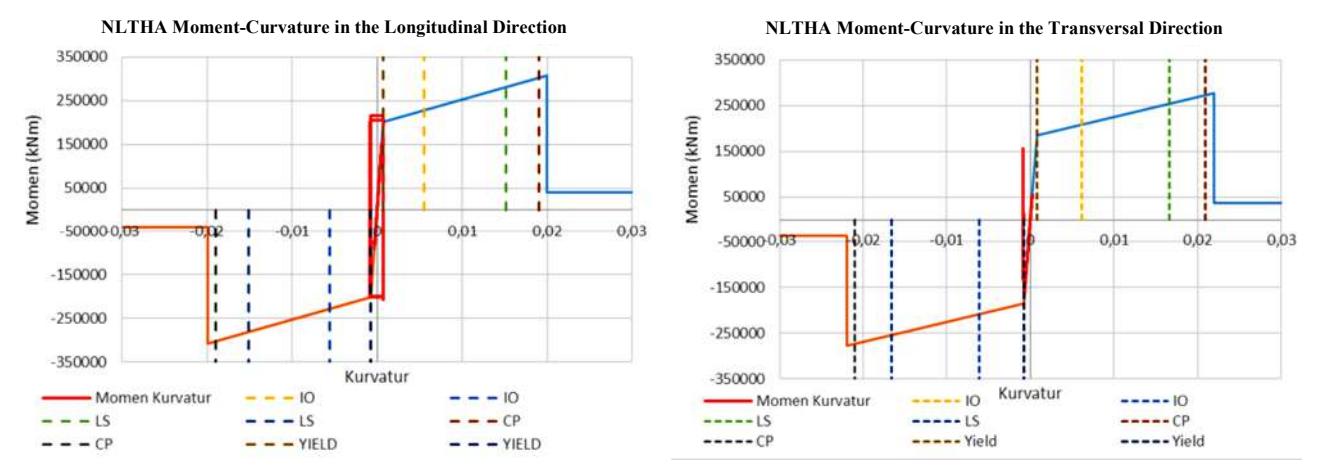
Figure 8. Lower segment pylon element performance due to NLTHA
of the earthquake was based on parameters from the Ground Motion Evaluation Procedure for Performance-Based Design, ie the magnitude of the earthquake is in the range of \(\pm\) 0.25 target magnitude, the distance to the source of the earthquake fault must be appropriate, and the ground condition must also be appropriate. These parameters were searched by using the earthquake data that occurred around Manado. The data was obtained from BMKG Online. From the data, it is known that the maximum earthquake magnitude that occurred was 6.1 and the maximum closest distance to the earthquake fault was 9.15 km. The ground condition data was obtained from the picture of the plan where the ground condition was in the form of medium ground with shear wave velocity between 175 m/s to 350 m/s. Therefore, four ground motions were selected according to Table 8.
On those ground motions, spectral matching was then carried out in the range of 0.2T to 1.5T. The ground motion input was carried out in the x, y and z directions. The parameters used in the Csi Bridge program were as follows:
Damping used was the proportional damping of 5% with a coefficient calculated by Csi Bridge.
Table 8. Selected ground motions
| Record Sequence Number | Earthquake Name | Year | Magnitude | Distance to Fault | V30 (m/s) |
|---|---|---|---|---|---|
| 232 | Mammoth Lakes-01 | 1980 | 6,06 | 4,67 | 346,82 |
| 461 | Morgan Hill | 1984 | 6,19 | 3,48 | 281,61 |
| 4146 | Parkfield-02 CA | 2004 | 6,00 | 9,14 | 341,70 |
| 8118 | Christchurch New Zealand | 2011 | 6,20 | 9,06 | 263,20 |
Time integration used was the Newark method with a value of Gamma = 0.5; Beta = 0.25.
The results of the analysis can be seen in Table 9, then the envelope value was selected to determine the structure performance level. The direction of displacement and base shear were reviewed only in the x (longitudinal) and y (transversal) directions. The performance of the elements represented by the lower segment pylon elements is shown through the momentcurvature included in Figure 8.
It can be concluded that from Nonlinear Time History Analysis with four ground motions that were used, both the structure and elements of the bridge were still in a safe condition. The performance level of the bridge was at the fully operational level and the performance level of the bridge element was at the immediate occupancy level. Analysis of the girder stress and cable stress shows that overstress occurred on the bottom side of the bridge girder of 110% to 240% of the allowable stress, while the cable stress was far from the yield stress.
5.3 Discussion on the results of NSPA and NLTHA
Based on the results of the nonlinear static pushover analysis and nonlinear time history analysis, the bridge performance was at the fully operational level with the immediate occupancy element performance level. Despite having the same level of performance, the value of the base shear and displacement that occurred
Table 9. Nonlinear time history analysis results
| Record Sequence | Earthquake Name | Max/Min | Base Sh | ear (kN) | Displacement (m) | ||
|---|---|---|---|---|---|---|---|
| Number | X Direction | Y Direction | X Direction | Y Direction | |||
| 232 | Mammoth Lakes-01 | Max | 62.235,9 | 90.712,2 | 0,164 | 0,215 | |
| Min | - 53.771,3 | - 57.566,5 | -0,140 | -0,226 | |||
| 461 | Morgan Hill | Max | 49.531,0 | 84.214,8 | 0,153 | 0,195 | |
| Min | - 55.238,7 | - 65.649,9 | -0,174 | -0,230 | |||
| 4146 | Parkfield-02_CA | Max | 38.617,3 | 88.021,3 | 0,164 | 0,203 | |
| Min | - 58.741,1 | - 71.304,0 | -0,185 | -0,208 | |||
| 8118 | Christchurch_New Zealand | Max | 54.830,8 | 76.504,6 | 0,183 | 0,229 | |
| Min | - 61.081,1 | - 67.805,6 | -0,130 | -0,231 | |||
were different. These differences can be seen in Table 10.
From the results in Table 10, it can be concluded that the pattern of load distribution used would determine or influence the results of the analysis. Of the 3 load patterns used in nonlinear static pushover analysis, the value of the base shear approaching the results of nonlinear time history analysis was the modal analysis distribution, while the displacement value obtained was still quite large.
6. Conclusions and Recommendations
- With a standard load, there were several bridge elements that exceeded the allowable stress. The girder has an overstress of 12% and cable 7 has an overstress of 6.2%. The capacity of the lower segment pylon has also been exceeded by 128%.
- The results of the NSPA and NLTHA analysis show that the bridge category was still in the safe category, which was fully operational with the immediate occupancy element performance. Cable stress when the performance point was reached was still far from the yield stress, while the bridge girder has overstressed at the bottom by 110% to 400% of the allowable stress.
- From point a and point b above, it is recommended that any special bridges built before SNI 1725: 2016 and SNI 2833: 2016 apply to be re-analyzed using these regulations. This is to anticipate the possibility of the bridges needing additional strengthening as the impact of the increased loads.
- On special bridges, especially cable-stayed bridges, the results of nonlinear time history analysis are still better than nonlinear static pushover analysis. Further study is required to determine the ideal pushover load distribution for cable-stayed bridges, considering that the load distribution pattern is crucial in determining the result of pushover analysis.
7. References
Aviram, Ady., Mackie, Kevin R., Stojadinović, Božidar., 2008, Guidelines for Nonlinear
Table 10. Base shear and displacement values
| Lateral Load Patterns | Direction | Base Shear (kN) | Displacement (m) | Desc. |
|---|---|---|---|---|
| Desain | Longitudinal | 36537,57 | - | |
| Desain | Transversal | 91022,90 | - | |
| NSPA Uniform | Longitudinal | 25956,78 | 0,357 | |
| Distribution | Transversal | 48686,14 | 0,295 | |
| NSPA Static | Longitudinal | 20935,69 | 0,437 | |
| Equivalent Distribution | Transversal | 28656,65 | 0,319 | |
| NSPA Modal Analysis | Longitudinal | 42212,05 | 0,283 | |
| Distribution | Transversal | 52405,67 | 0,148 | |
| 62235,91 | 0,185 | Max | ||
| NT TILL | Longitudinal | 38617,34 | 0,130 | Min |
| NLTHA | 90712,24 | 0,301 | Max | |
| Transversal | 57566,48 | 0,203 | Min |
Analysis of Bridge Structures in California, Pacific Earthquake Engineering Research Center, California.
Badan Standarisasi Nasional, 2005, RSNI T-02-2005 Standar Pembebanan Untuk Jembatan, Indonesia.
Badan Standarisasi Nasional, 2013, SNI 2847-2013 Persyaratan Beton Struktural Untuk Bangunan Gedung, Indonesia.
Badan Standarisasi Nasional, 2016, SNI 1725-2016 Pembebanan Untuk Jembatan, Indonesia.
Badan Standarisasi Nasional, 2016, SNI 2833-2016 Perencanaan Jembatan Terhadap Beban Gempa, Indonesia.
Departemen Pemukiman dan Prasarana Wilayah, 2004, Pd T-04-2004-B Pedoman Perencanaan Beban Gempa Untuk Jembatan, Indonesia.
Fajfar, Peter., 1999, Capacity Spectrum Method Based On Inelastic Demand Spectra, Earthquake Engineering And Structural Dynamics, 28, 979-993.
Federal Emergency Management Agency, 2000, Prestandards and commentary for Seismic rehabilitation of Building (FEMA-356), Washington.
6LQDWUDGNN
- .DONDQ (URO 'DQ &KRSUD $QLO . 3UDFWLFDO *XLGHOLQHV WR 6HOHFW DQG 6FDOH (DUWKTXDNH 5HFRUGVIRU1RQOLQHDU5HVSRQVH+LVWRU\$QDO\VLV RI6WUXFWXUHV8QLWHG6WDWHV*HRORJLFDO6XUYH\
- .HPHQWHULDQ 3HNHUMDDQ 8PXP GDQ 3HUXPDKDQ 5DN\DW 6( 1R 6(0 7HQWDQJ 3HUHQFDQDDQ 7HNQLV -HPEDWDQ %HUXML .DEHO ,QGRQHVLD
- .HPHQWHULDQ 3HNHUMDDQ 8PXP /DSRUDQ )LQDO ,QGHSHQGHQW3URRI&KHFN-HPEDWDQ&DEOH6WD\HG 'U ,U 6RHNDUQR 37 0DUDWDPD &LSWD 0DQGLUL %DQGXQJ
- 1DWLRQDO&RRSHUDWLYH+LJKZD\5HVHDUFK3URJUDP 3HUIRUPDQFH %DVHG 6HLVPLF %ULGJH 'HVLJQ 7UDQVSRUWDWLRQ5HVHDUFK%RDUG:DVKLQJWRQ
- 6LQDWUD)UDQV(YDOXDVL.LQHUMD-HPEDWDQ.KXVXV (NVLVWLQJ GL ,QGRQHVLD %HUGDVDUNDQ 61, GDQ 61, 6WXGL .DVXV -HPEDWDQ '5 ,U 6RHNDUQR ,QVWLWXW 7HNQRORJL %DQGXQJ%DQGXQJ
- 6WHZDUW-RQDWKDQ3&KLRX6K\K--HQJ%UD\-RQDWKDQ ' GNN *URXQG 0RWLRQ (YDOXDWLRQ 3URFHGXUHV IRU 3HUIRUPDQFH-%DVHG 'HVLJQ 3DFLILF(DUWKTXDNH(QJLQHHULQJ5HVHDUFK&HQWHU &DOLIRUQLD
Performance Evaluation of Existing Special...