
Abstrak
Runway merupakan area pada bandar udara untuk tempat mendarat dan lepas landas bagi pesawat. Fasilitas fasilitas sisi udara dan sisi darat harus diperhatikan pemeliharaannya agar dapat memaksimalkan kinerja bandar udara. Berdasarkan rencana pelayanan tipe pesawat Bandar Udara Sultan Aji Muhammad Sulaiman Sepinggan Balikpapan dan untuk memaksimalkan kinerja bandar udara pada masa sekarang maupun pada masa yang akan datang, maka dilakukan penilaian kondisi perkerasaan runway dengan parameter nilai Pavement Condition Index (PCI) pada perkerasan lentur untuk mendapatkan kebutuhan perbaikan atau pemeliharaan yang optimal. Nilai PCI yang diperoleh pada tahun 2019 adalah sebesar 61 (fair). Berdasarkan nilai PCI pada runway tersebut dilakukan evaluasi dengan COMFAA dan FAARFIELD untuk mendapatkan nilai PCN pesawat terkritis pada tahun 2019. Pada segmen 1 yang diasumsikan setengah dari panjang runway yaitu sta 0+000 sampai 1+250 memiliki nilai PCN 34,3 dan segmen 2 diasumsikan dari sta 1+250 - 2+500 memiliki nilai PCN 33,2 dimana nilai ACN untuk pesawat kritis B777 – 300 ER adalah 89,3. Sesuai dengan rekomendasi FAA AC-5380-6C Skenario yang paling optimal adalah skenario 2 yaitu rehabilitasi mayor dengan jenis penanganan pengupasan dan pengisian perkerasan pada surface (inlay – scrape and fill) setiap 7 tahun sekali ketika nilai PCI sebesar 49 (poor) dan pada tahun – tahun berikutnya dilakukan pemeliharaan rutin dengan patching. Total biaya penanganan selama 20 tahun masa pemeliharaan dengan skenario 2 sebesar Rp. 195.377.000.000.
Kata Kunci: Pavement condition index, runway, PCN
*Correspondence Author
1. Introduction
Every airport is divided into landside and airside, where the landside consists of connecting road, parking lot and terminal building while the airside consists of the taxiway, holding pad, runway, space terminal, and flight paths in the sky. One important part that must be found at the airport is the runway. Runway is an area in the airport for proper landing and takeoff for aircrafts. The maintenance of the facilities on both the airside and landside must be taken care of in order to maximize the performance of the airport itself to meet the demand of movement both at present and in the future.
Referring to the aircraft type service plan by Balikpapan Sultan Aji Muhammad Sulaiman Sepinggan Airport and to maximize the airport performance to meet the current and future demand of movement, an assessment of the runway pavement condition at Balikpapan Sultan Aji Muhammad Sulaiman Sepinggan Airport with Pavement Condition Index (PCI) value parameter on flexible pavement to obtain repair or maintenance needs with several alternative scenarios was done. Next, the COMFAA software was used to determine the Aircraft Classification Number (ACN) value and Pavement Classification Number (PCN) value to assess the ability of the pavement structure on the runway to serve the load due to air traffic, so that appropriate and efficient maintenance can be planned, and the FAARFIELD software was used to plan the design of the pavement structure on Balikpapan Sultan Aji Muhammad Sulaiman Sepinggan Airport runway, so that the optimum solution was obtained for repair or maintenance of the Balikpapan Sultan Aji Muhammad Sulaiman Sepinggan Airport runway.
The general objective of this research was to evaluate the pavement structure on Balikpapan Sultan Aji Muhammad Sulaiman Sepinggan Airport runway for maintenance optimization which was carried out at Balikpapan Sultan Aji Muhammad Sulaiman Sepinggan Airport.
The specific objectives of this study were as follows:
- 1. To assess the pavement structure conditions at Balikpapan Sultan Aji Muhammad Sulaiman Sepinggan Airport runway using the Pavement Condition Index (PCI) method on flexible pavement.
- 2. To assess the ability of pavement structure and design of pavement thickness on Balikpapan Sultan Aji Muhammad Sulaiman Sepinggan Airport runway with COMFAA and FAARFIELD software.
- 3. To design an optimal maintenance method for 20 years from the plan's starting year (2019) to the plan's final year (2039) on the Balikpapan Sultan Aji Muhammad Sulaiman Sepinggan Airport runway.
2. Literature Review
2.1 Layering system on flexible pavements
In 2016, the FAA applied a flexible pavement thickness design method using the elastic layer theory. This theory considers the vertical and horizontal forces acting on the pavement structure. The deflection that occurs in the structure due to loading is a function of the material's elasticity, E (Young's modulus). The ratio of deflection in the transversal and vertical directions can be determined by the Poisson ratio, \(\mu\). In the FAARFIELD program, the elastic layer theory and CDF theory are used to determine the thickness of the pavement layers. FAA, through the advisory circular, has set a minimum thickness for each layer of pavement to be designed. The following are the minimum thickness for designing flexible pavement layers.
2.2 Pavement condition index (PCI) method
The PCI method aims to identify critical areas of pavement. Critical areas are followed up by identifying the causes of damage, such as pavement material, aircraft loads, wheel pressure, climate and others.
Pavement surface visual inspection is very useful because it can be used for (Broten and Sombre, 2001):
1. Evaluating pavement condition during inspection
Table 1. Minimum thickness of flexible pavement layers
| I T | FAA Layer | Aircraft Maximum Load Above Pavement lbs (kg) | |||||
|---|---|---|---|---|---|---|---|
| Layer Type | Requirements | <12.500 (5.670) | <100.000 (45.360) | ≥100.000 (45.360) | |||
| Surface Layer 1,2,3 | P-401 | 3 inches (75 mm) | 4 inches (100mm) | 4 inches (100mm) | |||
| Stabilized Base Layer | P-401/P-403, P-304, P-306 | Not necessary | Not necessary | 5 inches (125mm) | |||
| Crushed Stone Aggregate Base Layer 5,6 | P-209 | 3 inches (75 mm) | 6 inches (150mm) | 6 inches (150mm) | |||
| Base Layer 5,7,8 | P-208 | 3 inches (75 mm) | Not used 7 | Not used | |||
| Subbase Layer 5,8 | P-154 | 4 inches (100mm) | 4 inches (100mm) if necessary | 4 inches (100mm) if necessary | |||
(Source: FAA AC 150/5320-6F 2016)
- 2. Determining rehabilitation needs and pavement maintenance priority
- 3. Estimating maintenance quantity
- 4. Evaluating the performance of different ways for maintenance and rehabilitation
In the PCI method, the severity of pavement damage is a function of 3 main factors, namely the damage type, severity, and the amount or density of damage.
2.3 Indicators in the pavement condition index (PCI) method
a. Deduct Value, DV
Deduct value is obtained by adjusting the density value obtained into each damage graph in accordance with the severity of the damage. Deduct value is also distinguished by the severity of the damage for each damage type.
b. Density
Density is the percentage of the area or total length of one damage type to the area or total length of the measured road section, can be in ft<sup>2</sup> or m<sup>2</sup>, or in feet or meter. Thus, the damage density is expressed by the equation:
Density (%)
\[\frac{A_d}{A_s} \times 100 \tag{1}\]
Or
Density (%)
\[\frac{L_d}{A_s} \times 100 \tag{2}\]
Where:
A<sub>d</sub> = The total area of the pavement type for each severity level of damage (ft<sup>2</sup> or m<sup>2</sup>)
\(A_s\) = Total area of sample unit (ft<sup>2</sup> or m<sup>2</sup>)
\(L_d\) = The total length of the pavement type for each severity level of damage (ft or m)
c. Total Deduct Value, TDV
The total deduct value or TDV is the total amount of the deduct value for each sample unit.
d. Corrected Deduct Value, CDV
The corrected deduct value or CDV is obtained from the relationship curve between the total deduct value (TDV) and the deduct value (DV) by selecting the appropriate curve. If the CDV value obtained is smaller than the Highest Deduct Value (HDP) then the CDV used is the highest individual deduct value.
e. PCI Value
After obtaining CDV, PCI for each sample unit is calculated using the following equation:
\[PCI_{s} = 100 - CDV \tag{3}\]
Sample Unit
For pavements at airports, FAA (1982) suggested the distribution of sample units by considering aspects
related to pavement design, implementation history and airport traffic areas. FAA (1982) suggested the division of sample units as follows:
- For continuous concrete pavement, the maximum sample unit is 20 plates.
- For flexible pavement in airports, one sample unit is recommended to have an area of \(\pm 5000 \text{ ft}^2 \text{ (465 m}^2\text{)}\).
\[n = \frac{NS^2}{\frac{e^2}{4}(N-1)+s^2} \tag{4}\]
Where:
N = the total number of sample units in one pavement section
= allowable error in estimation of the PCI part
= standard deviation of PCI between sample units in their parts.
After obtaining the minimum number of sample units, a selection of sample units is made.
\[i = \frac{N}{n} \tag{5}\]
Where:
N = number of sample units available
minimum number of sample units to be surveyed
sampling interval
But as a rule of thumb, ASTM D5340-12 (2012) provides an alternative determination of the number of samples reviewed based on the total sample size. The number of samples to be reviewed based on this scenario is seen in the Table 2.
Table 2. Determination of the total number of sample units surveyed based on total sample units
| No | Given | Survey |
|---|---|---|
| 1 | 1 to 5 sample units | 1 sample unit |
| 2 | 6 to 10 sample units | 2 sample unit |
| 3 | 11 to 15 sample units | 3 sample unit |
| 4 | 16 to 40 sample units | 4 sample unit |
| 5 | Over 40 sample units | 10% |
(source: ASTM D5340-12 2012)
2.4 Damage type identification
Damage types in using the Pavement Condition Index (PCI) method for flexible pavement can be divided into several types of damage. Measurement of each type of damage is taken from each sample unit that has been selected at the pavement site that has been divided. Each severity level of damage consisting of the low, medium, and high must be measured. After that, it can be entered into the form provided. The types of damage are as follows:
a. Alligator Cracking
b. Bleeding
- c. Block Cracking
- d. Corrugation
- e. Depression
- f. Jet Blast Erosion
- g. Joint Reflection Cracking
- h. Long & Trans Cracking
- i. Oil Spilage
- j. Patching
- k. Polished Aggregate
- 1. Raveling
- m. Rutting
- n. Shoving
- o. Slippage Cracking
- p. Swelling
- q. Weathering
2.5 Handling type and damage condition
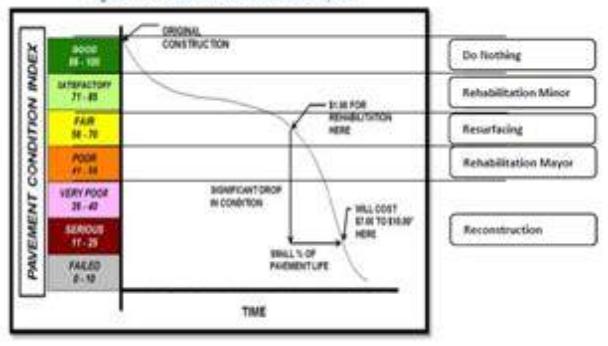
The following are the types of handling carried out based on the reduction of the PCI value.
Figure 1 explains how pavement usually undergoes settlement and rehabilitation costs relative to various maintenance times. PCI values that provide criteria for runway pavement conditions are as follows:
- a. PCI value of 86 100 is within the good category, which is a pavement condition that does not need any action (do nothing),
- b. PCI value of 71-85 is within the satisfactory category, which is a pavement condition that needs a minor rehabilitation with patching in damaged points,
- PCI value of 56 71 is within the fair category, which is a pavement condition that needs resurfacing with overlay addition and inlay-scrape and fill,
- d. PCI value of 41 55 is within the poor category, which is a pavement condition that needs major rehabilitation on the overall area of runway pavement by dredging the upper foundation layer and lower foundation layer if the damage is indicated to cause more damage to the layer.
On the FAA AC 150-5380-6C (2012), there are guidelines for flexible pavement maintenance based on the type of damage that occurs. The following is a guideline Table 3 for flexible pavement maintenance based on the type of damage that occurs.
2.6 Method/calculation using the COMFAA program
The ACN / PCN system is the only method applied by ICAO (International Civil Aviation Organization) to rate the performance/strength of airport pavement. By using this method, the effect/damage caused by an aircraft (with a certain weight and configuration, as well as certain pavement type and ground strength) can be represented by a number called the ACN (Aircraft

Source: FAA Advisory Circuits: 100 SSM-TB Alcoof Povement Monogement Program
Figure 1. Types of handling based on the reduction of the PCI Value
(source: FAA 150-5380-7B, 2014)
Classification Number). Conversely, the capacity/ strength of a pavement can also be represented by a number without the need to specify the type of aircraft and detailed information about the pavement structure. number is called the PCN (Pavement Classification Number). The pavement structure is considered capable of serving loads due to air traffic if the PCN value is greater than the ACN value for each aircraft operating at the airport. Information on the PCN value can then provide an overview of the pavement structure condition and is used by airport operators to determine strategies and policies in the maintenance of pavement structures. To determine the PCN value, a computer program called COMFAA is used. The data needed to run the COMFAA program is aircraft traffic data in the form of aircraft manufacturing, aircraft type, aircraft weight and number of annual departures.
The steps in the analysis process to get the PCN value using COMFAA software referred to the DGCA regulation Number KP: 93 of 2015 concerning Operational Technical Guidelines for Civil Aviation Safety Regulations Part 139 - 24. Some data is needed to get the PCN value.
- 1. Data traffic with growth up to 20 planned years
- Characteristics of aircraft operating such as aircraft net load, annual departures, tire pressure, and others.
- 3. Equivalent pavement thickness resulting from the calculation and subgrade strength value.
- 4. The pavement thickness and CBR value that has been evaluated on the main COMFAA layer
- 5. P/TC value, based on the following Table 4.
Based on its condition, Sepinggan Balikpapan Airport has a parallel taxiway and refueling is done at the airport so that the value is 1.
2.7 Method/calculation using the FAARFIELD program
Pavement design with the FAARFIELD program is an iteration process for both flexible and rigid pavement
Table 3. Guidelines for maintenance of flexible pavement by the type of damage
| Problem | Repair | Probable Cause | ||
|---|---|---|---|---|
| Manthanina / Ovidation | Apply surface treatment | Environment | ||
| Weathering / Oxidation | Overlay | Lack of timely surface treatments | ||
| Remove old sealer material if present | Age | |||
| Clean and prepare cracks | Environmental Conditions | |||
| One also | Seal/reseal cracks | Bitumen too hard or overheated in mix | ||
| Cracks | Joint heating may be an option for longitudinal cracks when under the direction of an engineer. (Operate heaters to avoid excessive heat on the pavement) | Sealant defects (e.g., incorrect application temperature, improper, sealant selection, improper crack preparation) | ||
| Alligator or Fatigue cracking | Remove and replace damage pavement, including the base and/or subbase course if required | Base and/or subgrade failure, overload, under- design surface course (too thin) | ||
| Patches | remove/replace | Inadequate/improper repair detail/material | ||
| Palches | Surface grinding/milling | Age | ||
| Surface irregularities | remove and replace damage areas | Traffic | ||
| (e.g., rutting, wash- boarding birdbaths) | Surface grinding/milling | Age | ||
| Remove rubber/surface contamination | Rubber deposits/surface contamination | |||
| Loss of skid resistance | Apply surface treatment | Polished aggregate, Improper surface treatment | ||
| Bleeding | Blot with sand and remove sand prior to resuming aircraft operation. Escessive bleeding may require removal and replacement of pavement | Overlay rich mix/low air void content. Bleeding may be a precursor to other surface deformities forming, e.g., rutting, wash - boarding, etc. | ||
| Grade pavement shoulders, clear drainage path | Poor maintanance of drainage facilities | |||
| Drainage | Clean out drainage structures. e.g., edge drains, outfall, etc | Poor maintanance of grade | ||
(source: FAA AC 150-5380 - 6C, 2014)
Table 4. P/TC Value for various aircraft scenarios
| Taxiway Facility | Refueling is done the Airport | at | Refueling is not done at the Airport |
|---|---|---|---|
| Parallel Taxiway | 1 | 2 | |
| Single Taxiway | 2 | 3 |
designs. FAARFIELD will calculate the thickness of the overlay based on
- 1. Structure type and the thickness of the layer of the pavement to be analyzed
- 2. Aircraft type and its load
- 3. Residual life and compaction needs
2.8 Life cycle cost analysis
The calculation of life cycle cost analysis can be done using the Present Worth Method equivalent approach, using:interest rate, analysis period, present time, and inflation can be ignored. Then LCC modeling is calculated without any residual value and with residual value (Firsani, 2012). Just as suggested in the study (WVDOH, 2004). To get the LCC value, use the Present Worth Method. The following is the formula of the approach:
\[P = F\left(\frac{1}{(1+i)^n}\right) \tag{6}\]
Where:
P = Current year's value
F = Desired year's value
n = Growth period (years)
= Discount rate
2.9 Previous studies
Research on airports, maintenance of pavement structures
using the PCI and LCCA methods have been carried out before. The studies are as follows.
Amanah (2019) conducted a study on optimization of runway maintenance using the PCI method and the application of LCCA where the results of the analysis of PCI values showed a decrease every year. The evaluation results of the runway pavement structural layer also obtained a bigger value of PCN compared to the ACN so that it could be concluded that the structural layer could serve the existing flight traffic. Handling costs were also based on handling volumes of previous years, unit price analysis, and calculating the present value during maintenance. The scenarios were built based on a decrease in the average PCI value. The analysis results of the scenarios that were built recommended that the minimum handling cost was scenario 4 with the handling type of inlay scrape and fill every 7 years when the PCI value was 60 (fair) with the total handling costs for 20 maintenance periods amounting to Rp.101,713,401,085,-
Widianto, B (2017) conducted a study on Halim Perdanakusuma Airport Pavement Condition Index (PCI). This PCI study was conducted in the Jakarta Halim Perdanakusuma Airport runway (flexible pavement) with an area of 3000 x 45 meters. PCI was analyzed using the ASTM D 5340-12 (Standard Test Method for Airport Pavement Condition Index Surveys) method with a sample of 10% of all the total sample area. From the results of the study, it was found that there were 3 different PCI values that indicated a decrease in the pavement condition, namely the existing PCI condition (before repair) was 69 (fair), the "do something" PCI condition (after repairing) was 65 (fair), and the "do nothing" PCI condition (if the aircraft is not repaired and rutting damage increases/occurs on the aircraft wheel path) was 59 (fair). These results indicated that the decrease in the PCI runway if it was repaired, had a smaller value than if the runway was not repaired.
3. Methodology
The methodology of the study conducted is in Figure 2 The following is a flowchart as a framework for thinking to help the process of the study and for problem solving. There are 10 stages described in the flowchart in this study. Stages begin with the formulation of the problem to get the best scenario. The best scenario is a conclusion for this research. The best scenario is expected to be able to optimize maintenance on the runway.
4. Data Processing
4.1 Primary survey results (pavement condition index)
The results of the survey conducted to fulfill the primary data in this study found several types of damage that existed in the Balikpapan Sepinggan Airport runway, namely corrugation, raveling, depression, patching, oil spillage, rutting, jet blast erosion, and alligator cracking. The damage consisted of various levels of damage, namely low, medium, and high. The following is a pie chart of the type of damage that exists in the Balikpapan Sepinggan Airport runway which can be seen in Figure 3.
Based on the picture, the greatest total damage density to the total area of each sample is a type of corrugation damage that is 389.09%.
4.2 Primary data processing
The steps taken to process primary data are as follows:
- Calculate Distress Density damage to the total area of each sample.
- b. Calculate the Deduct Value to get a deduct value of the damage type graph for each damage type. The determination of the deduct value is seen based on the graph of the type of damage that occurs. Each type of damage will have a different graph so that the value to be generated will be different.
Figure 2. Research Flowchart
- c. Calculate all distress density dan deduct value (DV) based on the damage type and severity of the damage and severity on each sample unit.
- d. Calculate the m value to ensure the damage type maximum number. Example: Sort the DV from the largest to the smallest, then calculate the m value from the HDV (highest deduct value).
- e. Calculate the deduct value and total deduct value of each q (number of entries with DV greater than 5)
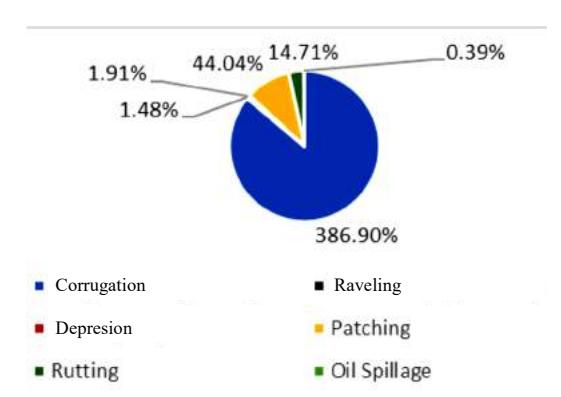
Figure 3. Pie chart of the damage type on the runway
- f. Calculate the corrected deduct value (CDV) from the total deduct value (TDV) data by using the corrected deduct value (CDV) graph (ASTM D5340-12).
- g. Calculate all pavement condition index (PCI) for each sample and calculate the overall sample value by averaging all pavement condition index (PCI) values for each sample. An average PCI value of 61 (Fair) was obtained for the Balikpapan Sepinggan Airport runway in the existing condition (2019) which can be seen in the Figure 6.
4.3 Secondary data processing
The following is the processing of secondary data. Airline flight traffic data for the planned critical aircraft.
The processing of aircraft traffic data at the Balikpapan Sepinggan Airport was based on annual number of passenger data from 2014 to 2018. The passenger growth at Balikpapan Sepinggan Airport was 5.7%. The following is an annual passenger and daily passenger data Table 5 from 2014 to 2018.
With a passenger growth of 5.7%, a calculation of the number of passengers up to the planned year (2039) was conducted. Based on the annual passenger data, annual aircraft requirements were calculated based on the capacity/module of each aircraft type for up to 20 plan years (2039). The following is a Table 6 of traffic calculation results based on annual number of passengers in 2019, 2024, 2029, 2034 and 2039.
The percentage of load distribution received by the majority on the rear landing gear (main) has a value of 95%. After calculating aircraft loads for each module, the annual Equivalent Annual Departures for critical/plan
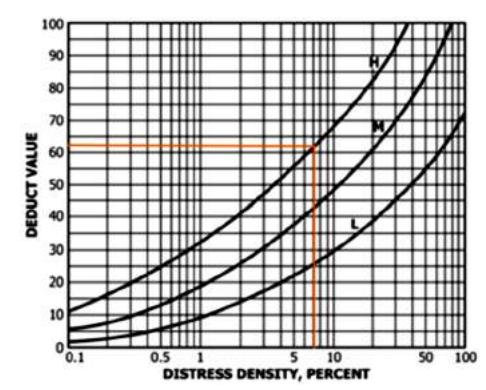
Figure 4. Corrugation damage graph (source: ASTM D5340-12,2012)
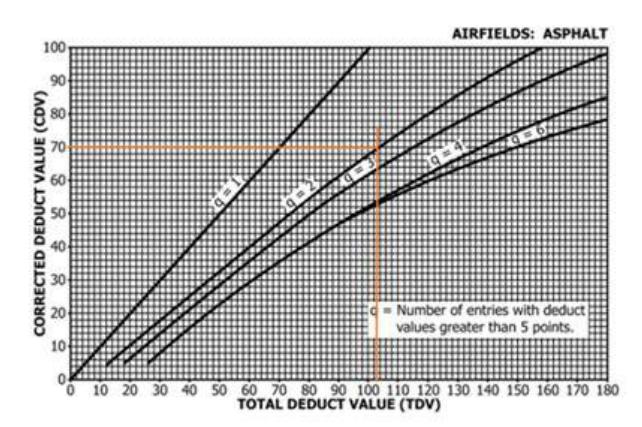
Figure 5. Determination of the CDV for each q
aircraft was calculated. The critical aircraft planned at Balikpapan Sepinggan Airport until the planned year (2039) is B777 - 300 ER. The following is aircraft traffic at Balikpapan Sepinggan Airport in 2019, 2024, 2029, 2034, and 2039.
B777 – 300 ER Aircraft Type Calculation:
\[R1 = R2^{\sqrt{\frac{W2}{W1}}} \tag{7}\]
W1 =% main gear distribution x MTOW of planned aircraft x =
% main gear distribution x MTOW of mixed aircraft x -
Wheel Load Ratio A320 on B777:
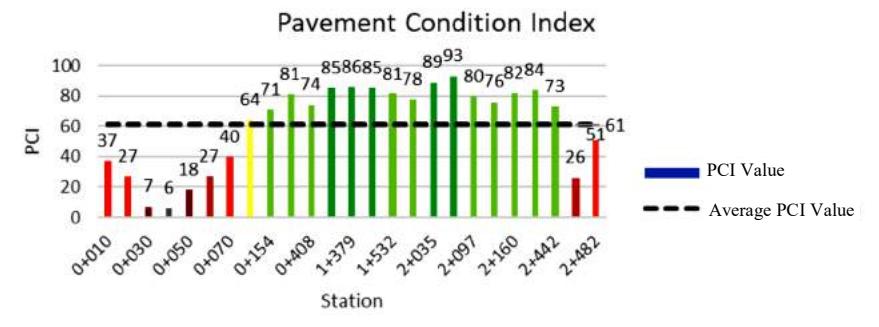
Figure 6. PCI Graph for 2019 (primary data)
Table 5. Annual passenger data of Balikpapan Sepinggan airport in 2014 - 2018
| Year | 2014 | 2015 | 2016 | 2017 | 2018 | Desc. |
|---|---|---|---|---|---|---|
| Total Annual Number of Passenger | 7.598.630 | 7.301.288 | 7.441.452 | 7.324.285 | 7.491.924 | 7.431.516 |
| Total Daily Number of Passenger | 20.819 | 20.004 | 20.388 | 20.067 | 20.526 | 20.361 |
| Peak Hour Coefficient | 0,045 | 0,045 | 0,045 | 0,045 | 0,045 | 0,045 |
| Peak Hour Volume | 937 | 901 | 918 | 904 | 924 | 917 |
(source: PT. Angkasa Pura I, 2019)
Tabel 6. Estimated annual number of modules
| Module | Load | - | Annual Number of Modules | ||||||||||
|---|---|---|---|---|---|---|---|---|---|---|---|---|---|
| Туре | Factor | Capacity | 2019 | Number of Passenger | 2024 | Number of Passenger | 2029 | Number of Passenger | 2034 | Number of Passenger | 2039 | Number of Passenger | |
| A320 | 186 | 0,8 | 149 | 1825 | 271560 | 5475 | 814680 | 9125 | 1357800 | 10950 | 1629360 | 12045 | 1792296 |
| A332 | 335 | 0,8 | 268 | 3650 | 978200 | 6935 | 1858580 | 9125 | 2445500 | 9855 | 2641140 | 12775 | 3423700 |
| ATR42 | 42 | 0,8 | 34 | 6205 | 208488 | 7665 | 257544 | 9490 | 318864 | 11315 | 380184 | 18250 | 613200 |
| ATR72 | 72 | 0,8 | 58 | 5840 | 336384 | 7665 | 441504 | 9125 | 525600 | 10950 | 630720 | 14965 | 861984 |
| B733 | 128 | 0,8 | 102 | 5475 | 560640 | 7665 | 784896 | 9490 | 971776 | 12775 | 1308160 | 16425 | 1681920 |
| B735 | 149 | 0,8 | 119 | 5475 | 652620 | 7300 | 870160 | 9855 | 1174716 | 12775 | 1522780 | 17155 | 2044876 |
| B738 | 189 | 0,8 | 151 | 7300 | 1103760 | 7300 | 1103760 | 9855 | 1490076 | 14600 | 2207520 | 18615 | 2814588 |
| B739 | 220 | 0,8 | 176 | 7300 | 1284800 | 7665 | 1349040 | 10220 | 1798720 | 14965 | 2633840 | 18615 | 3276240 |
| B777 | 396 | 0,8 | 317 | 5475 | 1734480 | 7300 | 2312640 | 9125 | 2890800 | 12775 | 4047120 | 17520 | 5550336 |
| CRJX | 100 | 0,8 | 80 | 9125 | 730000 | 7300 | 584000 | 8760 | 700800 | 13140 | 1051200 | 21900 | 1752000 |
| Total | 1817 | 1454 | 57670 | 7860932 | 72270 | 105051672 | 94170 | 13674652 | 124100 | 18052024 | 168265 | 23811140 | |
Table 7. Equivalent annual departure in 2019
| No | Aircraft Type | MTOW (lbs) | R2 | N | W1 (lbs) | W2 (lbs) | Wheel Load Ratio | R1 | Percent on Gear (%) | Tire Press (Kpa) |
|---|---|---|---|---|---|---|---|---|---|---|
| 1 | A320 | 171961 | 1825 | 10 | 30677 | 8168 | 0,52 | 48 | 47,5% | 1220 |
| 2 | A332 | 533519 | 3650 | 10 | 30677 | 25342 | 0,91 | 1729 | 47,5% | 1420 |
| 3 | ATR42 | 41005 | 6205 | 6 | 30677 | 3246 | 0,33 | 17 | 47,5% | 552 |
| 4 | ATR72 | 49603 | 5840 | 6 | 30677 | 3927 | 0,36 | 22 | 47,5% | 552 |
| 5 | B733 | 139500 | 5475 | 6 | 30677 | 11044 | 0,60 | 175 | 47,5% | 1386 |
| 6 | B735 | 136000 | 5475 | 6 | 30677 | 10767 | 0,59 | 164 | 47,5% | 1388 |
| 7 | B738 | 174200 | 7300 | 6 | 30677 | 13791 | 0,67 | 389 | 47,5% | 1407 |
| 8 | B739 | 187700 | 7300 | 6 | 30677 | 14860 | 0,70 | 488 | 47,5% | 1517 |
| 9 | B777 | 775000 | 5475 | 12 | 30677 | 30677 | 1,00 | 5475 | 47,5% | 1524 |
| 10 | CRJX | 91800 | 9125 | 6 | 30677 | 7268 | 0,49 | 85 | 47,5% | 552 |
(8)
\(\frac{W2}{W1}\)
Where:
R1 = Equivalent traffic cycles of the critical aircraft
R2 = Annual number of aircraft
W1 = Wheel loads from critical aircraft
W2 = Wheel load of each type of aircraft
Equivalent Annual Departure was calculated with the most critical planned aircraft, namely the B777. All aircraft loads other than B777 would be converted to B777 so that the number of aircraft arrivals other than B777 would be smaller compared to B777. The following is a Table 7 showing the Equivalent Annual Departure in 2019.
The following are equivalent annual departure values for 2019, 2024, 2029, 2034 and 2039 as aircraft traffic
data that will be analyzed using FAARFIELD and COMFAA. Based on the following Table 8, the B777 is the most critical aircraft with the highest number of arrivals, while the ATR42 is the aircraft with the smallest load so that it will produce a small number of arrivals because it has been converted to the most critical aircraft, the B777.
Balikpapan Sepinggan Airport Payement Runway Layering System Data
The airport runway pavement layer data was used to see whether the existing pavement layer can withstand aircraft loads according to the existing traffic at Balikpapan Sepinggan Airport. There are 2 different segments on the Balikpapan Sepinggan Airport runway. Segment 1 and segment 2 differ in thickness on the aggregate (0-40 mm). In segment 1 the thickness is 48cm and in segment 2 the thickness is 46cm. The following are Picture 7 and 8 of the pavement structure on the runway.
Table 8. Equivalent annual departure in 2019, 2024, 2029, 2034 and 2039
| Aircraft Type | 2019 | 2024 | 2029 | 2034 | 2039 |
|---|---|---|---|---|---|
| A320 | 48 | 85 | 111 | 121 | 128 |
| A332 | 1729 | 3098 | 3976 | 4264 | 5398 |
| ATR42 | 17 | 18 | 20 | 21 | 24 |
| ATR72 | 22 | 25 | 26 | 28 | 31 |
| B733 | 175 | 214 | 243 | 291 | 338 |
| B735 | 164 | 194 | 232 | 271 | 323 |
| B738 | 389 | 389 | 476 | 620 | 729 |
| B739 | 488 | 505 | 617 | 805 | 937 |
| B777 | 5475 | 7300 | 9125 | 12775 | 17520 |
| CRJX | 85 | 76 | 83 | 101 | 130 |
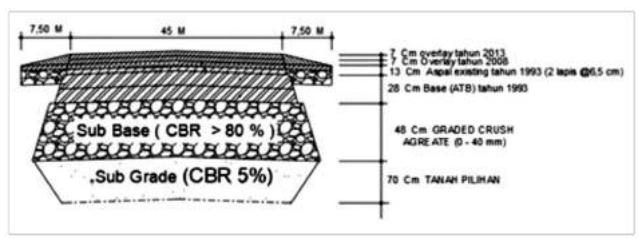
Figure 7. Existing pavement segment 1 thickness (Source: PT. Angkasa Pura I, 2019)
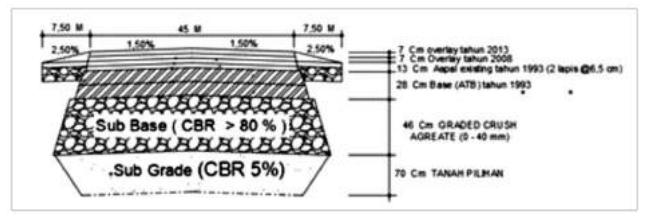
Figure 8 Existing pavement segment 2 thickness (Source: PT. Angkasa Pura I, 2019)
In COMFAA, an analysis was carried out in accordance with traffic in 2019, 2024, 2029, 2034 and 2039. In segment 1, it was assumed that half of the runway length (sta 0 + 000 - 1 + 250) had a surface (P-401 / P-403) thickness under the existing condition of 55 cm and 33 cm after being corrected, and the subbase (P-209) in the existing condition had a thickness of 48 cm and 18 cm after being corrected. In segment 2, it was assumed that half of the runway length (sta 1 + 250 - 2 + 500) had a surface (P-401 / P-403) thickness under the existing condition of 55 cm and 33 cm after being corrected, and the subbase (P-209) in the existing condition had a thickness of 46 cm and 17 cm after being corrected. The following is a recap of the results of COMFAA running.
b. Pavement condition index (PCI) in 2013, 2014 and 2015
PCI in 2013, 2014 and 2015 were obtained based on the work report of the consultancy service on Balikpapan Sultan Aji Muhammad Sulaiman Sepinggan Airport recovery and maintenance master plan which can be seen in the Table 11.
c. Balikpapan City Unit Price Data
Balikpapan City unit price data was used to calculate the cost of runway pavement maintenance. The planned
Table 9. Recapitulation of PCN & ACN values based on COMFAA in segment 1
| No | Typo - | PCN | ACN | ||||
|---|---|---|---|---|---|---|---|
| NO | Type | 2019 | 2024 | 2029 | 2034 | 2039 | ACN |
| 1 | A320 | 24,1 | 23,7 | 23,4 | 23 | 22,7 | 47,3 |
| 2 | A332 | 31,3 | 30,8 | 30,5 | 30 | 29,6 | 72,7 |
| 3 | ATR42 | 14,5 | 14,5 | 14,5 | 14,5 | 14,5 | 7,4 |
| 4 | ATR72 | 14,5 | 14,5 | 14,5 | 14,5 | 14,5 | 10,1 |
| 5 | B733 | 22,2 | 21,9 | 21,7 | 21,4 | 21,1 | 38,8 |
| 6 | B735 | 21,8 | 21,5 | 21,3 | 21 | 20,8 | 57,4 |
| 7 | B738 | 24,5 | 24 | 23,7 | 23,3 | 22,9 | 50 |
| 8 | B739 | 25,5 | 25 | 24,6 | 24,2 | 23,7 | 56 |
| 9 | B777 | 34,3 | 33,8 | 33,5 | 33 | 32,6 | 89,3 |
| 10 | CRJX | 18,4 | 18,3 | 18,2 | 18,1 | 17,9 | 24,3 |
Table 10. Recapitulation of PCN & ACN values based on COMFAA in Segment 2
| No | Type | PCN | ACN | ||||
|---|---|---|---|---|---|---|---|
| NO | Type | 2019 | 2024 | 2029 | 2034 | 2039 | ACN |
| 1 | A320 | 23,5 | 23,1 | 22,8 | 22,4 | 22,1 | 47,3 |
| 2 | A332 | 30,4 | 29,9 | 29,6 | 29,1 | 28,7 | 72,7 |
| 3 | ATR42 | 14.0 | 14.0 | 14.0 | 14.0 | 14.0 | 7,4 |
| 4 | ATR72 | 14.0 | 14.0 | 14.0 | 14.0 | 14.0 | 10,1 |
| 5 | B733 | 21,6 | 21,3 | 21,1 | 20,8 | 20,5 | 38,8 |
| 6 | B735 | 21,3 | 21.0 | 20,8 | 20,5 | 20,2 | 57,4 |
| 7 | B738 | 23,8 | 23,4 | 23,1 | 22,7 | 22,3 | 50 |
| 8 | B739 | 24,7 | 24,3 | 23,9 | 23,5 | 23,1 | 56 |
| 9 | B777 | 33,2 | 32,7 | 32,4 | 32 | 31,6 | 89,3 |
| 10 | CRJX | 18.0 | 17,9 | 17,8 | 17,6 | 17,5 | 24,3 |
Table 11. PCI in 2013, 2014 and 2015
| Year | PCI |
|---|---|
| 2013 | 100 |
| 2014 | 94 |
| 2015 | 84 |
(source: PT. Angkasa Pura I. 2016)
budget would be calculated based on the type of damage, damage volume, and unit price in Balikpapan. The budget plan was calculated with several scenarios so that the maintenance plan with the most optimum costs would be obtained. The following is a Table 12 of work type and unit price based on Balikpapan's unit cost of activity.
4.4 Projection of runway pavement damage level
Projection of PCI on Balikpapan Sepinggan Airport's runway PCI value projection on the Balikpapan Sepinggan Airport runway was also carried out on the annual number of passengers. The following is a Picture 9 of the decrease in PCI with the annual number of passengers.
Based on the graph above, the smaller the PCI, the higher the damage severity in the Balikpapan Sepinggan Airport's runway pavement. The PCI on the graph above generated an exponential equation model with y=281,61e<sup>-3E-04x</sup> and \(R^{2}\) = 0,9938. Based on the equation, a forecast would be conducted if no maintenance was done on the Balikpapan Sepinggan Airport runway.
Table 12. Asphalt work and asphalt pavement scrape
| Type of Work | Price | Unit |
|---|---|---|
| Asphalt Work | Rp 3.566.620 | \(m^3\) |
| Asphalt Pavement Scrape with Tools | Rp 149.469 | \(m^3\) |
(Source: Balikpapan's unit cost of activity, 2018)
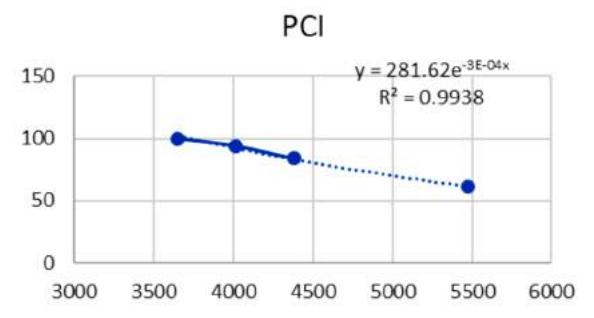
Figure 9. Graph of Decrease in PCI Based on Critical
The decrease in PCI value based on the annual number of passengers until the planned year, 2039, can be seen in the following Figure 10.
The following is a graph of the decrease in PCI based on the number of annual critical aircraft until the planned year, 2039, where the critical aircraft planned until the planned year is the B777-300 ER.
The graph above shows the effect of the PCI predicted from the previous exponential equation with a scenario of no improvement until the planned year, 2039. PCI between 41-55 is categorized as poor, and the type of treatment undertaken is major rehabilitation. In 2020, the Balikpapan Sepinggan Airport runway pavement must be maintained so that it can return the PCI to 100. Based on the decrease in PCI until the planned year, an evaluation using COMFAA was conducted in accordance with the traffic that has been analyzed in previous calculations to determine the PCN on the runway pavement structure if no maintenance was carried out until the planned year (2039). The evaluation was conducted using COMFAA in accordance with the layering system in segment 1 and segment 2 at the Balikpapan Sepinggan Airport runway.
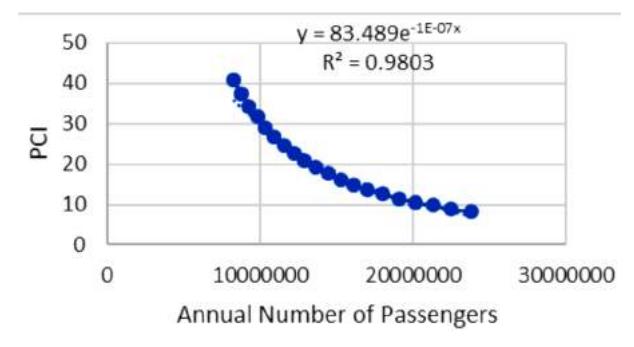
Figure 10. Graph of projection of decrease in PCI until the planned year (2039) based on the annual number of passenger
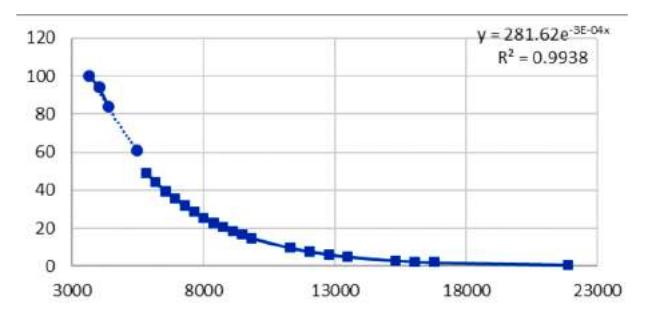
Figure 11. Graph of projection of decrease in PCI until the planned year (2039) based on the annual critical aircraft
The Table 13 shows the decrease in PCI in 2019, 2024, 2029, 2034 and 2039 if no maintenance is performed. The decrease in PCI will affect the PCN with the most critical aircraft, which is B777, on the structure of the pavement on the runway. If the PCI decreases, the PCN value will also decrease so maintenance is needed to control the condition in the runway pavement structure so that the PCN value is not less than the most critical aircraft's ACN.
Table 13. Estimation of the effect of decrease in PCI value on PCN value
| Year | PCI | PCN (B777) Seg.1 | PCN (B777) Seg.2 | ACN B-777 |
|---|---|---|---|---|
| 2019 | 61% | 34,4 | 33,2 | 89,3 |
| 2024 | 32% | 10,5 | 9,9 | 89,3 |
| 2029 | 18% | 5,3 | 4,8 | 89,3 |
| 2034 | 6% | 3,3 | 2,9 | 89,3 |
| 2039 | 0% | 0 | 0 | 89,3 |
5. Data Analysis
5.1 Best scenario criteria
The determination of the damage handling type scenario in runway pavement depends on the value of PCI, the damage type, and the existing runway pavement thickness' strength. The handling of runway pavement damage must be in accordance with the severity of the damage and the type of pavement damage. The purpose of this scenario determination was to obtain the most optimum cost for maintenance in terms of the type of damage handling in the runway pavement. Besides, runway maintenance at the Balikpapan Sepinggan Airport aims to keep the runway from experiencing structural damage such as corrugation, rutting, and depression because these damage types will substantially decrease the value of PCI. The following is a guide Figure available in FAA AC 150-5380 - 6C year 2014 for maintenance recommendations based on the damage type that occurs.
5.2 Damage handling type strategy in runway pavement
Based on the PCI method, there are several references for decision making in the maintenance of damage to runway pavement taken from the FAA. Based on the
SULPDU\ GDWD VXUYH\ FRQGXFWHG LQ WKH H[LVWLQJ \HDU RI WKHUHZHUHVHYHUDOW\SHVRIGDPDJHWKDWZHUHTXLWH GRPLQDQWLQWKH %DOLNSDSDQ 6HSLQJJDQ $LUSRUW UXQZD\ QDPHO\ FRUUXJDWLRQ SDWFKLQJ GHSUHVVLRQ UXWWLQJ DQG UDYHOLQJ%DVHGRQWKRVHGDPDJHW\SHVWKHRQHWKDWZDV TXLWH LQIOXHQWLDO RQ WKH GHFUHDVH LQ WKH 3&, RQ WKH %DOLNSDSDQ 6HSLQJJDQ $LUSRUW UXQZD\ ZDV WKH FRUUXJDWHG GDPDJH W\SH %DVHG RQ PDLQWHQDQFH JXLGHOLQHV SURYLGHG E\WKH )$$ IRU GDPDJHW\SHV VXFK DV FRUUXJDWLRQ GHSUHVVLRQ DQG UXWWLQJ ZKLFK DUHLQWKH FDWHJRU\ RI VXUIDFH LUUHJXODULWLHV FDXVHG E\ WUDIILF DQG SDYHPHQW DJH WKH VXJJHVWLRQ IRU LPSURYHPHQW WR EH FDUULHG RXW LV WR UHPRYH DQG UHSODFH WKH GDPDJHG DUHD %DVHGRQWKHGHFUHDVHLQ3&,LQZKLFKLVSRRU LWLV UHFRPPHQGHGWKDW DPDMRU UHKDELOLWDWLRQLV GRQHWR UHVWRUH WKH FRQGLWLRQ RI WKH SDYHPHQW VWUXFWXUH WR EDVHG RQ WKH )$$ --% 6R EDVHG RQ WKH UHFRPPHQGDWLRQV JLYHQ E\ WKH )$$ VHYHUDO VFHQDULRV ZHUHSODQQHG7KHIROORZLQJLVDVFHQDULRRIWKHKDQGOLQJ W\SHV WKDW FDQ EH GRQH IRU WKH PDLQWHQDQFH RI WKH %DOLNSDSDQ6HSLQJJDQ$LUSRUWUXQZD\
- $GGLWLRQDO SDYHPHQW OD\HUV RQ WKH HQWLUH SDYHPHQW RYHUOD\ LQGRQHHYHU\\HDUVDQGSDWFKLQJLQ WKHIROORZLQJ\HDUV
- ,QOD\ VFUDSH DQG ILOO LQ GRQH HYHU\ \HDUV DQGSDWFKLQJLQWKHIROORZLQJ\HDUV
- ,QOD\ VFUDSH DQG ILOO LQ GRQH HYHU\ \HDUV DQGSDWFKLQJLQWKHIROORZLQJ\HDUV
- ,QOD\– VFUDSHDQG ILOORIFPLQGRQHHYHU\ \HDUVDQGSDWFKLQJLQWKHIROORZLQJ\HDUV
2YHUOD\WKLFNQHVVUHTXLUHPHQWFDOFXODWLRQUHVXOWV
%DVHGRQWKHDQDO\VLVXVLQJ)$$5),(/'DQG&20)$$ VRIWZDUH IRU RYHUOD\ KDQGOLQJ VFHQDULRV VHJPHQW UHTXLUHV FP RI WKLFNQHVV DQG VHJPHQW UHTXLUHV FP RI WKLFNQHVV 7KH WKHRUHWLFDO 3&1 IRU WKH PRVW FULWLFDODLUFUDIWZKLFKLVWKH%-(5LQVHJPHQWLV DQG LQ VHJPHQW LV ZKHUH WKH $&1 YDOXH IRU %- (5 DLUFUDIW LV 7KHUH LV D IRXUWK VFHQDULR ZKHUH DQ RYHUOD\ ZLWK FP RI WKLFNQHVV LV SODQQHGWKHWKHRUHWLFDO3&1 IRU%- (5FULWLFDO DLUFUDIWZLWKDFPRYHUOD\LVZKHUHWKH$&1YDOXH LVVRWKDWWKHFPRIWKLFNQHVVKDVQRWEHHQDEOHWR ZLWKVWDQGWKHDLUFUDIWWUDIILFORDGVXQWLOWKHSODQQHG\HDU ZKLFKLV
7KH IROORZLQJ LV WKH YROXPH RI RYHUOD\ ZRUN RQ WKH %DOLNSDSDQ6HSLQJJDQ$LUSRUWUXQZD\
7DEOH9ROXPHRIRYHUOD\ZRUNRQWKH%DOLNSDSDQ 6HSLQJJDQDLUSRUWUXQZD\
| :RUN | 6WDWLRQLQJ | 7KLFNQHVV | /HQJWK | :LGWK | 9ROXPH |
|---|---|---|---|---|---|
| 7\SH | P | P | P | P | |
| 3-3- RYHUOD\ | - | ||||
| 3-3- RYHUOD\ | - | ||||
| 7RWDO |
,QOD\- VFUDSHDQGILOOUHTXLUHPHQWVDQDO\VLV
7KH UHTXLUHPHQWV IRULQOD\VFUDSHDQG ILOOFDQEHGRQH ZKHQWKHWKLFNQHVVRIWKHDGGLWLRQDOOD\HUFRQWLQXHVWR LQFUHDVH 7KH LQFUHDVLQJ WKLFNQHVV RI WKH SDYHPHQW OD\HU ZLOOLQFUHDVHWKH ULVN RI DGHSUHVVLRQLQWKH EDVH DQG VXEEDVH 6FUDSH UHTXLUHPHQWV ZHUH FDOFXODWHG EDVHG RQ WKH H[LVWLQJ SDYHPHQW OD\HU VFUDSH RQ WKH VXUIDFH OD\HU )LOO UHTXLUHPHQWV ZHUH FDOFXODWHG EHIRUHKDQG ZLWK )$$5),(/' 7KH IROORZLQJ LV WKH FDOFXODWLRQRIWKHYROXPHRILQOD\-VFUDSHDQGILOOZRUN
9ROXPH /HQJWK[:LGWK[7KLFNQHVV &RVW 7RWDO9ROXPH[8QLW3ULFHP
7KH 7DEOH DQG EHORZ LV D FDOFXODWLRQ IRU WKH YROXPH RI VFUDSH DQG ILOO ZRUN 7KH VFUDSH DQG ILOO ZHUHFDUULHGRXWDORQJPZKLFKZHUHWKHQGLYLGHG LQWR VHJPHQWV QDPHO\ VHJPHQW ZLWK WKH DVVXPSWLRQ RI - DQG VHJPHQW ZLWKWKH DVVXPSWLRQRI- 7KHVFUDSHDQGILOOZRUN ZDV SODQQHG ZLWK DOWHUQDWLYHV QDPHO\ FP FP DQGFP
3DWFKLQJUHTXLUHPHQWVDQDO\VLV
%DVHGRQWKHGDWDIURP37$QJNDVD3XUD,WKHYROXPH RI SDWFKLQJ HDFK \HDU ZDV WDNHQ IURP WKH KLJKHVW YROXPH ZKLFK ZDV P IRU PLQRU LPSURYHPHQW SODQV LQ WKH %DOLNSDSDQ 6HSLQJJDQ $LUSRUW UXQZD\ DUHD 7KH IROORZLQJ LV D 7DEOH RI WKH FDOFXODWLRQ RI SDWFKLQJFRVWIRURQH\HDU
7RWDO&RVW 9ROXPH[8QLW3ULFHP
7KH7DEOH EHORZLV D FDOFXODWLRQ RIWKH YROXPH RI ILOO ZRUN 7KH ILOO ZRUN XQLW SULFH LV WKH VDPH DV WKH DVSKDOW ZKLFK LV 5S SHU P 7KH WRWDO FRVW UHTXLUHGIRUVFUDSHZRUNIRURQH\HDULV5S
0DLQWHQDQFHFRVWRIKDQGOLQJVFHQDULRVDQDO\VLV
7KH YROXPH FDOFXODWLRQ LQ WKH SUHYLRXV VXE-FKDSWHU ZRXOGEHPXOWLSOLHGE\DQDQDO\VLVRIWKHXQLWSULFHLQ %DOLNSDSDQ 7KH XQLW SULFH XVHG ZRXOG EH FRQYHUWHG LQWRZRUNYROXPHVRWKDWLWFRXOGEHPXOWLSOLHGE\WKH FDOFXODWHG YROXPH 'XULQJ WKH -\HDU PDLQWHQDQFH SHULRG WKH FRVWV WR EH LQFXUUHG ZRXOG LQFUHDVH DFFRUGLQJ WR LQIODWLRQ DQG JURZWK UDWH LQ %DOLNSDSDQ ZKLFK LV 7KH IROORZLQJ DUH WKH UHVXOWV RI WKH FDOFXODWLRQRIWKHWRWDOFRVWIRUHDFKVFHQDULR
7RWDOFRVWRIHDFKVFHQDULR
7KHFDOFXODWLRQRIWKHWRWDOFRVW IRUHDFK VFHQDULRZDV EDVHGRQWKHYROXPHRIZRUNPXOWLSOLHGE\DQDQDO\VLV RI WKH XQLW SULFH LQ %DOLNSDSDQ 7KH XQLW SULFH XVHG ZRXOG EH FRQYHUWHGLQWR ZRUN YROXPH VRWKDWLW FRXOG EHPXOWLSOLHGE\WKHFDOFXODWHGYROXPH'XULQJWKH- \HDUPDLQWHQDQFHSHULRGWKHFRVWVWREHLQFXUUHGZRXOG LQFUHDVH DFFRUGLQJ WR LQIODWLRQ DQG JURZWK UDWH LQ %DOLNSDSDQZKLFKLV7KHIROORZLQJLVWKHWRWDO SODQQHG PDLQWHQDQFH FRVWV IRU RSWLPL]LQJ WKH PDLQWHQDQFHRIWKHSDYHPHQWVWUXFWXUHRQWKHUXQZD\
%DVHGRQWRWDOFRVWVFHQDULRLVWKHVPDOOHVW%DVHGRQ WKHPDLQWHQDQFHVXJJHVWHGE\)$$$&-- &
Table 15. Work volume of Inlay-scrape and fill and total cost (11 cm and 12 cm)
| Work Type | Stationing | Thickness | Length | Width | Volume | Total | Cost | |
|---|---|---|---|---|---|---|---|---|
| m | m | m | m³ | m³ | _ | Cost | ||
| Asphalt Pavement Scrape | 0+000 - 1+250 | 0,11 | 1250 | 45 | 6187,5 | 12937,5 | Rp | 1.933.758.163 |
| Asphalt Pavement Scrape | 1+250 - 2+500 | 0,12 | 1250 | 45 | 6750 | |||
| Fill P-401/P-403 (overlay) | 0+000 - 1+250 | 0,11 | 1250 | 45 | 6187,5 | 40007.5 | Rp | 46.143.152.201 |
| Fill P-401/P-403 (overlay) | 1+250 - 2+500 | 0,12 | 1250 | 45 | 6750 | 12937,5 | ||
| Total Cost | : | Rp | 48.076.910.364 |
Table 16. Work volume of Inlay-scrape and fill and total cost (7 cm)
| Work Type | Stationing | Thickness | Length Width | Volume | Cost | ||
|---|---|---|---|---|---|---|---|
| Stationing | m | m | m | m³ | Cost | ||
| Asphalt Pavement Scrape | 1+250 - 2+500 | 0,07 | 1250 | 45 | 3937,5 | Rp 588.535.093 | |
| Fill P-401/P-403 (overlay) | 0+000 - 1+250 | 0,07 | 1250 | 45 | 3937,5 | Rp 14.043.568.061 | |
| Total Cost | Rp 14.632.103.154 | ||||||
Table 17. Estimated total patching costs for 1 year
| Work | Volume | Unit | Total Cost |
|---|---|---|---|
| Patching | 8,13 | m3 | Rp 29.003.130 |
according to the damage types that exist in the Balikpapan Sepinggan Airport runway, the suggested improvement is to remove and replace the damaged area which is more suitable to scenario 2 and scenario 3. So, scenario 4 is not recommended to be done.
6. Conclusions and Recommendations
6.1 Conclusions
- 1. Based on the primary data survey conducted in 2019 to assess the pavement conditions in the Balikpapan Sepinggan Airport runway using the PCI method, the PCI value for the flexible pavement on the runway is 61 (fair), and if nothing is done in 2020, the PCI value will continue to fall to 49 (poor), so maintenance needs to be done.
- 2. Based on the decrease in PCI that has been analyzed, scenario 2 is a scenario that is in accordance with FAA AC 150-5380 6C according to the damage types in the Balikpapan Sepinggan Airport runway. The recommended improvement is to remove and replace the damaged area. Scenario 2 has a smaller total cost than a similar scenario, scenario 3, which is Rp195,377,000,000 with the maintenance of inlay-scrape and fill once every 7 years with a minor improvement of patching in the following years.
6.2 Recommendations
Recommendations that can be given for this study are:
- 1. A further test of the Balikpapan Sepinggan Airport runway may be conducted to find out the layering condition other than the surface by using HWD (Heavy Weight Deflectometer) so that it can calculate the PCN in more detail per 10 meters.
- 2. Analysis of annual costs until the planned year of 2039 for 20 years in this study uses the inflation
Table 18. Total cost of each scenario
| Scenario | Total Cost | ||
|---|---|---|---|
| 1 | Rp | 187,548,005,020.65 | |
| 2 | Rp | 195,376,834,091.62 | |
| 3 | Rp | 264,569,600,686.22 | |
| 4 | Rp | 81,004,986,829.35 | |
rate of Balikpapan in 2019 and it needs to be updated annually.
7. References
Amanah, T. (2019): Optimasi Pemeliharaan Runway Menggunakan Metode Pavement Condition Index (PCI) dan Penerapan Life Cycle Cost Analysis (Studi Kasus: Bandara Fatmawati Provinsi Bengkulu), Tesis Program Magister, Institut Teknologi Bandung.
American Society for Testing and Materials. ASTM D5340-12. (2012). Standar Test Method for Airport Pavement Condition Index Surveys. United State: ASTM International.
Broten M, dan Sombre R. (2001). The Airfield Pavement Condition Index (PCI) Evaluation Procedure: Advantages, Common Misapplications, and Potential Pitfalls. Proceedings of the Fifth International Conference on Managing Pavements [electronic resource]: August 11-14, 2001, Seattle, Washington.
Federal Aviation Administration. (2012). Advisory Circular No: 150/5380-6C, Guidelines and Procedures for Maintenance of Airport Pavement. United State: US Departement of Transportation
Federal Aviation Administration. (2016). Advisory Circular No: 150/5320-6F, Guidelines and Procedures for Airport Pavement Design and
Rachman, et al.
- Evaluation. United State: US Departement of Transportation
- Federal Aviation Administration. (2014). Advisory Circular No: 150/5380-7B, Guidelines and Procedures for Airport Pavement Management Program. United State: US Departement of Transportation
- Firsani, Trixy. 2012. Analisa Life Cycle Cost pad Green Building Diamond Building Malaysia: Institut Teknologi Sepuluh November: Surabaya.
- Peraturan Direktur Jendral Perhubungan Udara Nomor KP 93 Tahun 2015, tentang Pedoman Teknis Operasional Pengaturan Keselamatan Penerbangan Sipil Bagian 139-23, Pedoman Perhitungan PCN (Pavemnet Classification Number) Perkerasan Prasarana Bandar Udara
- Widianto, B. W, (2017). Vol.3. Pavement Condition Index (PCI) Runway Bandara Halim Perdana Kusuma Jakarta. Jurnal Teknik Sipil Institut Teknologi Nasional. Bandung.
- WVDOH (2004), Value Engineering Manual, Technical Section Engineering Division, Division of Highways West Virginia Departement of Transportation
Study of Flexible Pavement Structure...