
2. Proposal for Development of Dam Condition and Safety Assessment in Indonesia
Proposal for development of assessment in this study has been published previously in a study conducted by Jayadi et al. (2017). So that in this study the main objective was to find out how to develop a condition and safety assessment model of dam infrastructure. The development of condition and safety assessment of dam infrastructure should be done at embankment dams. At embankment dams, a KKB (Komisi Keamanan Bendungan/Dam Safety Commission) session was conducted for the operation certification process based on the safety of the dam. Safety was reviewed through a Great Inspection every 5 years. Based on this, the Great Inspection Report could be used as secondary data and the KKB members could be used as study respondents (Jayadi et al., 2017). The condition indeks was recommended to use the scale of 1-5, with the condition assessment criteria that can be seen in Table 1. Meanwhile, the risk indeks was recommended to use the Modified ICOLD method. with risk class division that can be seen in Table 2.
Based on the result of an interview with geologists who are KKB members, the reservoir component also needs assessment. This is because if there is a
Table 1. Condition assessment criteria (Mersianty 2015)
| Condition Index | Condition Description |
|---|---|
| 5 | Good condition |
| 4 | Mildly damaged condition |
| 3 | Moderately damaged condition |
| 2 | Severely damaged condition |
| 1 | Collapsed |
Table 2. Risk class division in the modified ICOLD (Purnomo, 2013)
| Risk Class | I (Low) | II (Moderate) | III (High) | IV (Extreme) |
|---|---|---|---|---|
| Risk Value | 0-15 | 16-45 | 46-75 | 76-90 |
reservoir area that is wet and has the potential to cause large landslides in the reservoir area, then this can cause overtopping at the dam. In addition, the trashrack/trashboom conditions need to be assessed as a part of the reservoir component. Based on the interview, it was found that the existing assessment system still does not include assessments from a geological point of view. This is necessary so that no earthquakes occur due to filling of reservoirs (Reservoir Triggered Earthquake or Reservoir Induced Earthquake) that can make local residents feel unsafe. While based on the results of an interview with other KKB members, it is recommended that the assessment model should include the HR factor. The HR factor in question is the absence of experts who are able to read the results of instrumentation readings well. This needs to be included in the assessment because in Indonesia this often happens (Jayadi et al., 2017).
In combining the two types of assessment, MCDM (Multi Criteria Decision Making) can be used to get the weight of the assessment. Respondents, who are KKB members, are expected to give a good weighting according to their perception. From the results of the MCDM weighting, an additional analysis in the form of sensitivity analysis can be done so the effect of changes in weighting on the final value of the condition index and safety index can be seen (Jayadi et al., 2017).
3. Development of Dam Condition and Safety Assessment Model
The development of the assessment model was done through three stages. The first stage was the identification of assessment components. The next stage was to develop a condition assessment indicator based on previous studies and the results of interviews with experts. Then, the last stage was to calculate the weight of the assessment using the AHP (Analytic Hierarchy Process). Those three stages can be seen in Figure 1.
3.1 Assessment components identification stage
In the first stage, the dam component components were assessed in a developed condition assessment model. In assessing the condition, the method used was the Condition Index. The components assessed using the Condition Index can be seen in Figure 2. The development of components assessed was based on literature studies, results of secondary data analysis, and pilot surveys. The literature used was the literature regarding dam design so that there would be no errors in the sub-component grouping. The books referred were Teknik Bendungan (Soedibyo, 1993), Bendungan Type Urugan (Sosrodarsono & Takeda, 1989), and Advanced Dam Engineering for Design, Construction, and Rehabilitation (Jansen, 1988). The secondary data referred to were the Consultancy Services Inspection Report for Saguling Hydroelectric Dam Certification/ and the Final Report of the Great 5-Year Inspection of the Dams/Underwater Inspection & Certification of Feasibility of Cirata Dam Operations.
Not only through secondary data and books, but the
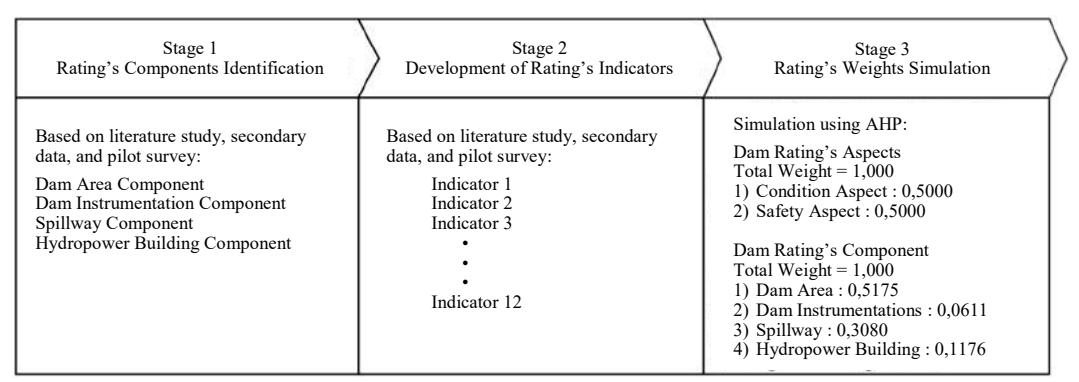
Figure 1. Stages of development of dam condition and safety assessment model
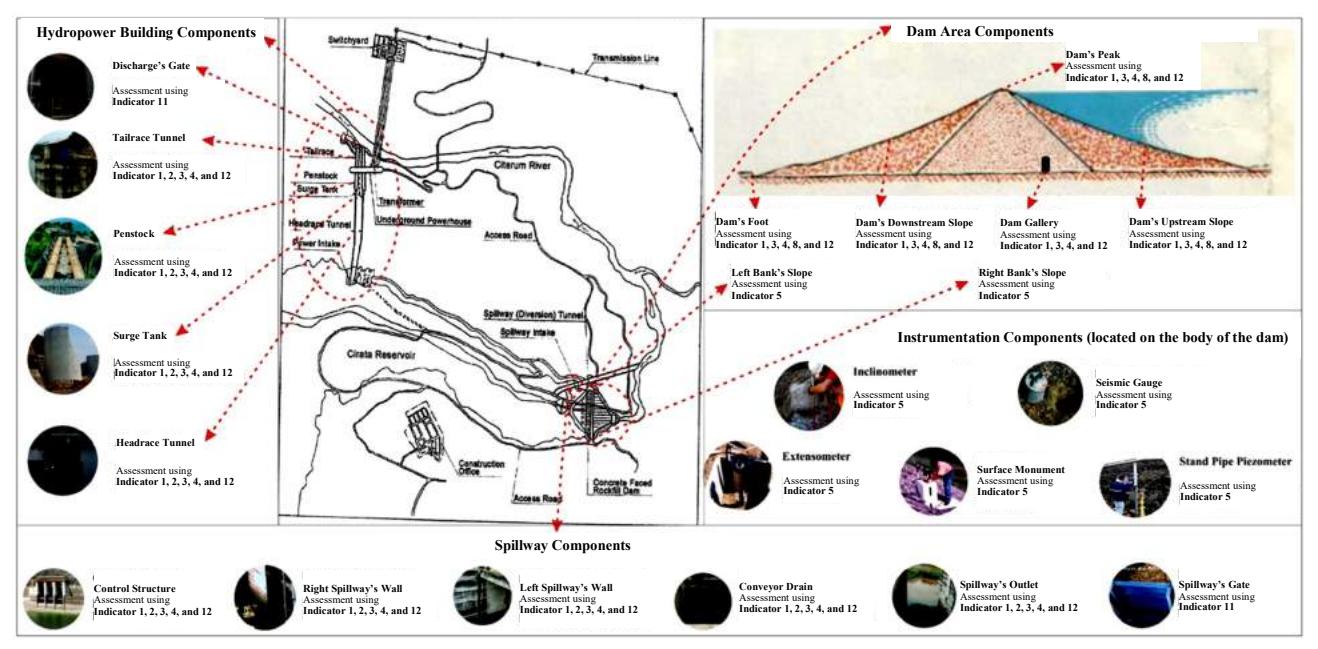
Figure 2. Components for the condition assessment of saguling dam and cirata dam (Modified from PT. Kwarsa Hexagon j.o. Newjec Inc., 2006)
assessed components were also asked during the pilot survey to the experts. The result was the Bottom Outlet component did not need to be included in the assessment component. This was because the Bottom Outlet was an additional building and the function was no longer optimal. The function referred was the sediment flushing function on the dead storage. In addition, some Instrumentation components could not be compared directly because of the core typical of different dams. Namely, the Saguling Dam has a core, while the Cirata Dam has a concrete face so that no instrumentation can be absolutely compared. In addition, according to the experts, there was no emergency spillway at the Saguling Dam and Cirata Dam due to the flood discharge plan using PMF 10000.
Based on the pilot survey, there was a component that needed to be added in the assessment. The component was Dam Gallery. Based on an assessment by the expert, the dam gallery needed to be included due to its very significant function: it allows grouting through the dam gallery if there is a crack. In addition, another function is to measure pore pressure from the dams. Based on this, the dam gallery component was included in the components to be assessed. Based on the pilot survey, the dam gallery was included in the Dam Area component group.
Some other notes related to this assessment model were that some components could not be assessed, this was due to the limited data available in the Consultancy Services Inspection Report for Saguling Hydroelectric Dam Certification/ (PT. Indra Karya, 2011) and Final Report of the Great 5-Year Inspection of the Dams/ Underwater Inspection & Certification of Feasibility of Cirata Dam Operations (PT. Indra Karya, 2015). The data limitation referred was the existence of components or sub-components that were inspected at the Cirata Dam but not inspected at the Saguling Dam, so that the components or sub-components could not be assessed. In addition, there were several different dam characteristics, especially the spillway components used and the type of instrumentation installed at the dam. Meanwhile, in terms of the inspection period for components, all components assessed were inspected every 5 years. This was because the secondary data used was a Great Inspection Report. With the different dam components used, it could not make a more complete assessment of dam components. Meanwhile, with different instrumentations, not all types of instrumentation installed on each dam could be accommodated. The instrumentation installed itself was due to different dam types. Saguling Dam is an embankment dam with a core type, while Cirata Dam is an embankment dam with a concrete face type.
In terms of the dam types that could be assessed, this assessment system could only be used on hydropower functioned embankment dam without an emergency spillway. This was because the assessment model was based on Saguling Dam which is a dam with a core and Cirata Dam which is a dam with a concrete face. As for the spillway type, there were no limitations because the sub-components assessed were made public. From the instrumentation side, dams that could be assessed were only dams with piezometer standpipe, sliding stakes, inclinometers, extensometers, and seismic gauges instrumentations.
3.2 Development of indicators stage
The second stage in the development of dam condition and safety assessment models is the development of indicators to determine the Condition Index. The Condition Indicators were based on previous studies conducted by Mersianty (2015) for the spillway component, and for the other components were based on the Modified Andersen Method (Andersen, 2001; Purnomo, 2013; Center for Water Resources Research, 2006; Indrawan et al., 2013), Andersen Condition Index (Andersen, 1999) and Visual Inspection Manuals (Directorate of Technical Development), 2004; Dam Safety Commission, 2003<sup>a</sup>; Dam Safety Commission, 2003<sup>b</sup>). The Condition Index indicators can be seen in Table 3.
The Modified Andersen Method itself was included in the assessment indicators because the basis of the Dam Safety Study of the Andersen Method is the Condition Index. At the time of the pilot survey, this method was recommended for reference by experts. In addition, experts also recommended using Visual Inspection Guidelines as a basis for assessment so that the methods and guidelines above were used as a reference in the making of assessment indicators.
In the making of assessment indicators, a value equalization was done. The Condition Indicator I5 is the example. In a study conducted by Andersen, et al (1999), it was stated that if the instrumentation produces data or there is no indication of malfunction, the Condition Index value is 100. Meanwhile, if it does not produce data or the data generated is inaccurate, or does not function, the Condition Index value is 0. In
Table 3. Condition index indicators
| Indicator Type | Moderately Damaged Condition (3) | Severely Damaged Condition 2) | Reference | ||
|---|---|---|---|---|---|
| Condition Indicator 1 (I1) | The existence of water plant sediment/tree trunks/ waste of 0 – 10% | The existence of water plant sediment/tree trunks/ waste of 10 – 30% | The existence of water plant sediment/tree trunks/ waste of 30 - 50% of the channel area | The existence of water plant sediment/tree trunks/ waste of more than 50% | Mersianty, 2015 |
| Condition Indicator 2 (I2) | The existence of sediment deposits of 0 – 10% | The existence of sediment deposits of 10 – 25% | The existence of sediment deposits of 25 – 50% | The existence of sediment deposits of more than 50% | Mersianty, 2015 |
| Condition Indicator 3 (I3) | No holes on the wall | Holes in the wall that do not expand or <15% with a hole width of <2 mm | Holes in the wall of 15% - 30% with a hole width of 2 – 5 mm. | Holes in the wall that expand more than 30% with a hole width of > 2 - 5 mm | Mersianty, 2015 |
| Condition Indicator 4 (I4) | No cracks on the wall | Hairline cracks on concrete surfaces of <1 mm and are not widespread (spread <15%) | Cracks on the concrete surface structures with a width of 1 mm – 2 mm and spread of 15 – 30% | Cracks on the concrete surface structures with a width of > 2 mm and widespread (spread < 30%) | Mersianty, 2015 |
| Condition Indicator 5 (I5) | No signs of malfunction in instrumentation, produces accurate reading data | - | Instrumentation functions and produces accurate reading data, but no operator can read the reading results in the field1 | Instrumentation is damaged or does not produce accurate data | Andersen dkk., 1999; 1Hasil Pengembangan Indikator |
| Condition Indicator 6 (I6) | Downstream dam foot area can be inspected | - | - | Downstream dam foot area cannot be inspected | Andersen dkk., 1999 |
| Condition Indicator 7 (I7) | Downstream dam slope area can be inspected | - | - | Downstream dam slope area cannot be inspected | Andersen dkk., 1999 |
| Condition Indicator 8 (I8) | Peak of the dam can be inspected | - | - | Peak of the dam cannot be inspected | Andersen dkk., 1999 |
| Condition Indicator 9 (I9) | Upstream dam slope area can be inspected | - | - | Upstream dam slope area cannot be inspected | Andersen dkk., 1999 |
| Condition Indicator 10 (I10) | Abutmen surface can be inspected | - | - | Abutment surface cannot be inspected | Andersen dkk., 1999 |
| Condition Indicator 11 (I11) | Flood gates and valves in the drain outlet function properly or have just been repaired | Flood gates and valves in the drain outlet rarely operate lately | Flood gates and valves in the drain outlet are not operated | Flood gates and valves in the drain outlet cannot be opened | Puslitbang SDA, 2006; Andersen dkk., 2001 |
| Condition Indicator 12 (I12) | Increased water pore pressure as a result of seepage; Vegetation growth on the surface of the dam | Increased water pore pressure as a result of seepage; The emergence of a wet place on the surface of the dam | Increased water pore pressure as a result of seepage; A constant surface flow | Increased water pore pressure as a result of seepage; An increased surface flow | Puslitbang SDA, 2006; Andersen dkk., 2001 |
this study, the Condition Index ranged from 2 to 5. Therefore, a value equalization was performed.
As another example, the reference used was the research of Andersen et al in 2001. In that study, it was stated that if vegetation grows as a result of an increase in water pore pressures, the Condition Index value ranges between 5 to 10. The indicator was equalized to 5. If a wet place/area appears on the dam surface, the Condition Index value ranges from 4 to 8, so the indicator is equal to the Condition Index of 4. The existence of a constant surface flow as a result of an increase in water pore pressure makes the Condition Index value range from 2 to 7, so that it is equal to the Condition Index value 3. Meanwhile, if the increase in surface flow caused by an increase in water pore pressure makes the Condition Index value range from 0 - 4, it is equalized to the Condition Index value 2.
3.3 Development of assessment model stage
The final stage in this study is a weight assessment simulation. The weight assessment simulation was obtained through primary data in the form of linguistic variables. Through the literature study conducted, data processing methods were used which were considered appropriate in quantifying linguistic variables in the form of respondents' answers with the Analytic Hierarchy Process (AHP) scale. The hierarchy used in this study can be seen in Figure 3.
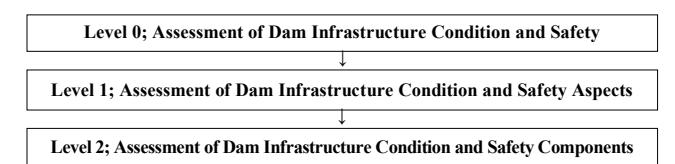
Figure 3. Assessment hierarchy
Primary data was then processed using AHP to obtain the weights. AHP is one of the MCDM methods that is often used. AHP was used as a data processing method since its main input was the perception of human as experts (Saaty and Vargas, 2012). Experts here referred to KKB (Komisi Keamanan Bendungan/Dam Commission). Weights were tested for the hierarchical consistency of Saaty and Vargas (2012). The hierarchy consistency was tested by calculating \(\Lambda_{max}\) using the formula of \([A][x] = A_{max}[x]\). Then the CI (Consistency Index) was calculated using the formula of \(\frac{4max-n}{n}\) Next,
CR (Consistency Ratio) was calculated using the formula of CI . The value of RI (Random Consistency Index)
corresponds to the number of pairwise comparisons. The value of RI can be seen in Table 4. The expected consistency was the one that is near perfect in order to produce a decision that is near valid with a consistency ratio of less than or equal to 10%. If it does not meet the criteria of CR < 0.100 then the assessment must be repeated (Saaty and Varga, 2012).
Primary data processing was continued with sensitivity analysis. Sensitivity analysis was done by giving a coefficient \(\alpha \geq 0\). The coefficient \(\alpha\) was then raised to the comparison matrix (matrix A) or if written in the equation A = \((a_{ij})\) became \(a_{ij}^{\alpha}\) (Hurley, 2001). \(\alpha > 1\) is for more distributed weight, meanwhile \(\alpha < 1\) dis for more concentrated weight (Cabala, 2010).
Based on the results of data collection, the two respondents answered that each component and aspect of the assessment were equally important. Equally important means that the two components or aspects have the same importance level. But this is contrary to the answers from experts after question and answer (QnA) after filling out the questionnaire. The contradiction is an answer regarding the importance of each component or sub-component which is contrary to the advice of experts who state that if one component is heavily damaged, then the final value of the dam should also be included in the heavily damaged category. So there is a contradiction between the questionnaire's answers and the questions' answers.
With this contradiction, an interview was conducted with one of the experts to clarify the answer. In the interview, the expert stated that each component was equally important. However, after in-depth QnA about what components were the main concerns in the KKB Meeting/Sidang KKB, it was found that the importance of each component was different. The level of importance based on interviews is used as a basis in the weighting simulation. The assessment weight of Andersen (1995) was used as a reference basis so that the weighting of the dam area component has a stronger basis. Weight simulation results based on interviews with experts can be seen in Table 5.
In Table 4 it can be seen that no weight has a CR > 0,1000. This shows that all weights are consistent. The simulation results are continued with sensitivity analysis (sensitivity analysis). The sensitivity analysis was not carried out on weights that had the same level of importance. In the sensitivity test of the assessment weight, a final simulation was carried out on the final value of the developed assessment model. The final value of the assessment model was obtained using the following equation:
\[CSI = \sum_{i=1}^{n} (W_i \times I_j)\] (1)
Table 4. RI values (Saaty and Varga, 2012)
| n | 1 | 2 | 3 | 4 | 5 | 6 | 7 | 8 | 9 | 10 |
|---|---|---|---|---|---|---|---|---|---|---|
| RI | 0,00 | 0,00 | 0,58 | 0,90 | 1,12 | 1,24 | 1,32 | 1,41 | 1,45 | 1,49 |
Information:
CSI = Total Condition and Safety Index
\(W_i\) = Weight of the j-th index from the assessment
= The j-th index from the assessment
The final CSI was obtained by testing an assessment model developed for the Saguling Dam and Cirata Dam. Saguling Dam and Cirata Dam were chosen because the model was developed based on the Saguling Dam and Cirata Dam.
Table 5. Assessment weight
| No. | Aspect/Component/ Sub-component | CI | CR | Weight | No. | Aspect/Component/ Sub-component | CI | CR | Weight | ||
|---|---|---|---|---|---|---|---|---|---|---|---|
| Dam Assessment Aspects | Dam Instrument Components | ||||||||||
| 1 | Condition Aspect | - | - | 0,5000 | 9 | Surface Monument | - | - | 0,2000 | ||
| 2 | Safety Aspect | - | - | 0,5000 | 10 | Inclinometer | - | - | 0,2000 | ||
| 1 | Dam Area | 0,0052 | 0,0575 | 0,5175 | 11 | Extensometer | - | - | 0,2000 | ||
| 2 | Dam Instrumentation | 0,0052 | 0,0575 | 0,0611 | 12 | Seismic Gauge | - | - | 0,2000 | ||
| 3 | Spillway | 0,0052 | 0,0575 | 0,3080 | Spillway C | omponents | ; | ||||
| 4 | Hydropower Building | 0,0052 | 0,0575 | 0,1176 | 13 | Control Structure | 0,0494 | 0,0399 | 0,3630 | ||
| Dam Area C | omponent | s | 14 | Right Spillway Wall | 0,0494 | 0,0399 | 0,0849 | ||||
| 1 | Dam's Peak | 0,1192 | 0,0930 | 0,2598 | 15 | Left Spillway Wall | 0,0494 | 0,0399 | 0,0849 | ||
| 2 | Dam's Upstream Slope | 0,1192 | 0,0930 | 0,1293 | 16 | Conveyor Drain | 0,0494 | 0,0399 | 0,0815 | ||
| 3 | Dam's Downstream Slope | 0,1192 | 0,0930 | 0,0802 | 17 | Outlet Spillway | 0,0494 | 0,0399 | 0,0443 | ||
| 4 | Dam's Left Bank | 0,1192 | 0,0930 | 0,0408 | 18 | Spillway's Gate | 0,0494 | 0,0399 | 0,3413 | ||
| 5 | Dam' s Right Bank | 0,1192 | 0,0930 | 0,0408 | Hydropower Build | ding Comp | onents | ||||
| 6 | Dam's Foot | 0,1192 | 0,0930 | 0,4074 | 19 | Headrace Tunnel | 0,0178 | 0,0159 | 0,0732 | ||
| 7 | Dam Gallery | 0,1192 | 0,0930 | 0,0418 | 20 | Surge Tank | 0,0178 | 0,0159 | 0,0732 | ||
| Dam Instrument Components | 21 | Penstock | 0,0178 | 0,0159 | 0,1916 | ||||||
| 8 | Stand Pipe Piezometer | - | - | 0,2000 | 22 | Tailrace Tunnel | 0,0178 | 0,0159 | 0,0732 | ||
| 23 | Discharge Door | 0,0178 | 0,0159 | 0,5887 | |||||||
4. Discussion of Dam Infrastructure Condition and Safety Assessment Model
By conducting a trial, the final values of the Saguling Dam and Cirata Dam were obtained and some limitations were found in the model developed. In Figure 4, the results of the sensitivity test to the trial final assessment model value. In the sensitivity test results, the final value of the Cirata Dam is very sensitive to changes in assessment's weight, meanwhile, the Saguling Dam tends to be insensitive to changes in assessment's weight.
After the weight simulation was done, we can see how sensitive the weight change was to the final assessment using the model made. The weight in the dam infrastructure condition and safety assessment model was based on the first calculation. The assessment model weights can be seen in Table 6. With the assessment weight, the assessment trial test can be conducted to get an in-depth analysis of the developed assessment model.
Based on the assessment model trial, some limitations of the developed assessment models were found. One limitation of this model is the high value of risk even though the impact of deficiency on dam failure is entirely 0. This high value is due to both the Saguling Dam and Cirata Dam having a risk class II (moderate). This is due to its large seismic risk as a result of large reservoir capacity, high dam height, high potential downstream damage, and business risk for owners as a result of high dam failure. Evidence that both dams have a risk class II (moderate) can be seen in Table 7. Because of this, even a new dam even will not reach the value of 5 if the seismic risk is large as a result of

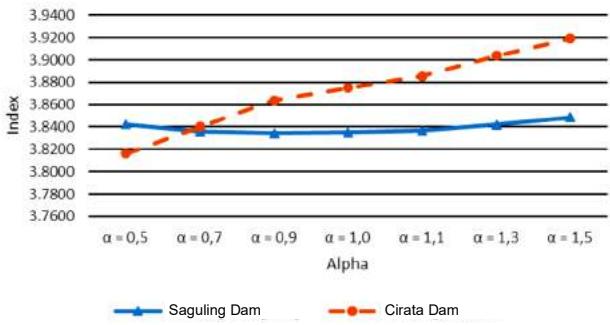
Figure 4. Results of the sensitivity analysis of the assessment weight to the final value
large reservoir capacity, high dam height, high potential of downstream damage, and business risk for owners as a result of high dam failures.
This study also has not fully assessed the functional safety of the dam. One of them is sedimentation that occurs in reservoirs. Functional assessment in this study is difficult to accommodate because there are no indicators of sedimentation in previous studies. From the structural side of the dam, deformation indicators that occur in dam components cannot be included in the model. Deformation itself is often mentioned in the Great Inspection Report.
In the trial of this assessment, there was still a high level of subjectivity. So it can be said that the level of accuracy is still not high. This is proven by the filling of the form of the risk index based condition and safety assessment. In filling out the condition assessment form, a difficulty in assessing Condition Indicator 1 on a sub-component was found. This is due to the great
LQVSHFWLRQUHSRUWWKDWGLGQRWPHQWLRQZKDWSHUFHQWDJHRI WKH DUHD FRQWDLQHG YHJHWDWLRQ VRWKDWWKH VXEMHFWLYLW\ RI WKH LQVSHFWRU SOD\HG D ELJ UROH LQ SURYLGLQJ YDOXHV DFFRUGLQJ WR H[LVWLQJ LQGLFDWRUV 0HDQZKLOH LQ ILOOLQJ RXW WKH ULVN LQGH[-EDVHG VDIHW\ IRUPV VHYHUDO IDFWRUV ILOOHG ZLWK KLJK VXEMHFWLYLW\ ZHUH IRXQG 7KH IDFWRUV
7DEOH$VVHVVPHQWPRGHOZHLJKW
| 1R | 6XE&RPSRQHQW | :HLJKW | 1R | 6XE&RPSRQHQWV | :HLJKW | ||
|---|---|---|---|---|---|---|---|
| 'DP$VVHVVPHQW$VSHFWV | 'DP,QVWUXPHQW&RPSRQHQW | ||||||
| &RQGLWLRQ$VSHFW | 6XUIDFH0RQXPHQW | ||||||
| 6DIHW\$VSHFW | ,QFOLQRPHWHU | ||||||
| 'DP$VVHVVPHQW&RPSRQHQWV | ([WHQVRPHWHU | ||||||
| 'DP$UHD | 6HLVPLF*DXJH | ||||||
| 'DP ,QVWUXPHQWDWLRQ | 6SLOOZD\&RPSRQHQWV | ||||||
| 6SLOOZD\ | &RQWURO6WUXFWXUH | ||||||
| +\GURSRZHU %XLOGLQJ | 5LJKW6SLOOZD\:DOO | ||||||
| 'DP$UHD&RPSRQHQWV | /HIW6SLOOZD\:DOO | ||||||
| 3HDNRIWKH'DP | &RQYH\RU'UDLQ | ||||||
| 'DP¶V8SVWUHDP 6ORSH | 6SLOOZD\¶V2XWOHW | ||||||
| 'DP¶V'RZQVWUHDP 6ORSH | 6SLOOZD\¶V*DWH | ||||||
| /HIW%DQN¶V6ORSH | +\GURSRZHU%XLOGLQJ&RPSRQHQWV | ||||||
| 5LJKW%DQN¶V6ORSH | +HDGUDFH7XQQHO | ||||||
| 'DP¶V)RRW | 6XUJH7DQN | ||||||
| 'DP*DOOHU\ | 3HQVWRFN | ||||||
| 'DP,QVWUXPHQW&RPSRQHQWV | 7DLOUDFH7XQQHO | ||||||
| 6WDQG3LSH 3LH]RPHWHU | 'LVFKDUJH'RRU | ||||||
UHIHUUHG WR DUH WKH SRWHQWLDO GRZQVWUHDP GDPDJH WR H[LVWLQJVWUXFWXUHV EXVLQHVVULVNVWRRZQHUVDVDUHVXOW RI GDP IDLOXUHV DQGWKH GHYHORSPHQW RI QHZ RU IXWXUH GRZQVWUHDP:LWKRXWDFOHDUERXQGDU\WKHDVVHVVPHQW RIWKHVHWKUHHIDFWRUVDUH YHU\VXEMHFWLYH
%DVHG RQWKHVHWKLQJVLIWKHUH ZLOO EH IXUWKHU UHVHDUFK RQWKH GDPLQIUDVWUXFWXUH DVVHVVPHQW V\VWHPLW VKRXOG SD\ DWWHQWLRQ WR VHYHUDO WKLQJV 'DP LQIUDVWUXFWXUH DVVHVVPHQW V\VWHPV VKRXOG EH GLIIHUHQW EHWZHHQ GDPV EHFDXVH HDFK GDP KDV GLIIHUHQW FKDUDFWHULVWLFV 6R LI WKHUH LV IXUWKHU UHVHDUFK RQ WKH GDP LQIUDVWUXFWXUH DVVHVVPHQW V\VWHPLW VKRXOG EH UHYLHZHGLQ GHWDLO IRU RQH GDP WR JHW D PRUH FRPSUHKHQVLYH DVVHVVPHQW V\VWHP
&RQFOXVLRQV
7KLV VWXG\ ZDV QRW DLPHG WR SURGXFH WKH PRVW FRPSUHKHQVLYH GDP FRQGLWLRQ DQG VDIHW\ UDWLQJ%DVHG RQWKDWWKHVHDUHWKHFRQFOXVLRQV
- · 7KH GHYHORSHG PRGHO FRXOG RQO\ EH XVHG RQ K\GURSRZHU IXQFWLRQHG HPEDQNPHQW GDP ZLWKRXW DQHPHUJHQF\VSLOOZD\
- · 7KH GDP W\SH WKDW FDQ EH DFFRPPRGDWHG E\ WKLV DVVHVVPHQWLV UHVHUYRLUV ERWKWKHFRUHW\SHDQGWKH FRQFUHWHIDFHW\SH
- · 7KH FRPSOHPHQWDU\ EXLOGLQJ LV LQ WKH IRUP RI D VSLOOZD\DQGLWFDQEHXVHGRQDOOW\SHVRIVSLOOZD\
- · )URPWKHLQVWUXPHQWDWLRQ VLGH GDPVWKDW FRXOG EH DVVHVVHGZHUHRQO\GDPVZLWKSLH]RPHWHUVWDQGSLSH VOLGLQJ VWDNHV LQFOLQRPHWHUV H[WHQVRPHWHUV DQG VHLVPLFJDXJHVLQVWUXPHQWDWLRQV
$FNQRZOHGJHPHQWV
$FNQRZOHGJPHQWV DUH JLYHQ WR PDQ\ SDUWLHV ZKR SURYLGHG DVVLVWDQFH GXULQJ WKLV VWXG\
7DEOH%DVLFULVNUHFDSLWXODWLRQRI6DJXOLQJGDPDQG&LUDWDGDP
| 6DJXOLQJ'DP$VVHVVPHQW5HVXOWV | &LUDWD'DP$VVHVVPHQW5HVXOWV | |||||||
|---|---|---|---|---|---|---|---|---|
| 5LVN&ODVV | 3DUDPHWHU | 9DOXH | 3DUDPHWHU | 9DOXH | ||||
| &RQWULEXWLRQWRULVN | ||||||||
| 5HVHUYRLUFDSDFLW\PLOOLRQP | ||||||||
| 'DPKHLJKW | ||||||||
| (YDFXDWLRQUHTXLUHPHQWVQXPEHURISHRSOH | ||||||||
| 3RWHQWLDOGRZQVWUHDPGDPDJHRQWKHH[LVWLQJVWUXFWXUH | +LJK | +LJK | ||||||
| ,&2/' | %XVLQHVVULVNIRURZQHUVDVDUHVXOWRIGDPIDLOXUHDGGLWLRQDOFRQVHTXHQFHVIRU | +LJK | +LJK | |||||
| 7KHDYDLODELOLW\RIFRQVWUXFWLRQDQGPDLQWHQDQFHGDWD | +LJK | +LJK | ||||||
| $GGLWLRQDOIDFWRUVIRU | $YDLODELOLW\RILQVWUXPHQWDWLRQWKDWKDVEHHQSURFHVVHG DQGWKHREVHUYDWLRQDOGDWD | +LJK | +LJK | |||||
| H[LVWLQJGDPV RYHUFRPLQJVWUXFWXUDO | 7KHOHYHORIHIIRUWGRQHLQWKHSUHYLRXVVDIHW\HYDOXDWLRQ | +LJK | +LJK | |||||
| QHZRUFRPLQJGRZQVWUHDPGHYHORSPHQW | +LJK | +LJK | ||||||
| 7KHHIIHFWRIGHILFLHQFLHVRQGDPIDLOXUHV | ||||||||
| $GGLWLRQDOIDFWRUVIRU | 'HILFLHQFLHVUHODWHGWRIORRGFDSDFLW\ | 0RGHUDWH | 0RGHUDWH | |||||
| GHIHFWV | 'HILFLHQFLHVUHODWHGWRVWDWLFVWDELOLW\ | 0RGHUDWH | 0RGHUDWH | |||||
| 'HILFLHQFLHVUHODWHGWRHDUWKTXDNH | 0RGHUDWH | ([WUHPH | ||||||
| 'DPULVNYDOXHEDVHGRQFRQVLGHUDWLRQ | ||||||||
| 5LVN&ODVV,,,,,,,9 - 5HI3S,&2/'%XOHWLQ1R | ,,0RGHUDWH | ,,0RGHUDWH | ||||||
Acknowledgments are given to Balai Bendungan which has helped in providing secondary data during the study. Also to the Secretary of KNI-BB which has provided a lot of assistance by providing expert contacts and literature needed for study. Acknowledgments are also given to Mr. Dr. Ir. Aries Feizal Firman, Mr. Ir. Anwar Makmur and Alm. Mr. Ir. Husni Sabar, Dipl. HE as members of the KKB (Dam Safety Commission) who have provided many suggestions during the study.
7. References
- Amekudzi, A. A., Shelton, R., and Bricker, T. R. (2013). "Infrastructure Rating Tool: Using Decision Support Tools to Enhance ASCE Infrastructure Report Card Process", ASCE Journal of Leadership Management Engineering, 13 (2), 76-82.
- Andersen, G. R., Chouinard, L. E., Bouvier, C., and Back, W. E. (1999). "Ranking Procedure on Maintenance Tasks for Monitoring of Embankment Dams", ASCE Journal of Geotechnical and Geoenvironmental, 125 (4), 247-259.
- Andersen, G. R., Chouinard, L. E., Hover, W. H., and Cox, C. W. (2001). "Risk Indexing Tool to Assist in Prioritizing Improvements to Embankment Dam Inventories", ASCE Journal of Geotechnical and Geoenvironmental Engineering, 127 (4), 325-334.
- Andersen, G. R., and Torrey, V. H. (1995). "Function-based Condition Indexing for Embankments Dams", ASCE Journal of Geotechnical Engineering, 121 (4), 579-588.
- ASCE. (2013). 2013 Report Card for Washington's Infrastructure, Seattle: ASCE.
- Cabala, P. (2010): Using the Analytic Hierarchy Process in Evaluating Decision Alternatives, Operations Research and Decisions, 20, 5-23.
- Direktorat Bina Teknik. (2004). Manual Inspeksi Visual Bendungan Urugan, Departemen Pekerjaan Umum Direktorat Jenderal Sumber Daya Air, Jakarta.
- Hurley, W. J. (2001). "The analytic hierarchy process: a note on an approach to sensitivity which preserves rank order", Computers & Operations Research, 28, 185-188.
- ICOLD. (1989): Selecting seismic parameters for large dams: guidelines. bulletin No. 72, ICOLD, Paris.
- Indrawan, D., Tanjung, M. I., and Sadikin, N. (2013). "Penilaian Indeks Risiko Metode Modifikasi Andersen dan Modifikasi ICOLD untuk 12 bendungan di Pulau Jawa", Jurnal Sumber Daya Air, 9 (2), 93-104.
- Ishbaev, A., Pandjaitan, N. H., and Erizal. (2014). "Evaluasi Keamanan Dam Jatiluhur Berbasis Indeks Risiko", Jurnal Pengelolaan Sumberdaya Alam dan Lingkungan Vol. 4 No. 2, 4 (2), 111-118.
- Jansen, R. B. (1988): Advanced Dam Engineering for Design, Construction, and Rehabilitation, Van Nostrand Reinhold, New York.
- Jayadi, M. S. P., Wirahadikusumah, R. D., and Harlan, D. (2017): Pengembangan Penilaian Kondisi dan Keamanan Infrastruktur Bendungan: Sebuah Kebutuhan. Konferensi Nasional Perguuan Tinggi Teknik Sipil 2017, Bandung, Jawa Barat, Indonesia, 3 Oktober 2017, III-31.
- Komisi Keamanan Bendungan. (2003). Pedoman Inspeksi dan Evaluasi Keamanan Bendungan, Departemen Permukiman dan Prasaranan Wilayah Direktorat Jenderal Sumber Daya Air, Jakarta.
- Komisi Keamanan Bendungan. (2003). Pedoman Operasi, Pemeliharaan dan Pengamatan Bendungan, Departemen Permukiman dan Prasarana Wilayah Direktorat Jenderal Sumber Daya Air, Jakarta.
- Mersianty. (2015). "Penilaian Kondisi Bendungan Studi Kasus Bendungan Manggar", Jurnal Teknologi Terpadu No. 1 VOL. 3, 3 (1).
- PT. Indra Karya. (2011): Laporan Hasil Inspeksi Jasa Konsultansi untuk Sertifikasi Bendungan PLTA Saguling. Surabaya.
- PT. Indra Karya. (2015): Laporan Akhir Inspeksi Besar 5 Tahunan Bendungan/Underwater Inspection & Sertifikasi Kelayakan Operasi Bendungan Cirata. Surabaya.
- PT. Kwarsa Hexagon j.o. Newjec Inc. (2006): Laporan Akhir Inspeksi Besar Pekerjaan: Inspeksi Besar Bendungan Cirata, PT. Kwarsa Hexagon, Bandung.
- Purnomo, A. B. (2013). Kajian Metode Penilaian Risiko Bendungan untuk Penyusunan Prioritas Kegiatan Pemeliharaan Bendungan di Indonesia, Tesis Program Magister, Indonesia: Institut Teknologi Bandung.
- Puslitbang Sumber Daya Air. (2006). Tingkat Keamanan Bendungan di Jawa Volume III: Jawa Barat, PuslitbangSDA, Jakarta.
- Saaty, T. L., and Vargas, L. G. (2012): Models, Methods, Concepts & Applications of the Analytic Hierarchy Process 2<sup>nd</sup> edition, Springer, New York.
- Soedibyo. (1993): Teknik Bendungan, Pradnya Paramita, Jakarta.
- Sosrodarsono, S., and Takeda, K. (1989): Bendungan Type Urugan, Pradnya Paramita, Jakarta.