
Abstract
Penelitian ini dilakukan di terowongan Binungan Suaran (Kalimantan Timur, Indonesia), tepatnya pada sektor DDH2 A dan DDH3 milik PT. Berau Coal. Tujuan dari penelitian ini adalah untuk mengamati besar, arah dan laju perubahan posisi dinding terowongan stockpile batubara pada saat tonase stockpile diatasnya menurun secara signifikan. Dengan memasang empat stiker reflektor pada sektor DDH2_A dan delapan stiker reflektor pada sektor DDH3 A1, posisi tiga dimensi reflektor diamati secara berkala menggunakan total station kemudian akan digunakan untuk analisis perpindahan dan kecepatan. Ditemukan bahwa perpindahan total dinding terowongan berkisar antara 2-12 mm dengan laju tercepat 0,17 mm/hari. Didapatkan perpindahan tersebut paling besar pada komponen vertikal (Up-Down directions). Perpidahan posisi dinding ke arah atas di sektor DDH3 Al sekitar 4,29 mm hingga 6,70 mm dengan arah vektor yang cukup curam. Meskipun dua reflektor pada sektor DDH2 A menunjukkan gerakan ke bawah, sudut terjunnya kecil \((-7,77^{\circ})\) dan \(-15,85^{\circ}\)). Deformasi vertikal pada dinding tunnel stockpile batubara tersebut dianggap berasal dari fase terakhir deformasi elastis, misalnya terowongan kembali ke posisi semula setelah kehilangan beban stockpile batubara dari 146.361 ton pada 29 April 2019 menjadi 56.009 ton pada 24 Mei 2019.
Keywords: Terowongan, tonase timbunan batubara, deformasi vertikal, total station.
*Corresponding Author
1. Introduction
Suaran Terminal is one of the final coal storage owned by PT Berau Coal located in Kalimantan Timur (Adriansyah et. al., 2021). Coal that has been crushed and processed from several crushers will be stored in the stockpile at the Suaran Terminal. The coal in this terminal is ready to be shipped to the users. For the ease of distributing processed coal from the Suaran Terminal to the transport ship, PT Berau Coal built a tunnel at the Suaran Terminal. Hence, the process of coal moving from stockpile to the coal transport ship can be done more easily. First, the processed coal will be stockpiled above the tunnel and then it will be channelled to a conveyor belt inside the tunnel by opening the hopper, therefore it finally can be transported to a barge (Rachman, 2017). Thus, the workflow of coal distribution at the Suaran Terminal stockpile can run easily, safely and simply.
Stockpiled coal above the tunnel will have load of up to several hundred thousand tons which might change the dimensions of the tunnel. Therefore, monitoring the coal reclaim tunnel in Suaran is very important work to do in order to support job safety activities in the stockpile environment. A good tunnel construction does not only observe the deformation of the tunnel walls during the construction of the tunnel, but also includes the movement observation of the tunnel once it has been built (Khoshboresh, 2013).
The Suaran stockpile tunnel extends about 171 meters in an East-West direction as shown in Figure 1a in a light blue polygon. Berau Coal Ltd. makes regular observations of the reflector stickers installed on the tunnel walls (right, top, left, and conveyor legs). Figure 1b shows the cross-profile of the tunnel at DDH2_A along with the position of the reflector sticker (A1- A4). The height and width of the tunnel are about 3.5 meters and 2.6 meters, respectively. The threedimensional position (Easting, Northing, Elevation) of the reflector is observed periodically using terrestrial
surveys of reflector-less total station measurement with an observation interval of every 14 days.
Total station (TS) is an optical instrument commonly used in construction and surveying fields to measure direct angles and distances of a point (Kavanagh, 2003; Mohammad, 2019). The survey results will then be transformed to a certain coordinate system based on the previous reference point. Total stations have better accuracy for positioning in areas that have a canopy cover (trees, tunnels, buildings) (Kizil and Tisor, 2011; Idris, 2019) than the GPS survey method (Global Positioning System). Therefore, most tunnel or underground survey work is carried out using total station (TS) or terrestrial laser scanner (TLS) (Luo, 2016; Zhou et al., 2019; Yue et al., 2021) because these methods do not depend on the canopy at the area. Hakim (2016) used a total station to study tunnel stability in gold mines. Total stations are also used to monitor slope movement at open pit mining sites by installing monitoring prisms on low-walled slopes (Sulistianto et. al., 2009).
This study will examine how large and fast the tunnel deformation occurs due to the surface loads of the processed coal above the Suaran tunnel. The direction of the displacement vector is also included in the scope of this study. First, we selected days to observe tunnel deformation taking into account the coal stockpile tonnage time series data (Figure 2). Then, we calculated the displacement of the reflectors mounted on the DDH2_A and DDH3_A1 sections vertically and horizontally by subtracting the later coordinates with the previous coordinates (reference days). Finally, we analyzed the relationship between the tonnage of the coal stockpile relative to the vertical movement of the tunnel and discuss the possible physical mechanisms that cause revealed deformation.
2. Coal Stockpile Tonnage Time-Series Data
The tonnage time series data comes from the results of daily total laser-scanner measurements performed by
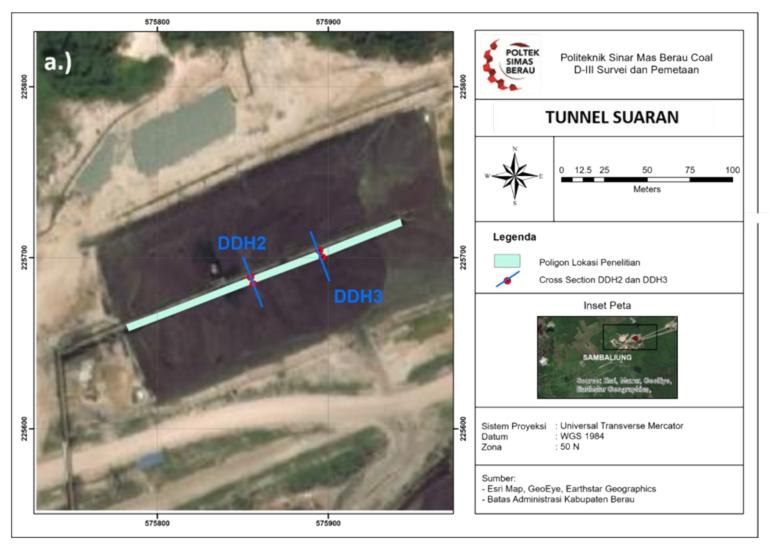
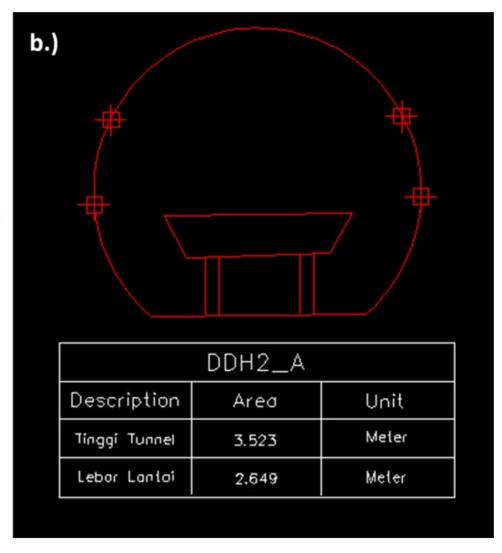
Figure 1. Map of coal reclaim tunnel in Terminal Suaran (long-section) owned by Berau Coal Ltd. in Kalimantan Timur (a) and its cross-section at DDH2_A with installed reflectors (b).
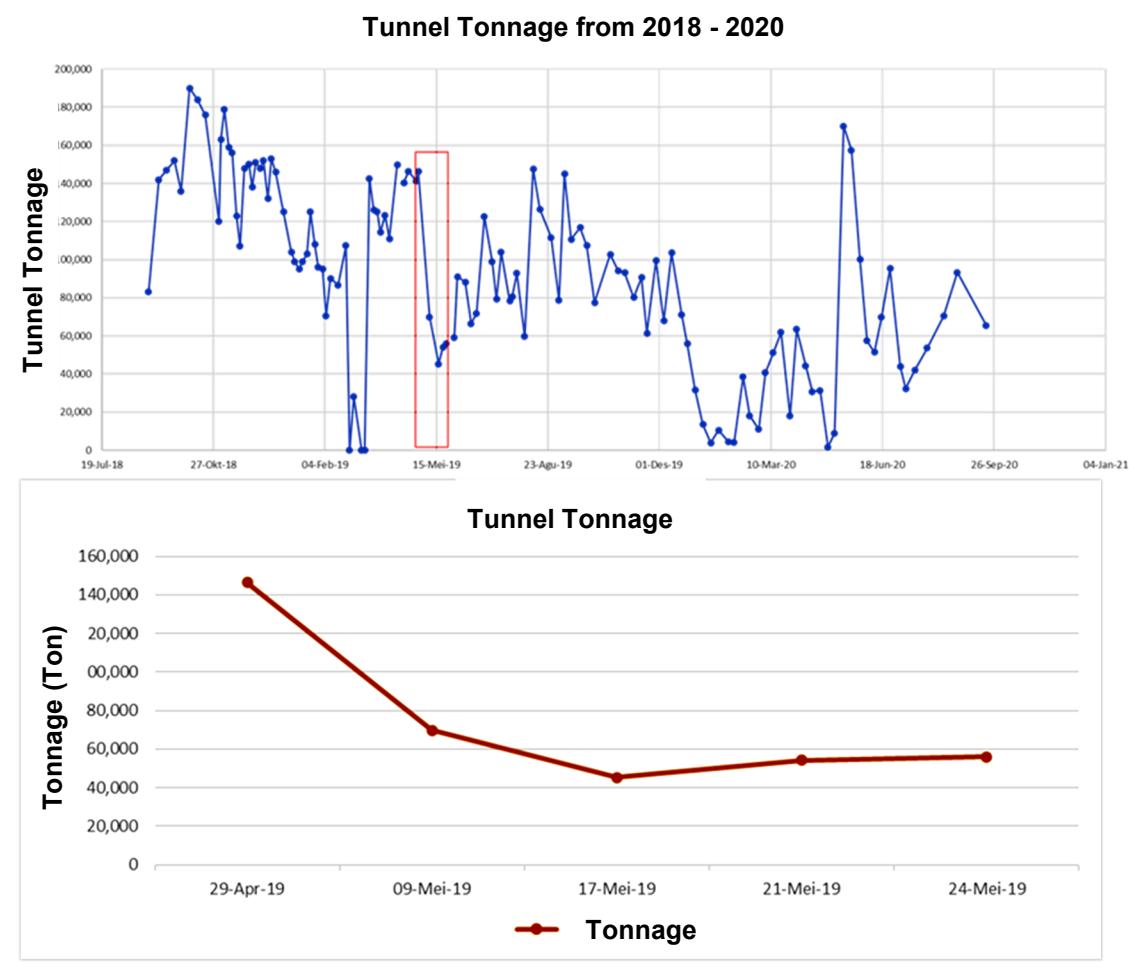
Figure 2. Stockpiled coal tonnage above tunnel Suaran from 2018-2020 (a) and from April 29th to May 24th, 2019.
Berau Coal Ltd. was used in this study as a reference in determining the observed deformation day. Figure 2a shows the coal tonnage in time-series from 2018 to 2020 (plotted following the availability of tunnel wall position data). It is clear that the highest coal load in the period was 146,361 tons on April 29th, 2019. After a couple weeks, the weight of coal decreased significantly to 56,009 tons on May 24th, 2019. A decrease of ~90,352 tons of coal occurred within 24 days. Figure 2b depicts the coal load data over the range of days to be observed (red rectangle in 2a) which is the period we are interested in.
3. Methods
In order to obtain the magnitude of the displacement in all direction components (dE, dN, dZ) of the installed reflector points, the three-dimensional position (E, N, Z) of the 12 reflector stickers as a result of 14 daily measurements by Berau Coal Ltd. is collected. The reflector position measured by the total station from April 13th, 2019 to May 24th, 2019 (E2, N2, Z2) is further subtracted (e.g. using equations 1 to 3) by the same reflector position (E1, N1, Z1) on the reference day (1st November, 2018). The total displacement (D) of the reflector point is then calculated by Equation (4).
\[dE = E_2 - E_1 \tag{1}\]
\[dN = N_2 - N_1 \tag{2}\]
\[dZ = Z_2 - Z_1 \tag{3}\]
\[D = \sqrt{dE^2 + dN^2 + dZ^2} \tag{4}\]
Here, dE, dN, dZ are deformation magnitude in eastwest, north-south, and up-down direction, respectively. In addition, to observe vertical movement of the reflector, Equation (4) will be used by ignoring the E component. The rate of total displacement (V) is also estimated by Equation (5) following method in (Muafiry, 2015), where t2 and t1 are later and former observation days.
\[D = (t_2 - t_1) V (5)\]
4. Total Displacement and Velocity
The total deformation of the four reflectors at the profile of DDH2_A and eight reflectors at the profile of DDH3_A1 are ranged from 2 mm to 12 mm as shown in Figure 3a-b. Figure 3a-3b also shows the total
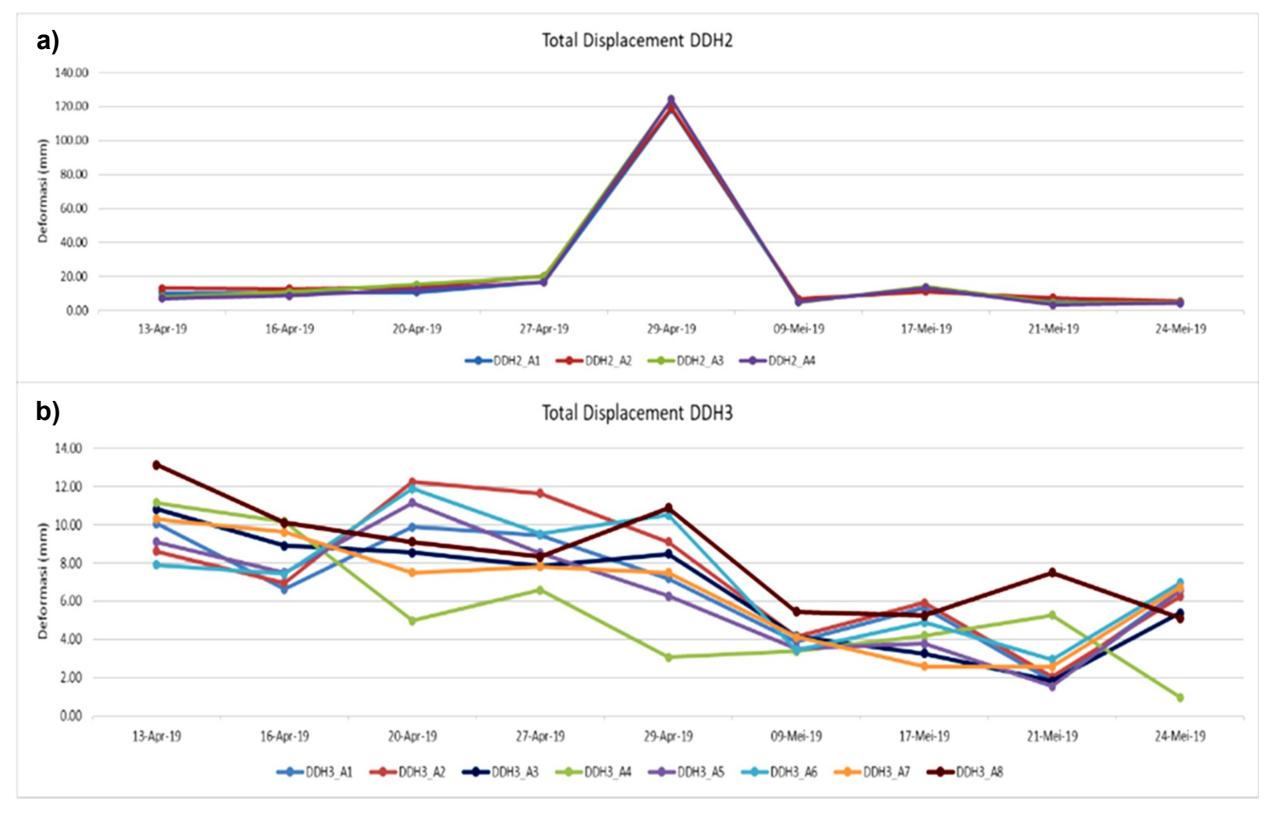
Figure 3. Total displacement of four reflectors at section DDH2_A (a) and of eight reflectors at section DDH3 (b).
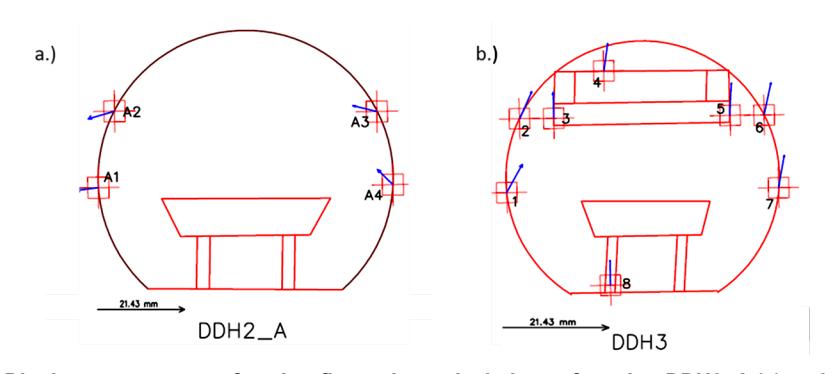
Figure 4. Displacement vector of each reflector in vertical plane of section DDH2_A (a) and DDH3 (b) on May 24<sup>th</sup>, 2019
Table 1. Vertical displacement vector
| Point | dN (mm) | dZ (mm) | D(mm) | Plunge (°) |
| DDH2_A1 | -4.14 | -0.57 | 4.18 | -7.77 |
| DDH2_A2 | -5.13 | -1.50 | 5.34 | -15.83 |
| DDH2_A3 | -4.75 | 1.18 | 4.89 | 13.92 |
| DDH2_A4 | -3.09 | 2.98 | 4.29 | 42.15 |
| DDH3_A1 | 3.13 | 5.78 | 6.57 | 61.59 |
| DDH3_A2 | 2.40 | 5.57 | 6.06 | 62.80 |
| DDH3_A3 | -0.09 | 5.30 | 5.30 | 80.01 |
| DDH3_A4 | 0.70 | 5.62 | 5.66 | 80.20 |
| DDH3_A5 | 0.29 | 6.53 | 6.53 | 84.15 |
| DDH3_A6 | 1.34 | 6.57 | 6.70 | 70.72 |
| DDH3_A7 | 1.05 | 6.57 | 6.65 | 78.18 |
| DDH3_A8 | -0.15 | 5.03 | 5.02 | 79.49 |
deformation in the previous two epochs from April 29<sup>th</sup>, 2019 to see the stability of the data. As a result, an outlier was found on April 29<sup>th</sup>, 2019 in the DDH2_A sector (Figure 3a) which may have occurred due to an error during the survey using the total station (for example centering error when the instrument was not exactly centered above the benchmark point properly). By using formula (5) and the day difference information of the coal tonnage decrease (e.g. decrease of ~90,352 tons of coal occurred within 24 days), the deformation rate can be obtained after the total deformation is calculated. Based on the calculation, the fastest deformation speed is 0.17 mm/day on the reflector DDH3_A4, while the slowest is found at DDH3 A6 with a rate of 0.02 mm/day.
Figure 5. Possible phases of elastic deformation of coal stockpile tunnel. Black curve corresponds to tunnel current position and orange dashed curve is the previous one.
By analyzing the three-dimensional position of the reflectors (total deformation in all directional components), we had some difficulties in studying the effect of embankment weight on tunnel deformation. Therefore, to be able to detect such movement on the tunnel more clearly, the deformation in the vertical direction component (north-south and top-bottom) will be analyzed because the surface load will tend to move parallel to the direction of gravity (drifting vertically). The next section will discuss about the vertical movement of the tunnel.
5. Vertical Movement and its Correlation with Coal Tonnage
In this section we focus on the vertical deformation of the tunnel to clearly see its correlation with the tonnage of the coal stockpile above the tunnel. The north-south/ up-down displacement of the eight reflector stickers on the last day (24 May 2019) is calculated by formula (4) and summarized in Table 1. The result is that the points DDH2_A1 and DDH2_A2 move slightly down in the range of 4.18 mm to 5.34 mm for each reflector. For the rest observed reflectors, they all move up in a range of 4.29 mm to 6.70 mm, with a vertical angle ranging from 13.99° to 43.98° for DDH2_A and 61.59° to 88.99° for DDH3 A. The reflector displacement vector for DDH2 A and DDH3 are shown in Figures 4a and 4b. Interestingly, the majority of them move up and only two reflectors move slightly down. We assume such upward movement comes from the decrease of weight of the processed coal above the tunnel as shown in Figure 2b. In other word, there is possibility that it reflects the last stage of elastic response of the tunnel to the stockpile tonnage (Figure 5), where tunnel moves upward because it has less surface load.
6. Conclusion
Here we summarize this study as follows:
1. The tonnage of the stockpiled coal located above the Suaran Tunnel was significantly decrease by ~90,352
- tonnes from April 29th, 2019 to May 24th, 2019 (24
- 2. We investigated the deformation of the Suaran tunnel during this period and found an upward motion (expansion) on the tunnel's wall ranging from 4.29 mm to 6.70 mm at the sections of DDH3 and DDH2 A. The total displacement of the reflector in these two sections ranges from 0.02-0.17 mm.
- 3. We consider the up-lifting of the tunnel wall is corresponding to the last stage of the elastic deformation of the coal reclaim tunnel in response to the reduced tonnage of the stockpiled coal above. Obviously, further investigation is needed to confirm the second stage of coal reclaim tunnel elastic deformation shown in Figure 5, for example focusing deformation after the coal tonnage increase dramatically.
Disclosure statement
No potential conflict of interest was reported by the author(s) and the draft paper has not been published previously by another publication.
Data availability statement
Data supporting the findings of this study are available from the corresponding author SK on request.
Acknowledgments
The authors thank to Berau Coal Energy Ltd. for providing reflector position data measured by total station and the coal tonnage data above tunnel.
References
Adriansyah, Y., Krisnantara, G., Setiadi, K., (2021). Point Load Index Correlation and Uniaxial Compressive Strength in Sandstone and Claystone Units for Determining the Coefficient of Rock Strength at Pit X Coal Mine of PT Berau
- Coal, East Kalimantan. Geomine Journal, 9(1): 9-16. DOI:https://doi.org/10.33536/jg.v9i1.822.
- Hakim, R. N. (2016). Monitoring Deformasi Dinding Dan Atap Terowongan Tambang Emas Bawah Tanah Menggunakan Total Station Reflektorless. Universitas Lambung Mangkurat. Banjarmasin.
- Kavanagh, B. F. (2003). Surveying Principles and Applications Sixth Edition. New Jersey: Pearson Education Inc.
- Kizil, U. and Tisor, L. (2011). Evaluation of RTK-GPS and Total Station for Applications in Land Surveying. Journal of Earth System Science, vol. 120, no. 2. Edited by S. R. Shetye (Indian Academy of Science, Bengaluru, 2011), pp. 215 -221.
- Khoshboresh, A. R. (2013). A Study on Deformation of Tunnels Excavated in Fractured Rocks. Universite Laval. Canada.
- Luo, Y., Chen, J., Xi, W., Zhao, P., Qiao, X., Deng, X., Liu, Q. (2016). Analysis of Tunnel Displacement Accuracy with Total Station, in Measurement 83, edited by P. Carbone (Elsevier Ltd, Amsterdam, 2016), pp. 29-37.
- Muafiry, I. N. (2015). Analysis of Deformation Due to the Mentawai Earthquake Using Continuous GPS (Case Study: Mentawai Earthquake in 2008). Institut Teknologi Sepuluh November, Surabaya
- Mohammad I. (2019), Evaluation of GPS-RTK and Total Station for Topographic Survey and Strategic Decision in Private Companies. The 1st International Conference on Geodesy, Geomatics, and Land Administration 2019, KnE Engineering, pages 323--332. DOI 10.18502/keg.v4i3.5874
- Rachman, F. (2017). Environmental Risk Assessment of Coal Loading in Lubuk Tutung Kalimantan Timur Coal Terminal. Institut Teknologi Sepuluh November, Surabaya
- Sulistianto, B. (2009). Deformation Monitoring at Low -Wall Slope of Coal Open Pit in PT. Adaro, Indonesia. 2nd International Symposium of Novel Carbon Resource Science – ITB.
- Yue, Z., Sun, H., Zhong, R., Du, L. Method for Tunnel Displacements Calculation Based on Mobile Tunnel Monitoring System. Sensors 2021, 21, 4407. https:// doi.org/10.3390/s21134407
- Zhou J., H. Xiao, W. Jiang, W. Bai, G. Liu, Automatic Subway Tunnel Displacement Monitoring Using Robotic Total Station, Measurement (2019),
doi: https://doi.org/10.1016/j.measurement. 2019.10725 doi : https://doi.org/10.1016/ j.measurement. 2019.10725