
Abstrak
Gagasan untuk membangun Jembatan Selat Sunda (JSS) dimulai pada masa pemerintahan presiden pertama Indonesia, Sukarno, yang menghubungkan dua pulau dengan ekonomi terbesar di Indonesia, Pulau Sumatera dan Pulau Jawa. Proyek ambisius ini akan menjadi mega proyek infrastruktur tunggal dengan investasi terbesar di Indonesia. Keberhasilan penyelesaian suatu proyek dapat dikaitkan dengan penyelesaian proyek tepat waktu. Perhitungan yang akurat dari estimasi durasi waktu proyek adalah kunci keberhasilan penyelesaian suatu proyek infrastruktur tepat waktu. Banyak praktisi di industri konstruksi saat ini mengalami kesulitan untuk memperkirakan durasi proyek dengan benar. Memilih metode yang tepat dalam perencanaan penjadwalan adalah kunci keberhasilan estimasi suatu proyek. Penelitian ini mengusulkan penggunaan metode penjadwalan M-PERT yang merupakan pengembangan dari PERT konvensional dengan tingkat akurasi yang lebih tinggi. Sebagai studi kasus, penelitian ini menggunakan bagian Jembatan Gantung yang merupakan salah satu bagian dari keseluruhan tahapan pembangunan proyek infrastruktur JSS. Hasil dari penelitian ini menghasilkan estimasi durasi proyek dengan menggunakan M-PERT adalah 2104,38 hari. Ini memberikan kesalahan estimasi kurang dari 1% jika dibandingkan dengan kurva yang disimulasikan. Sebagai perbandingan, penelitian ini juga menghitung estimasi durasi menggunakan PERT konvensional dan memberikan 2013 hari dengan error lebih dari 24% jika dibandingkan dengan kurva simulasi. Proses langkah demi langkah untuk memperkirakan durasi proyek menggunakan metode M-PERT diberikan dalam data tambahan.
Kata-kata Kunci: Jembatan Selat Sunda, kurva simulasi, M-PERT, penjadwalan, PERT
*Corresponding Author
1. Introduction
The Sunda Strait Bridge, or known as Jembatan Selat Sunda (JSS) is one of the major projects in the construction of bridges that cross the Sunda Strait as a link between Java Island and Sumatra Island. This bridge originated from the idea of Prof. Sedyatmo, a professor at the Bandung Institute of Technology (ITB) in 1960 was called Tri Nusa Bimasakti which means a link between three islands; Sumatra Island, Java Island and Bali Island. Then, in 1965 Sukarno as the first president of the Republic of Indonesia ordered ITB to conduct a trial design of the link in which the results of the experiment were in the form of a tunnel. In the course of history, feasibility studies that have been carried out for the Sunda Strait crossing include studies conducted by Japan International Cooperation Agency (JICA) together with the Ministry of Public Works (PU) in 1992, by Pakarti Trimitra Group in the year 1996 and by Prof. Dr. Ir. Wiratman Wangsadinata for the Agency for the Assessment and Application of Technology (BPPT) in 1997 (Wangsadinata, 2013). After a review, it was found that the connection through a bridge was more feasible compared to the link with a tunnel under the sea floor (Wangsadinata, Essen, & Guntorojati, 2011). At present, Indonesia's economic activities are concentrated on two big islands, Sumatra Island and Java Island, which are connected by ferry crossings of PT. ASDP Merak and Bakauheni. With the increasing cases of congestion occurring in the ports of Merak and Bakauheuni, a new solution is needed to overcome the problem of congestion, namely by building a Sunda Strait Bridge that connects Java Island and Sumatra Island (Husin, 2015).
There have been many studies that have discussed the JSS. Wangsadinata, et al. (2011) discuss about the characteristics of the structure of the JSS ultra long suspension bridge (Wangsadinata et al., 2011). An economic approach also enriches the discussion of JSS, such as a discussion of the strategic alliance model in public and private partnerships in value engineering-based mega infrastructure projects to increase the value of project feasibility (Husin, 2015). The JSS development process has a lot of risks so it requires proper and comprehensive risk identification (Karim, 2017). A study using the Stated Preference approach was used to determine the choice of use of the trajectory to be used to cross the Sunda Strait between Java Island in Merak and Sumatra Island in Bakauheni. This study shows that the majority of respondents prefer to use JSS compared to using a ferry for the Sumatra-Java crossing because the crossing time is much faster (Maysyaroh & Joewono, 2014).
From many articles that discuss JSS, there are only a few or even no one discussing planning scheduling in the construction phase of JSS development. A largescale project such as the JSS mega project requires an appropriate scheduling plan. In the construction industry, scheduling plays an important role because it regulates the time and sequence of various activities, the interrelationships between one activity and other activities (Kholil, Alfa, & Hariadi, 2018). This research is important because this research is the first to discuss scheduling planning in JSS development.
The schedule is the elaboration of project planning into the sequence of steps to carry out the work to achieve the target. The schedule has included a time factor (Kusnanto, 2010). There are several scheduling methods in construction, such as Critical Path Method (CPM), Program Evaluation and Review Technique (PERT) (Setiawati, Syahrizal, & Ariessa, 2012), (Caesaron & Thio, 2015), (Kumar, 2009), Precedence Diagramming Method (PDM) (Hajdu, 2017), (D. Wiest, 1981), Line of Balance (Siddesh, Preeti, & Shweta, 2013) and Ranked Position Weight Method (RPWM) (Suputra, 2011).
One method of scheduling that is quite extensive in use is the Program Evaluation and Review Technique (PERT). This PERT method is a scheduling method based on statistics and probabilities. This method can help to solve problems that arise on CPM as if there were adjustments or changes in time in one of the activities. In PERT, the duration of each activity is assumed to be stochastic with certain characteristics, in other words, the duration of each activity has a certain mean and standard deviation in which there is uncertainty (Habibi, Taghipour Birgani, Koppelaar, & Radenović, 2018). Not only for time estimation, Asmar et al. (2011), develop a PERT-type technique to estimate cost in a project. They were using some highway projects as case study (Asmar, Hanna, & Whited, 2011).
However, despite the popular use of PERT, this method has several shortage. Ballesteros-Perez et al. (2018) stated in their research that original PERT significantly underestimated the duration average and overestimated the duration variance of real-life projects. Original PERT also stated that this method follow Beta distribution, which is not, in real-life project (Ballesteros-Pérez, Larsen, & Gonzales-Cruz, 2018). To overcome this shortcoming, Ballesteros-Perez (2017) propose a new reformulated PERT, named M-PERT, Manual Program Evaluation and Review Technique. The M-PERT method is much more accurate in determining the actual duration of the project and it is also easier and simpler because it does not require the assistance of certain simulation software in its calculations (Ballesteros-Pérez, 2017).
To further emphasize the accuracy of this M-PERT method, this research compares it with the calculation of the estimated duration of the project using original PERT method.
Furthermore, in this research, what was meant by JSS development work was narrowed down to the construction of a Suspension Bridge of the JSS.
2. Methodology
In making this M-PERT method, it still requires the same working steps as for making the PERT method, with some additional variations.
2.1 Define activities
The first step in making project scheduling is to develop the list of tasks to create what is known as a work breakdown structure (WBS) (Kumar, 2009). The WBS is a hierarchical representation of the work contents, whereby the project is progressively subdivided into smaller units (Ibrahim, Kaka, Aouad, & Kagioglu, 2009). The division of work in the WBS into a lower level must be in accordance with the characteristics of each job. This level must not be too detailed, because it will reduce flexibility and may not be too little because it will be difficult to control it (Shi, Zheng, & Wei, 2010).
WBS in the construction phase of the Jembatan Selat Sunda (JSS), divided into 3 major sections, namely Foundation, Substructure, and Superstructure. The detail level used in making this WBS is up to level four..
2.2 Determine the proper sequence of the activities
Each activity in the construction process above is related to each other. For each activity, it is necessary to know whether there are other activities that must be done before starting the activity (predecessor).
In the construction of this JSS, relationships between activities are described in table form.
2.3 Construct a network diagram
Project network diagrams are graphical representations of all activities contained in WBS and workflows for a project. This diagram looks like a chart with a series of boxes and arrows that are used to map the schedule and sequence of work of a project, and track its progress through each stage, up to and including completion.
MS-Project software and MS-Visio software are used to assist making a network diagram for construction phase in this JSS project
2.4 Estimate the time required for each activity
At this stage, the information needed is to estimate the duration of each activity, in this case is to estimate the duration of each activities of the JSS construction phase. In addition to calculating the duration of each activity, this stage also calculates the standard deviation or standard deviation of each of these activities as well.
For each activity in original PERT method, the model usually includes three-point estimates (Kumar, 2009):
- 1. Optimistic time (O) generally the shortest time in which the activity can be completed
- 2. Most likely time (L) the completion time having the highest probability
- 3. Pessimistic time (P) the longest time that an activity might require
PERT assumes a beta probability distribution for the time estimates. The mean duration (µ) for each activity expression will be:
\[\mu = (0 + 4L + P)/6 \tag{1}\]
And the standard deviation \(\sigma\) for each activity expression:
\[\sigma = (P - O)/6 \tag{2}\]
After calculating each duration activity then proceed to calculate project duration activity/total duration. Project duration mean \((\mu_n)\) and project standard deviation \((\mu_n)\).
\[\mu_p = \sum_{i \in critical \ pat \ h} \mu_i \tag{3}\]
\[\sigma_p = \sqrt{\sum_{i \in critical \ pat \ h} \sigma_i} \tag{4}\]
Herrerias-Velasco et al. (2010) review the mean and variance original expression for PERT and have a conclusion that retaining the original mean expression but correct the variance with correction factor \(C\delta\)(Herrerías-Velasco, Herrerías-Pleguezuelo, & Van Dorp, 2011).
\[\sigma = \sqrt{C(\delta) \times \frac{(P - 0)^2}{36}} \tag{5}\]
\[C(\delta) = \frac{5}{7} + \frac{16}{7} \times \delta(1 - \delta) \in \begin{bmatrix} 5 & 9\\ 7 & 7 \end{bmatrix}\] (6)
\[\delta = \frac{L - O}{P - O}, \delta \in [0, 1] \tag{7}\]
All the variance in this research using this correction
Finally, because PERT is a probabilistic model, the result will be probability of project finished within X days. The probabilities of ending a project in X days could be look up in the cumulative probability value of z in a standard normal table
\[z = \frac{X - \mu_p}{\sigma_p} \tag{8}\]
2.5 Merge process in M-PERT method
Basically, the M-PERT method is a method for combining two or more activities into only a single activity. This process is done repeatedly until there is only one activity left, which represents the total duration of the project. There are four merge operations in M-PERT, (1) Merge for Serial Activities, (2) Merge for Probabilistic (alternative) paths, (3) Self-loops, and (4) (maximum or minimum) Parallel paths (Ballesteros-Pérez, 2017).
On the M-PERT scheduling method used in this JSS project only two operations are used, serial activities merge, mean project duration (exp. 9) and variance project duration (exp.10), and (maxima) parallel paths merge, mean project duration (exp.11) and variance project duration (exp.12)
\[\mu_k = \sum_{x = i, i = n} \mu_x \tag{9}\]
\[\sigma_k^2 = \sum_{x=i,j,\dots,n} \sigma_x^2 \tag{10}\]
\[\mu_k = \mu_i \phi(\delta) + \mu_i (1 - \phi(\delta)) + \theta \varphi(\delta) \tag{11}\]
\[\sigma_k^2 = \left(\sigma_i^2 + \mu_i^2\right) \Phi(\delta) + \left(\sigma_j^2 + \mu_j^2\right) \left(1 - \Phi(\delta)\right) + \left(\mu_i + \mu_j\right) \theta \varphi(\delta) - \mu_k^2\] (12)
Where \(\mu_k\) is mean project duration and \(\sigma_k^2\) is variance project duration. \(\varphi(\delta)\) is Probability Density Function (PDF) and \(\varphi(\delta)\) is Cumulative Distribution Function (CDF) from standard normal distribution.
The procedure for making JSS project scheduling using the M-PERT method in the form of a flow diagram can be seen in Figure 1.
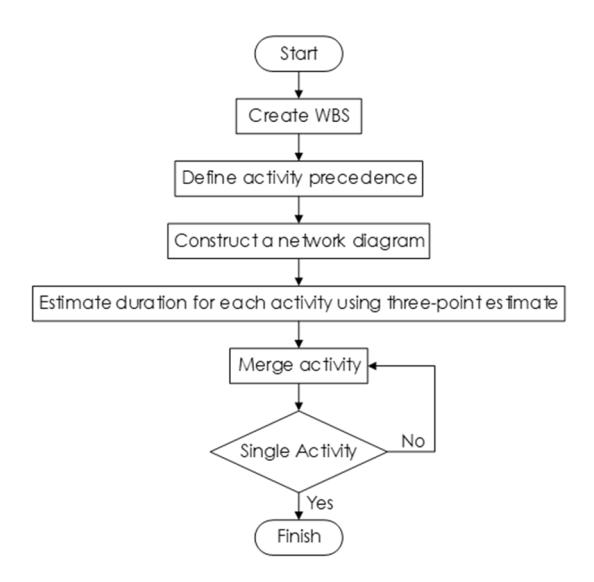
Figure 1. M-PERT procedures for JSS project
3. Results and Discussion
3.1 Create WBS for JSS project
The WBS on the JSS project was made to find out what activities are involved in the construction of suspension bridges at JSS and made up to level four. This level is sufficient for flexibility and ease of scheduling, not too detailed but also not too few.
This WBS uses codes in the form of numbers that indicate the level and types of activities and divide into three types of major work:
- 1. Foundation (see Table 1)
- 2. Substructure (see Table 2)
- 3. Superstructure (see Table 3)
Foundation work (level 2) consists of four types of work (level 3):
1. Pylon 1 Caisson Foundation
Table 1. WBS for foundation work
WBS
| 441 | ЬЗ | Work Item | |
|---|---|---|---|
| 2 | 3 | 4 | vvork item |
| SUNDA STRAIT SUSPENSION BRIDGE | |||
| 1 | FOUNDATION | ||
| 1 | Pylon 1 Caisson Foundation | ||
| 1 | Dry dock construction and caisson fabrication | ||
| 2 | Preparation of caisson base | ||
| 3 | Caisson mobilization and installation | ||
| 4 | Caisson concrete casting and curing | ||
| 5 | Construction of scouring protection and finishing | ||
| 2 | Pylon 2 Caisson Foundation | ||
| 1 | Dry dock construction and caisson fabrication | ||
| 2 | Preparation of caisson base | ||
| 3 | Caisson mobilization and installation | ||
| 4 | Caisson concrete casting and curing | ||
| 5 | Construction of scouring protection and finishing | ||
| 3 | Anchorage Block 1 Caisson Foundation | ||
| 1 | Dry dock construction and caisson fabrication | ||
| 2 | Preparation of caisson base | ||
| 3 | Caisson mobilization and installation | ||
| 4 | Caisson concrete casting and curing | ||
| 5 | Construction of scouring protection and finishing | ||
| 4 | Anchorage Block 2 Caisson Foundation | ||
| 1 | Dry dock construction and caisson fabrication | ||
| 2 | Preparation of caisson base | ||
| 3 | Caisson mobilization and installation | ||
| 4 | Caisson concrete casting and curing | ||
| 5 | Construction of scouring protection and finishing | ||
| ů ů |
Table 2. WBS for substructure work
| WBS | Work Item | |||||||
|---|---|---|---|---|---|---|---|---|
| 1 | 2 | 3 | 4 | WOLK IGHII | ||||
| 1 | SUNDA STRAIT SUSPENSION BRIDGE | |||||||
| 2 | SUB-STRUCTURE | |||||||
| 1 | Pylon 1 | |||||||
| 1 | Pylon segment fabrication | |||||||
| 2 | Pylon segment mobilization and installation | |||||||
| 3 | Installation of saddle, damper and finishing | |||||||
| 2 | Pylon 2 | |||||||
| 1 | Pylon segment fabrication | |||||||
| 2 | Pylon segment mobilization and installation | |||||||
| 3 | Installation of saddle, damper and finishing | |||||||
| 3 | Anchor Block 1 | |||||||
| 1 | Installation of formwork, reinforcement and casting preparation | |||||||
| 2 | Anchor block concrete casting | |||||||
| 3 | Curing and finishing | |||||||
| 4 | Anchor Block 2 | |||||||
| 1 | Installation of formwork, reinforcement and casting preparation | |||||||
| 2 | Anchor block concrete casting | |||||||
| 3 | Curing and finishing | |||||||
Table 3. WBS for superstructure work
| WBS | |||||
|---|---|---|---|---|---|
| 1 | 2 | 3 | 4 | Work Item | |
| 1 | SUNDA STRAIT SUSPENSION BRIDGE | ||||
| 3 | Superstructure | ||||
| 1 | Main Cable and Hanger Cable | ||||
| 1 Preparation and fabrication of PPWS strand | |||||
| 2 Installation of hauling cable and catwalk | |||||
| 3 Sequential erection of PPWS strand | |||||
| 4 Compaction, wrapping and adjustment of Main Cable | |||||
| 5 Installation of clamp and hanger | |||||
| 2 | Bridge deck / girder | ||||
| 1 Dry dock construction and fabrication preparation | |||||
| 2 Cross beam segment fabrication | |||||
| 3 Main girder segment fabrication | |||||
| 4 Installation of lifting device / crane, and scaffolding | |||||
| 5 Installation of cross beam to hanger | |||||
| 6 Erection of girder segment | |||||
| 7 Connection of girder segment and adjustment | |||||
| 3 | Finishing and Equipment Installation | ||||
| 1 Bearing installation at Pylon and Anchor Block | |||||
| 2 Damper and monitoring sensor | |||||
| 3 Railway track installation | |||||
| 4 Road pavement and finishing | |||||
| 4 | Inspection, testing and commissioning | ||||
Table 4. Precedence for pylon 1 caisson foundation
| 1.1 | Foundation | |
|---|---|---|
| 1.1.1 | Pylon 1 Caisson Foundation | |
| Activity Code | Activity Description | Predecessor |
| 1.1.1.1 | Dry dock construction and caisson fabrication | - |
| 1.1.1.2 | Preparation of caisson base | - |
| 1.1.1.3 | Caisson mobilization and installation | 1.1.1.1, 1.1.1.2, 1.1.2.1, 1.1.2.2, 1.1.3.1, 1.1.3.2, 1.1.4.1, 1.1.3.2 |
| 1.1.1.4 | Caisson concrete casting and curing | 1.1.1.3 |
| 1.1.1.5 | Construction of scouring protection and finishing | 1.1.1.4 |
- 2. Pylon 2 Caisson Foundation
- 3. Anchorage Block 1 Caisson Foundation
- 4. Anchorage Block 2 Caisson Foundation
3.2 Define activity precedence
In JSS development work, activity precedence is divided into each level three and the precedence type would be Finish-to-Start (FS)
3.3 Construct network diagram
In this research the type of network diagram used is Activity-On-Node (A-O-N) where a node represents an activity. The use of A-O-N is because it is easier to understand and also the MS-Project software uses A-O-N. Some dummy node used to avoid unnecessary arc cross over. There is some time lag used to match the start time of the node in diagram.
Complete network diagram attached in Supplemental Data because of the limitations of paper length.
3.4 Estimate duration for each activity
The estimated calculation of the duration of each JSS development activity is carried out by a bridge construction expert. Table 5 shows information about the duration and standard deviation of each activity.
Table 5 shows Optimistic Time (O), Most-Likely Time (L), Pessimistic Time (P), Expected Time or Mean duration (mi), and Standard deviation (si). All unit represented in days. In standard deviation column, there are two columns, before correction (exp. 2) and after correction (exp 5) and all after correction standard deviation have bigger value than before adding correction. All next calculation for M-PERT will use standard deviation after correction. There are repetition in Foundation work (Pylon 1, Pylon 2, Anchor Block 1, and Anchor Block 2), Substructure work (Pylon 1 and Pylon 2) and Substructure work (Anchor block 1 and Anchor block 2) and the table is simplified with X mark in activity code
3.5 Merge activity for M-PERT
This M-PERT method use only A-O-N networks with Finish-Start (FS) precedence relationships. Those wishing to establish different types of precedence (Start -Start (SS), Finish-Finish (FF) and Start-Finish (SF) should refer to Ballesteros-Perez (2017) (Ballesteros-Pérez, 2017) or to Lu and Lam's (2009) (Lu & Lam, 2009) comprehensive treatment of non-FS relationships in project networks, and convert them into FS relationships.
M-PERT merge activity for JSS work applied in serial and (maxima) parallel path. Seven steps were used to reduce all activity into one merge activity, with four steps of serial activity merge and three (maxima) parallel path merge activity.
Step-by-step process to reduce this network diagram into single merge activity will be attached in Supplemental Data. Final single merge activity show in Figure 2
3.6 Comparison between original PERT and M-PERT
For comparison, in this research the accuracy of the M-PERT scheduling method was compared with the original PERT scheduling method.
Table 5. Duration and standard deviation of each activity
| Standard Deviation (si) | |||||||
|---|---|---|---|---|---|---|---|
| Activity Code | Activity Description | O (days) | L (days) | P (days) | mi (days) | Before Correction (days) | After Correction (days) |
| 1.1 | FOUNDATION | ||||||
| 1.1.X.1 | Dry dock construction and caisson fabrication | 324 | 360 | 432 | 366 | 18 | 19.9 |
| 1.1.X.2 | Preparation of caisson base | 162 | 180 | 216 | 183 | 9 | 9.9 |
| 1.1.X.3 | Caisson mobilization and installation | 81 | 90 | 108 | 91.5 | 4.5 | 5.0 |
| 1.1.X.4 | Caisson concrete casting and curing | 162 | 180 | 216 | 183 | 9 | 9.9 |
| 1.1.X.5 | Construction of scouring protection and | 81 | 90 | 108 | 91.5 | 4.5 | 5.0 |
| 1.2 | SUBSTRUCTURE | ||||||
| 1.2.X | Pylon | ||||||
| 1.2.X.1 | Pylon segment fabrication | 324 | 360 | 432 | 366 | 18 | 19.9 |
| 1.2.X.2 | Pylon segment mobilization and installation | 405 | 450 | 540 | 457.5 | 22.5 | 24.9 |
| 1.2.X.3 | Installation of saddle, damper and finishing | 81 | 90 | 108 | 91.5 | 4.5 | 5.0 |
| 1.2.X | Anchor Block | ||||||
| 1.2.X.1 | Installation of formwork, reinforcement and | 162 | 180 | 216 | 183 | 9 | 9.9 |
| 1.2.X.2 | Anchor block concrete casting | 243 | 270 | 324 | 274.5 | 13.5 | 14.9 |
| 1.2.X.3 | Curing and finishing | 81 | 90 | 108 | 91.5 | 4.5 | 5.0 |
| 1.3 | SUPERSTRUCTURE | ||||||
| 1.3.1 | Main Cable and Hanger Cable | ||||||
| 1.3.1.1 | Preparation and fabrication of PPWS strand | 162 | 180 | 216 | 183 | 9 | 9.9 |
| 1.3.1.2 | Installation of hauling cable and catwalk | 81 | 90 | 108 | 91.5 | 4.5 | 5.0 |
| 1.3.1.3 | Sequential erection of PPWS strand | 243 | 270 | 324 | 274.5 | 13.5 | 14.9 |
| 1.3.1.4 | Compaction, wrapping and adjustment of Main | 135 | 150 | 180 | 152.5 | 7.5 | 8.3 |
| 1.3.1.5 | Installation of clamp and hanger | 54 | 60 | 72 | 61 | 3 | 3.3 |
| 1.3.2 | Bridge deck / girder | ||||||
| 1.3.2.1 | Dry dock construction and fabrication | 81 | 90 | 108 | 91.5 | 4.5 | 5.0 |
| 1.3.2.2 | Cross beam segment fabrication | 405 | 450 | 540 | 457.5 | 22.5 | 24.9 |
| 1.3.2.3 | Main girder segment fabrication | 405 | 450 | 540 | 457.5 | 22.5 | 24.9 |
| 1.3.2.4 | Installation of lifting device / crane, and | 81 | 90 | 108 | 91.5 | 4.5 | 5.0 |
| 1.3.2.5 | Installation of cross beam to hanger | 81 | 90 | 108 | 91.5 | 4.5 | 5.0 |
| 1.3.2.6 | Erection of girder segment | 162 | 180 | 216 | 183 | 9 | 9.9 |
| 1.3.2.7 | Connection of girder segment and adjustment | 81 | 90 | 108 | 91.5 | 4.5 | 5.0 |
| 1.3.3 | Finishing and Equipment Installation | ||||||
| 1.3.3.1 | Bearing installation at Pylon and Anchor Block | 162 | 180 | 216 | 183 | 9 | 9.9 |
| 1.3.3.2 | Damper and monitoring sensor | 81 | 90 | 108 | 91.5 | 4.5 | 5.0 |
| 1.3.3.3 | Railway track installation | 81 | 90 | 108 | 91.5 | 4.5 | 5.0 |
| 1.3.3.4 | Road pavement and finishing | 81 | 90 | 108 | 91.5 | 4.5 | 5.0 |
| 1.3.4 | Inspection, testing and commissioning | 81 | 90 | 108 | 91.5 | 4.5 | 5.0 |
From the calculation results, the estimated duration of construction of the JSS suspension bridge by the PERT method is 2013 days with a standard deviation of 39.14 days, while the M-PERT method is 2103.76 days and the standard deviation is 25.9 days.
Figure 3 shows three curves, dashed curve is M-PERT curve, grey curve is PERT curve and black bold curve show the exact solution of project duration distribution (obtained through computer simulations) by modeling activity durations with normal distributions.
The average (project duration) of simulated distribution is 2098.08 days and this simulated distribution used as reference. The JSS project duration mean using M-PERT method when compared to simulated distribution mean gives estimation error less than 1% (0.14%) while compare project duration mean using PERT method with simulated distribution mean gives estimation error 27.59%. This shows how inaccurate the calculation of the mean duration is if it uses the original PERT method because it only focuses on the critical path and ignores other parallel paths.
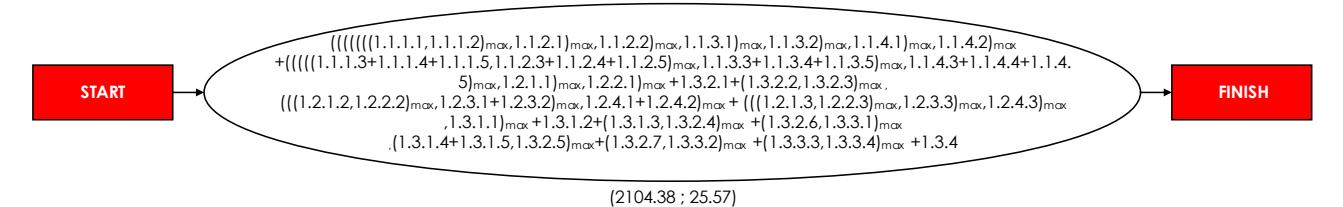
Figure 2. M-PERT final single merge for JSS work
3.7 Supplemental data
All precedence activity, PERT network diagram and step -by-step M-PERT merge activity are available in supplemental data attached with this paper.
4. Conclusion
- 1. The construction of infrastructure projects in the Sunda Strait Bridge (Jembatan Selat Sunda, JSS) requires an accurate time estimation plan.
- 2. The original PERT method cannot afford it because it only focuses on the critical path, ignores other activity, underestimated project duration and overestimated variance.
- 3. The development of PERT method into M-PERT is done to overcome this. The estimation error of the M-PERT method for estimating the duration of construction of the Sunda Strait Suspension Bridge is less than 1% compared to the original PERT method which is above 27% proves that the M-PERT method successfully overcomes the shortcoming of the PERT
- 4. The M-PERT method is also quite simple in its calculations so it is enough just to use spreadsheet software without special software for calculating the duration of the project.
5. Acknowledgement
This research is fully supported by Mercu Buana University Internal Research Grant, No: 02-5/00049/B-SPK/II/2019. The authors fully acknowledged Mercu Buana University for the approved fund which makes this important research viable and effective.
Daftar Pustaka
Asmar, M. El, Hanna, A. S., & Whited, G. C. (2011). New Approach to Developing Conceptual Cost Estimates for Highway Projects. Journal of Construction Engineering and Management, 137 942–949. https://doi.org/10.1061/(asce) co.1943-7862.0000355
Ballesteros-Pérez, P. (2017). M-PERT: Manual Project-Duration Estimation Technique for Teaching Scheduling Basics. Journal of Construction Engineering and Management, 143(9), 04017063. https://doi.org/10.1061/(ASCE)CO.1943-7862.0001358
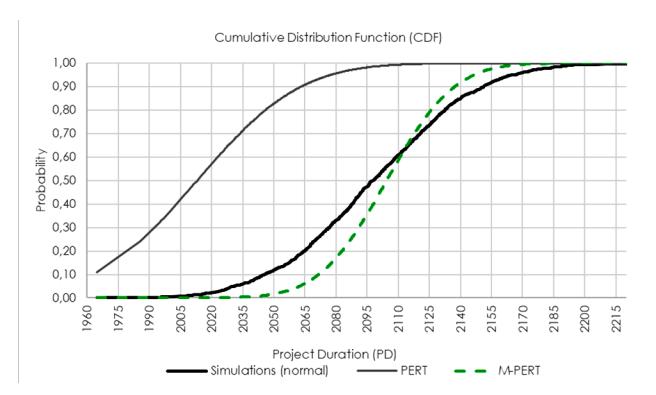
Figure 3. Comparison of project duration estimation accuracy between PERT and M-PERT for JSS project
Ballesteros-Pérez, P., Larsen, G. D., & Gonzales-Cruz, M. C. (2018). Do Projects Really End Late? On The Shortcomings Of The Classical Scheduling Techniques. Journal of Technology and Science Education, 8(1), 17–33. https://doi.org/https:// doi.org/10.3926/jotse.303
Caesaron, D., & Thio, A. (2015). Analisa penjadwalan waktu dengan metode jalur kritis dan pert pada proyek pembangunan ruko (jl. pasar lama no.20, glodok). Journal of Industrial Engineering & Management Systems, 8(2), 59–82.
D. Wiest, J. (1981). Precedence Diagramming Method: some unusual characteristics and their implications for project managers. Journal of Operations Management - J OPER MANAG (Vol. 1). https://doi.org/10.1016/0272-6963(81) 90015-2
Habibi, F., Taghipour Birgani, O., Koppelaar, H., & Radenović, S. (2018). Using fuzzy logic to improve the project time and cost estimation based on Project Evaluation and Review Technique (PERT). Journal Project Management, 3, 183–196. https:// doi.org/10.5267/j.jpm.2018.4.002
Hajdu, M. (2017). History and Some Latest Developments of Precedence Diagramming Method. Organization, Technology Management in Construction: An International
- Journal, 7(2), 1302–1314. https:// doi.org/10.5592/otmcj.2015.2.5
- Herrerías-Velasco, J. M., Herrerías-Pleguezuelo, R., & Van Dorp, J. R. (2011). Revisiting the PERT mean and variance. European Journal of Operational Research, 210(2), 448–451. https://doi.org/10.1016/j.ejor.2010.08.014
- Husin, A. E. (2015). Model Aliansi Strategis Dalam Kemitraan Pemerintah Dan Swasta Pada Mega Proyek Infrastruktur Berbasis Value Engineering Untuk Meningkatkan Nilai Kelayakan Proyek.
- Ibrahim, Y. M., Kaka, A., Aouad, G., & Kagioglu, M. (2009). Framework for a generic work breakdown structure for building projects. Construction Innovation, 9(4), 388–405. https:// doi.org/10.1108/14714170910995930
- Karim, A. M. (2017). Identifikasi Risiko Dalam Pembangunan Jembatan Bentang Panjang (Studi Kasus Pembangunan Jembatan Selat Sunda). Jurnal Infrastruktur ISSN 2527-497X, 3 (01), 70–82.
- Kholil, M., Alfa, B. N., & Hariadi, M. (2018). Scheduling of House Development Projects with CPM and PERT Method for Time Efficiency ( Case Studyࣟ: House Type 36 ), 140, 1–8.
- Kumar, R. (2009). PERT and CPM. In Modeling and Simulation Concepts (1st ed., pp. 1–32). Infinity Science Press. Retrieved from https:// www.researchgate.net/ publication/313250131_PERT_and_CPM
- Kusnanto. (2010). Penjadwalan Proyek Konstruksi Dengan Metode Pert (Studi Kasus Proyek Pembangunan Gedung R.Kuliah Dan Perpustakaan PGSD Kleco FKIP UNS Tahap I). Universitas Sebelas Maret Surakarta.
- Lu, M., & Lam, H.-C. (2009). Transform Schemes Applied on Non-Finish-to-Start Logical Relationships in Project Network Diagrams. Journal of Construction Engineering and Management, 135(9), 863–873. https:// doi.org/10.1061/(asce)co.1943-7862.0000062
- Maysyaroh, F., & Joewono, T. B. (2014). Preferensi pemilihan jembatan selat sunda oleh pengendara mobil penumpang. In The 17th FSTPT International Symposium (pp. 53–62). Jember: Jember University.
- Setiawati, S., Syahrizal, & Ariessa, R. (2012). Penerapan Metode CPM Dan PERT Pada Penjadwalan Proyek Konstruksi ( Studi Kasusࣟ: Rehabilitasi / Perbaikan Dan Peningkatan Infrastruktur Irigasi Daerah Lintas Kabupaten / Kota D . I Pekan Dolok ), 1–14. https:// doi.org/16596/7011
- Shi, X., Zheng, J., & Wei, H. (2010). Construction of Agricultural Logistics Operation Mode Based on WBS, 1750–1755. https:// doi.org/10.1061/41139(387)242
- Siddesh, P., Preeti, V., & Shweta, R. (2013). Application of Line of Balance Scheduling Technique (LOBST) for a Real estate sector. International Journal of Science, Engineering and Technology Research, 2(1), 2278–7798.
- Suputra, I. G. N. O. (2011). Penjadwalan Proyek Dengan Precedence Diagram Method (Pdm) Dan Ranked Position Weight Method (Rpwm). Jurnal Ilmiah Teknik Sipil, 15(1), 18–28.
- Wangsadinata, W. (2013). Laporan Pra-Desain Jembatan Selat Sunda.
- Wangsadinata, W., Essen, D., & Guntorojati, I. (2011). Jembatan Gantung Ultra-Panjang Untuk Jembatan Selat Sunda. Jurnal Ilmiah Media …, 1(2), 81–89. Retrieved from http:// ejournal.unsrat.ac.id/index.php/jime/article/ view/4213