
1. Introduction
Floods are one of the natural disasters that occurred around the world that cause enormous economic losses (Tam, et al., 2014). Indonesia is one of the countries that have a high risk of flood due to its topographic and geographical condition (Riyando, et al., 2018). Floods cause material losses and disrupt community activities (Prastica, et al., 2018). Flood runoff causes a huge loss to the construction, economy, and casualties (Farid, at al., 2021). Flood is a condition where water cannot be accommodated in the river channel or the flow of water is obstructed, so that water overflows and inundates the surrounding area (flood plain) (Suripin, 2003). Flood disasters often occur in the rainy season when rainfall is high. High rainfall intensity that occurred in a short time can cause higher runoff discharge (Farid, at al., 2021).
Another factor that contributes to the cause of the flooding is a change in land use. Land use changes can lead to changes in the hydrologic characteristic, one of them is an increase in surface runoff that will intensify floods (Farid, at al., 2018). Land-use changes upstream of the river due to the development of the area can also cause an increase in erosion that results in reduced capacity of the river (Setio, et al., 2019). Rongkong River has a high potential for flooding every year, flood events are caused by sedimentation in the river which causes a reduction in the river's capacity to pass flood discharge. The source of sediment comes from the erosion of agricultural land upstream and mass landslides that occur on hillsides, mountains, and river cliffs (Puslitbang Lingkungan Hidup, UNHAS 2017).
The government through BBWS Pompengan – Jeneberang has conducted a technical study of the flood control plan, one of which is the construction of embankments and normalization of the downstream Rongkong River. This work aims to increase the capacity of the Rongkong river so that it can drain flood discharge and prevent runoff to protect community settlements and public facilities. Some of the sub-districts that are prone to flooding due to the runoff of the Rongkong River include South Baebunta, West Malangke, and Sabbang (BBWS, Pompengan Jeneberang, 2013).
The purpose of this study is to examine the effectiveness of planned flood control in reducing flood runoff using the flood overflow hydraulic model. In this study, flood modeling was analyzed using HEC-RAS. HEC-RAS is an advanced software for river flow hydraulic analysis (Najafi, et al., 2015). Hydraulic analysis components used in HEC-RAS for this study is one-dimensional unsteady flow simulation. Onedimensional hydraulic calculations are capable of simulating unsteady flow through a full network of natural and constructed channels (US Army Corps of Engineers, 2016).
2. Study Area
The study area of this research is Rongkong River in North Luwu Regency, South Sulawesi Province which is included in the Pompengan Larona River Area and is located in the Rongkong Basin under PUPR Ministerial Regulation No. 04/PRT/M/2015. The area of Rongkong Basin is 1807 km2with the length of Rongkong River is around 104 km and ends in Bone bay which is affected by tides. Rongkong Basin map can be seen in Figure 1(a).
The upstream part of the Rongkong River has a slightly steep to steep slope, while the downstream has a gentle to flat slope. Land slope map is shown in Figure 1(b). This condition causes the upstream flow velocity to be quite heavy to transport sediment and causes sedimentation in the downstream due to changes in slope which causes a decrease in flow velocity. This sedimentation causes the capacity of the downstream Rongkong River unable to pass the flood discharge within a certain return period and eventually causes flood overflow.
Normalization of the river is planned with a double cross-section as can be seen in Figure 2(a), where the width of the main channel is between 40 - 120 m,
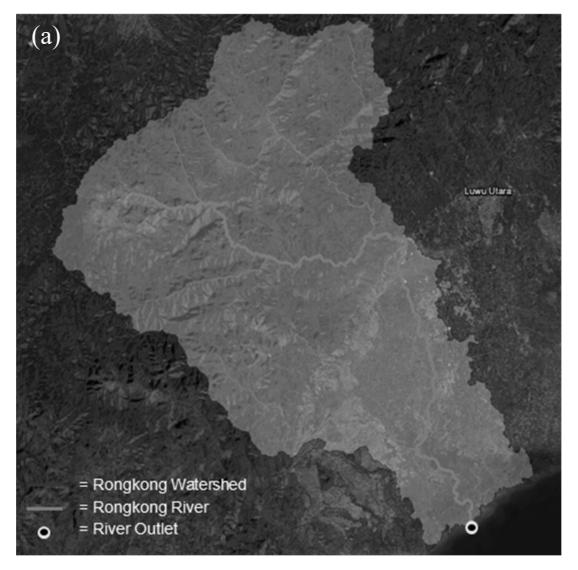
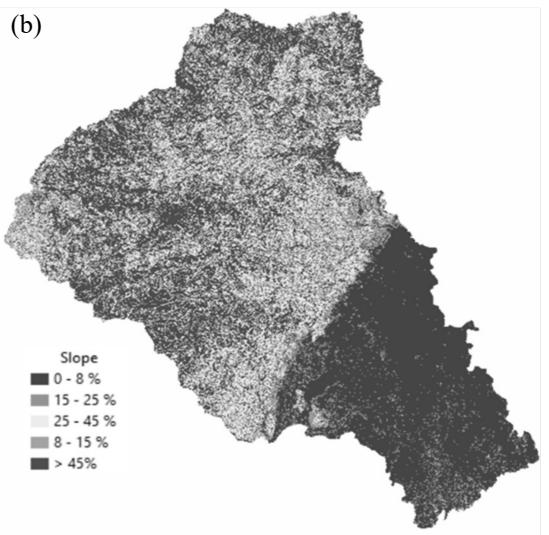
Figure 1. (a) Rongkong basin map (b) Land slope map
while the banks on the left and right of the river are 20 m wide. The total length of the embankment planned is 54 km as can be seen in Figure 2(b) and the height of the embankment varies from upstream to downstream with an average planned height of 5 m.
The normalization and construction of the embankment are designed using the flood discharge at a 20 year return period which is 3939 m3 /s based on design data. Flood discharge used is based on the regulation of the Ministry of Public Works and Housing, which is stated that the flood design for embankments of the river near regency/ city capital area must be able to pass the flood discharge of Q10 – Q20 [13].
3. Material and Methods
The stages in this study consist of literature study review, data collection, analysis and modeling, suggestions, and conclusions. Rainfall data is obtained from 3 stations which is DAS Rongkong (2010-2019), Sabbang (2010- 2019), and Lamasi-Padang-Kalua (1979-2019) which can be seen in Figure 3. Observed discharge data is obtained from 1 station which is Rongkong Narobo (2003-2019) as can be seen in Figure 4.
Basin parameters such as basin area, river length, length to centroid, slope, CN, and etc. were analyzed using Geographic Information System (GIS). The hydrologic analysis consists of regional rainfall analysis using the isohyet method, design rainfall analysis at various return periods using frequency distribution analysis, effective rainfall analysis using SCS-CN method, hourly rainfall distribution using satellite data based on historical flood events, and flood design discharge analysis using HEC-HMS based on Synthetic Unit Hydrograph (SUH) method which is Soil Conservation Service (SCS), and Snyder
Hydraulic modeling was analyzed using HEC-RAS 1D with unsteady flow conditions. The boundary condition used upstream of the model is flood discharge and tidal
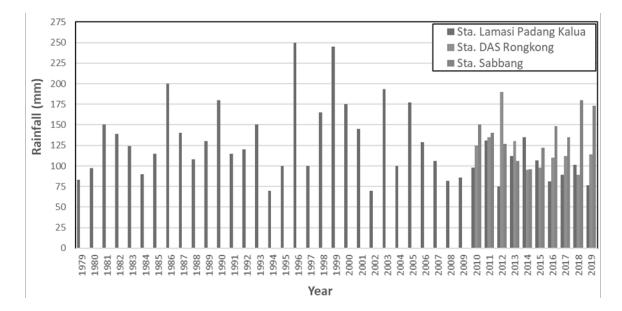
Figure 3. Maximum daily rainfall data
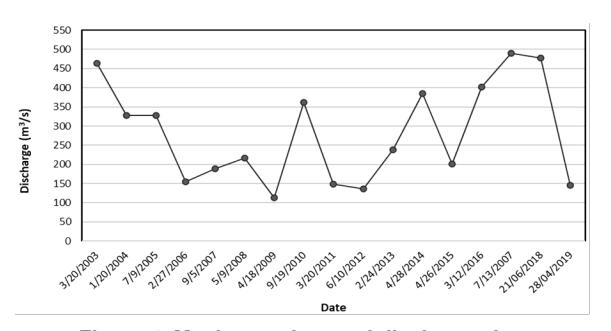
Figure 4. Maximum observed discharge data
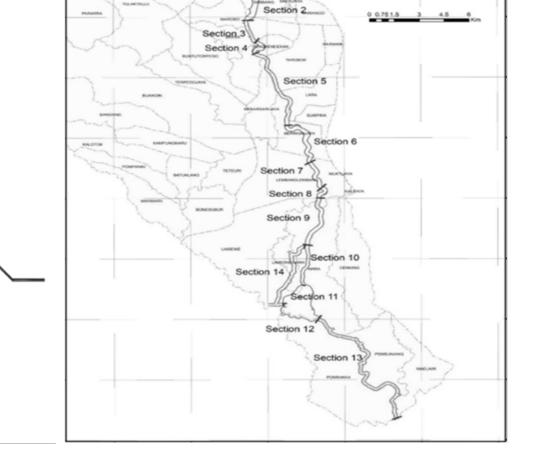
Figure 2. (a) Typical design of embankment and normalization (b) Flood control plan map
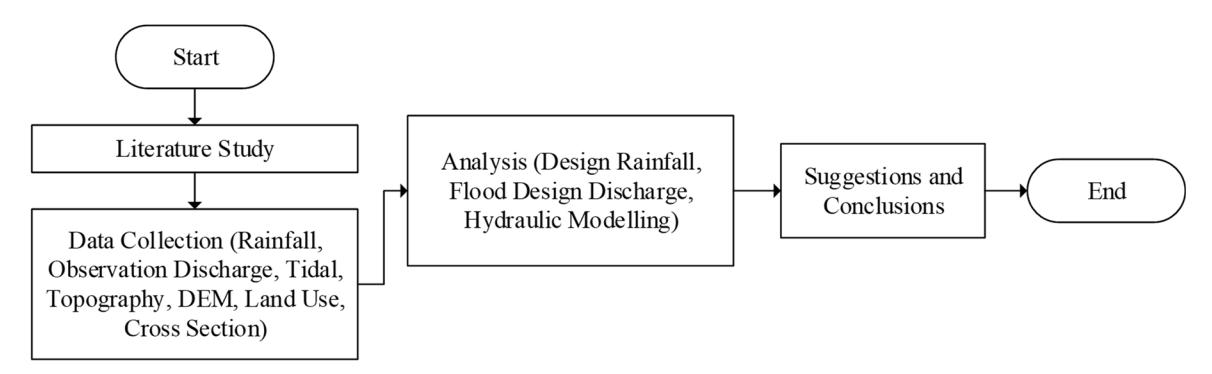
Figure 5. Flow chart of the study
stage elevation downstream of the model. The geometric data is obtained from Rongkong River Flood Control Survey, Design, and Investigation (SID) Study. The flow chart of this study is described in Figure 5.
4. Results and Discussions
4.1. Basin property analysis
Basin property data was analyzed using GIS-based on Digital Elevation Model (DEM) data. To be able to produce a distributive model, Rongkong Basin was divided into 14 sub-basins and the results can be seen in Figure 6(a).
4.2. Design rainfall analysis
Generalized Extreme Value (GEV) was chosen as a method for frequency distribution analysis to produce design rainfall at various return periods. Analysis was performed on the maximum daily rainfall data at each station used. The results can be seen in Figure 6(b).
4.3. Regional rainfall analysis
Regional rainfall was analyzed by creating an isohyet map using GIS. The isohyet map was created based on the 20 year return period design rainfall. Isohyet's map of regional rainfall can be seen in Figure 7(a). Based on the map, design rainfall was calculated on each subbasins, the results can be seen in Figure 7(b).
4.4. Hourly rainfall distribution analysis
Due to the lack of observed hourly rainfall data, the analysis of the hourly rainfall distribution was conducted using Global Precipitation Measurement (GPM) satellite data based on historical flood events that have occurred 2010-2020. From the results of the analysis the distribution of hourly rainfall can be seen in Figure 8(a).
4.5. Effective rainfall analysis
The calculation of effective rainfall is done by first calculating the infiltration value. The infiltration calculation in this study was done using the SCS method based on the value of CN (Curve Number). CN values are obtained by combining soil texture maps based on HWSD (Harmonized World Soil Database) maps shown in Figure 12 and Rongkong Basin land use maps shown in Figure 13 to get CN values on each existing sub-basins as can be seen in Figure 8(b).
4.6. Flood design discharge analysis
The flood design discharge was analyzed using HEC-HMS with SCS SUH and Snyder SUH method with
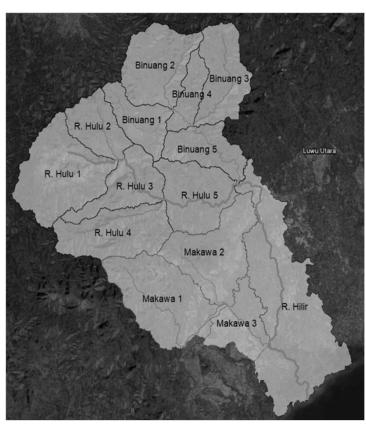
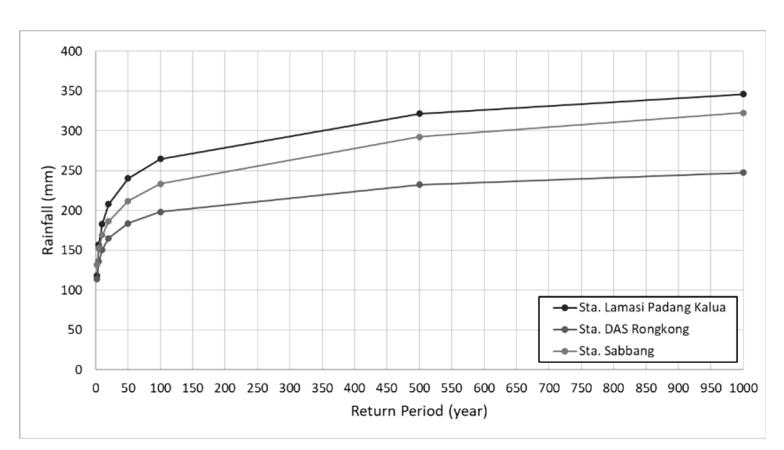
Figure 6. (a) Sub-basins map (b) Design rainfall at various return periods on each station
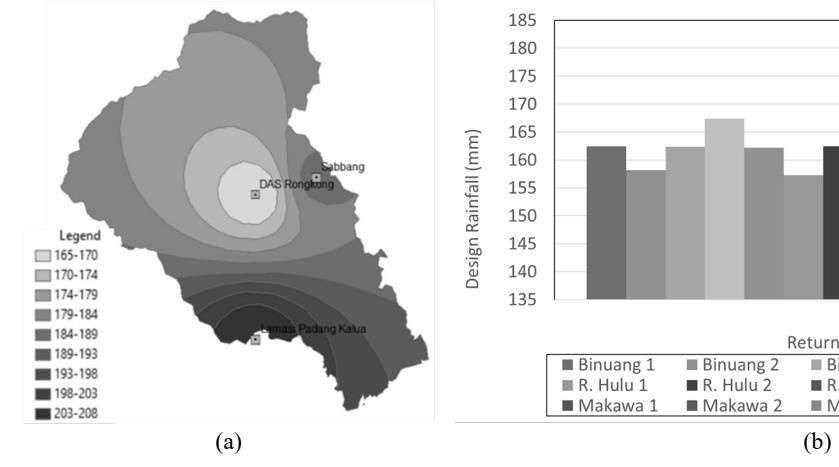
Figure 7. (a) 20 year return period isohyet map (b) Design rainfall on each sub-basins
various return periods. The inputs used in modeling flood discharge with HEC-HMS are river network schemes, basin parameters, hourly rainfall, and CN value for infiltration. The basin network scheme can be seen in Figure 9.
Flood peak discharge was calibrated using frequency distribution of observed discharge data located at Junction-5 by adjusting the time lag parameter on both SCS SUH and Snyder SUH methods. Calibration was analyzed on 20 year return period flood peak discharge.
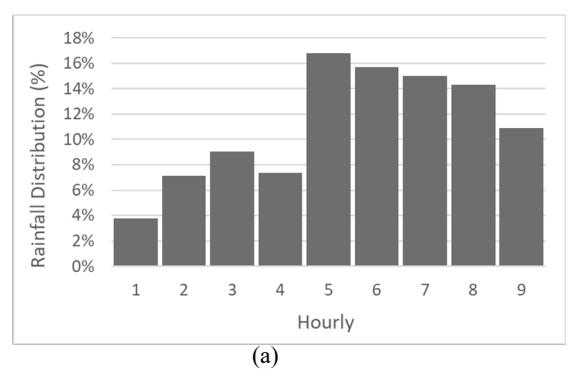
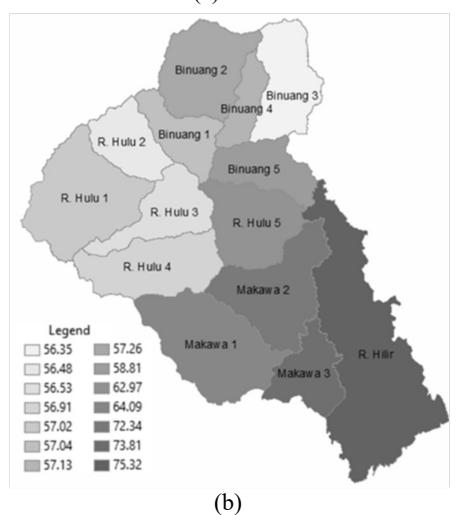
Figure 8. (a) Hourly rainfall distribution (b) CN values map
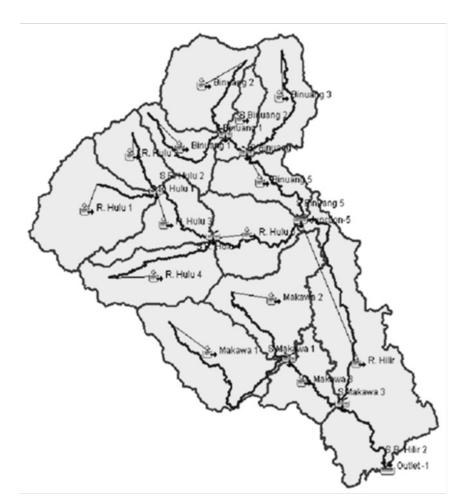
Figure 9. Rongkong basin hydrological model scheme in HEC-HMS
From the calibration, Snyder SUH was chosen as the flood design discharge that will be used for hydraulic modeling. The calibration results can be seen in Figure 10 and Table 1.
Based on the analysis result using Snyder SUH the flood discharge hydrograph obtained at Junction-5 and Outlet-1 both is shown in Figure 11 and Figure 12. The flood peak discharge for both review points is shown in Table 2 and Table 3.
4.7. Hydraulic modeling analysis
Modeling is carried out on 2 conditions which are existing condition and design condition. The 20-year flood design discharge obtained from calculation before is used as a boundary condition in HEC-RAS 1D unsteady flow at the upstream of the model. The boundary condition used downstream of the model is tidal data using Highest High Water Level (HHWL) elevation. The river network scheme and boundary used for modeling can be seen in Figure 13 and the boundary condition is shown in Table 4.
The results of the hydraulic modeling using HEC-RAS 1D on the elongated profile of Rongkong River existing conditions are shown in Figure 14. From the results, there was a flood runoff that occurs slightly upstream and from the middle to downstream of the river. The flood occurs at Sta. 54000-48000 and at Sta 32000-0.
The height of the flood runoff at some of the review points can be seen in Table 5. The average height of the flood runoff is about 2 m and the average of the flow
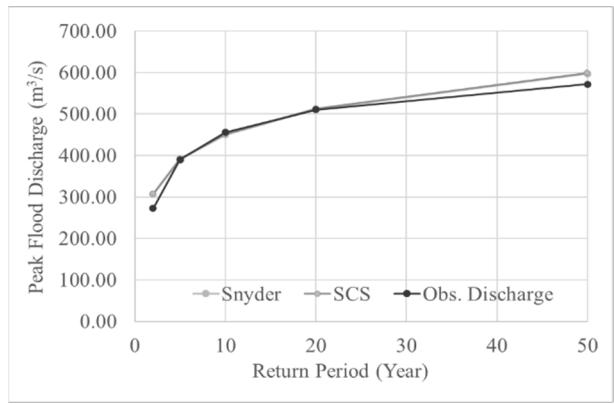
Figure 10. Peak discharge calibration
Table 1. Calibrated flood peak discharge on 20 year return period
| Return Period | Peak Flood Discharge (m3 /s) | |||
| (Year) | SCS | Snyder | Obs. Discharge | |
| 2 | 306.86 | 306.12 | 272.60 | |
| 5 | 391.18 | 389.99 | 390.15 | |
| 10 | 451.20 | 449.76 | 455.67 | |
| 20 | 512.65 | 510.96 | 510.66 | |
| 50 | 599.19 | 597.16 | 571.96 | |
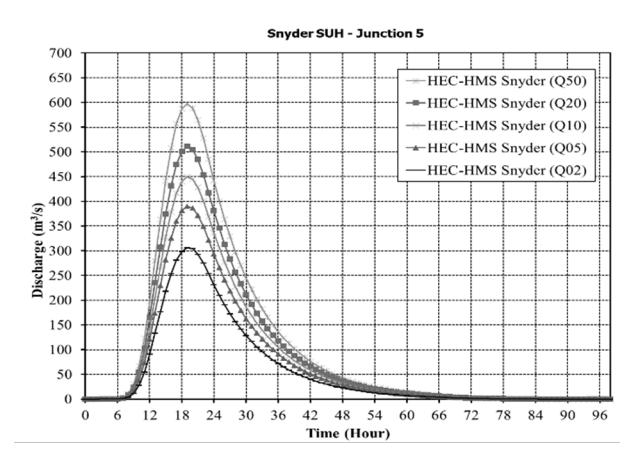
Figure 11. Snyder SUH flood discharge at junction-5
Table 2. Snyder SUH peak flood discharge at junction-5
| Return Period (Year) | Peak Discharge (m3 /s) | ||
|---|---|---|---|
| 2 | 306.12 | ||
| 5 | 389.99 | ||
| 10 | 449.76 | ||
| 20 | 510.96 | ||
| 50 | 597.16 | ||
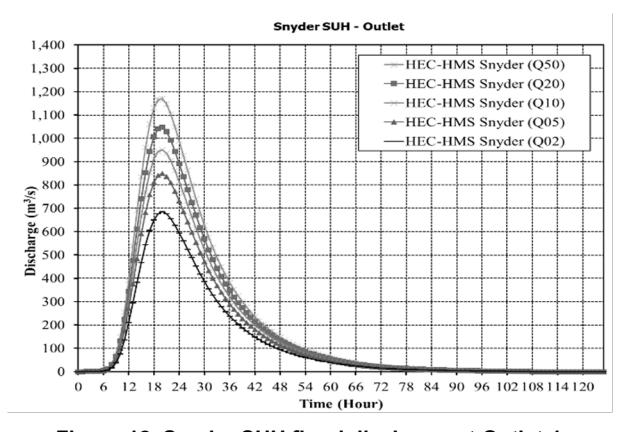
Figure 12. Snyder SUH flood discharge at Outlet-1
Table 3. Snyder SUH peak flood discharge at outlet-1
| Return Period (Year) | Peak Discharge (m3 /s) | ||
|---|---|---|---|
| 2 | 684.46 | ||
| 5 | 848.74 | ||
| 10 | 951.16 | ||
| 20 | 1046.78 | ||
| 50 | 1169.91 | ||
velocity is 1.82 m/s. Flooding occurs due to sedimentation in the river which causes a reduction in the river's capacity to drain the flood downstream of the river.
The results of the hydraulic modeling using HEC-RAS 1D on the elongated profile of Rongkong River
Figure 13. River network scheme in HEC-RAS
Table 4. Boundary condition
| Boundary | Description | ||
|---|---|---|---|
| 1 | Flow hydrograph | ||
| 2 | Lateral flow hydrograph | ||
| 3 | Flow hydrograph | ||
| 4 | Stage hydrograph | ||
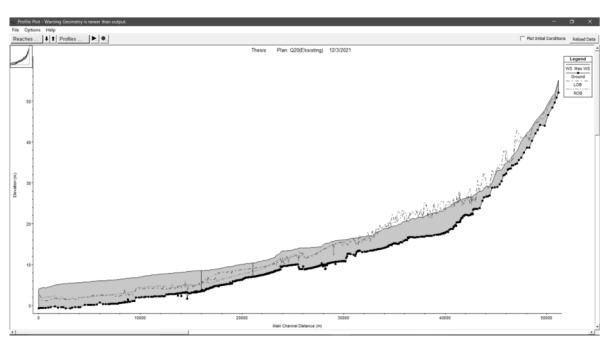
Figure 14. Elongated profile of Rongkong river existing
Table 5. Flood runoff height at existing condition
| No. | River Sta. | LOB | ROB | WS. Elev. | Runoff |
|---|---|---|---|---|---|
| 1 | 50293 | 48.66 | 48.60 | 49.55 | 0.95 |
| 2 | 49934 | 46.44 | 45.82 | 47.97 | 2.15 |
| 3 | 48421 | 40.65 | 40.24 | 42.86 | 2.62 |
| 4 | 32745 | 15.66 | 15.44 | 16.98 | 1.54 |
| 5 | 26974 | 11.98 | 12.25 | 14.15 | 1.90 |
| 6 | 19446 | 8.44 | 7.94 | 9.74 | 1.80 |
| 7 | 13485 | 4.08 | 4.38 | 7.08 | 2.70 |
| 8 | 8860 | 3.04 | 2.9 | 6.66 | 3.76 |
| 9 | 1690 | 1.73 | 2.33 | 5.23 | 2.90 |
| 10 | 237 | 2.33 | 2.46 | 4.71 | 2.25 |
| 11 | 91 | 2.54 | 2.45 | 4.32 | 1.87 |
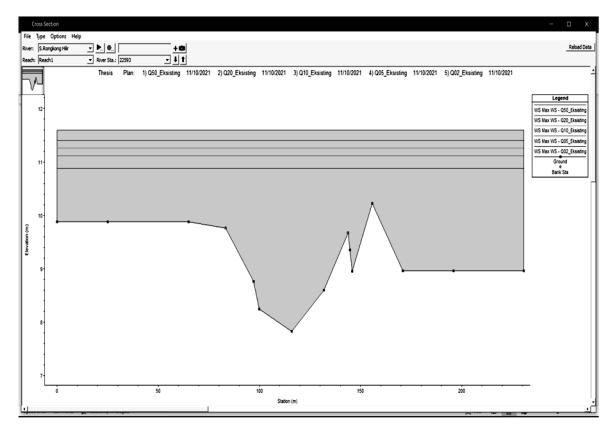
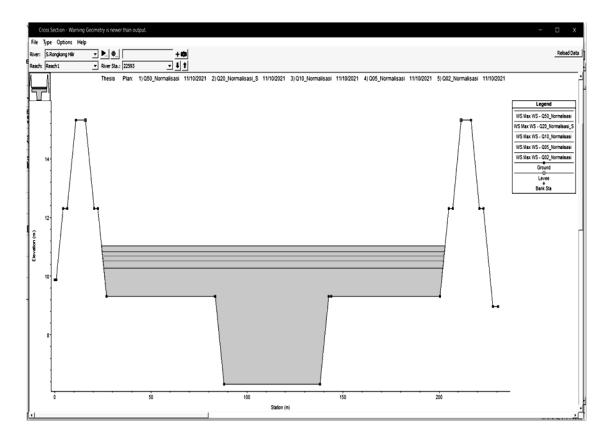
Figure 16. Comparison of the cross-section between existing conditions and design conditions
Table 6. Flood runoff height at design condition
| No. | River Sta. | LOB | ROB | WS. Elev. | Runoff |
|---|---|---|---|---|---|
| 1 | 50293 | 51.36 | 51.68 | 49.28 | 0 |
| 2 | 49934 | 48.44 | 48.48 | 48.07 | 0 |
| 3 | 48421 | 45.14 | 45.14 | 40.34 | 0 |
| 4 | 32745 | 20.54 | 20.54 | 15.33 | 0 |
| 5 | 26974 | 17.92 | 17.92 | 12.75 | 0 |
| 6 | 19446 | 14.06 | 14.06 | 8.17 | 0 |
| 7 | 13485 | 13.42 | 13.42 | 7.26 | 0 |
| 8 | 8860 | 11.87 | 11.87 | 6.16 | 0 |
| 9 | 1690 | 8.69 | 8.69 | 4.41 | 0 |
| 10 | 237 | 7.52 | 7.52 | 4.10 | 0 |
| 11 | 91 | 7.35 | 7.35 | 4.02 | 0 |
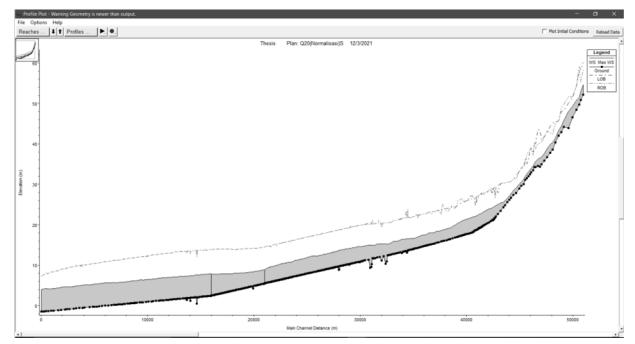
Figure 15. Elongated profile of Rongkong river design conditions
normalization and embankments conditions are shown in Figure 15. Based on the results, flood reduction resulted from the plan of normalization and construction of levees by 100% where there was no flood runoff along the modeled river.
However, there is a difference between flood discharge resulting from the analysis in this study which is used in the model with flood discharge design from the data plan. This difference shows that the structural mitigation effort for flood control in Rongkong River with river normalization and construction of embankment is overdesigned.
The height of the flood runoff at some of the review points can be seen in Table 6. In this condition, there is no flood runoff after normalization and embankment construction are carried out. In Figure 16 is displayed several cross-sections as a comparison between existing conditions and design conditions.
From the comparison of the cross-section between existing conditions and design conditions shown in Figure 16, it can be seen that the existing capacity of the Rongkong River at a certain cross-section was unable to pass the flood discharge on 2 year return period.
5. Conclusions.
The conclusions from this study include the following:
- 1. There is a difference in flood discharge on the 20year return period at rongkong river outlets between the results of the analysis which is 1046 m<sup>3</sup>/s with the flood discharge used to design the normalization and embankment of the planning data which is 3939 m<sup>3</sup>/s. This is due to differences in several methods used in hydrological analysis and in the planning data that has not been explained regarding flood discharge calibration methods.
- 2. From the results of modeling using HEC-RAS, the existing capacity of the Rongkong River upstream from Sta. 51295-41482 is 724-1491 m<sup>3</sup>/s, at the middle from Sta. 41451-21303 is 82-385 m<sup>3</sup>/s, and at the downstream from Sta. 21221-91 is 35-80 m<sup>3</sup>/s. This shows that the existing Rongkong River is no longer able to pass the Q2 - Q5 flood discharge in the middle and downstream.
- 3. In the upstream, the capacity is still able to pass the Q50 flood discharge because the cross-section of the river in the upstream part of the river is widened due to the erosion from the river flow.
- 4. Based on the results of flood modeling using the normalization and embankment condition resulted in a flood runoff reduction of 100% and caused an increase in the average flow velocity of 18% from 1.82 m/s to 2.14 m/s.
- 5. The use of Q20 as a design flood discharge in the normalization plan and construction of the Rongkong River embankment is considered too large because it causes construction costs to be very expensive.
- 6. It is recommended to use Q10 in accordance with the regulation of the Ministry of Public Works and Housing, which is stated that the flood design for embankments of the river near the regency/city capital area must be able to pass the flood discharge of Q10 – Q20.
- 7. It is needed to conduct a design review of the plan of normalization and construction of the embankment.
References
- A. Najafi Birgani et al 2015 Analysis of the Effect of Short Dikes on Flow Hydraulics and Sedimentation in Karun River within Urban Boundaries of Ahwaz ISSN 0097-8078, Water Resources, Vol. 44, No. 44 pp. 626-634
- BBWS Pompengan Jeneberang 2013 Survei Investigasi Desain (SID) Pengendalian Banjir Sungai Rongkong
- Farid, M., Gunawan, B., Badri Kusuma, M.S., Habibi, S.A., Yahya, A. 2021 Assessment of Flood Propagation Due to Several Dams Break in Banten Province International Journal of GEOMATE, 2020, 18(70), pp. 229–234
- Farid, M., Mano, A., Udo, K. 2018 Distributed Flood Model For Urbanization Assessment In A Limited-Gauged River Basin WIT Transactions on Ecology and the Environment, 2011, 146, pp. 83–94
- Farid, M., Saputra, D., Maitsa, T.R., Kuntoro, A.A., Chrysanti, A. 2021 Relationship Between Extreme Rainfall and Design Flood-Discharge of the Ciliwung River IOP Conference Series: Earth and Environmental Science, 2021, 708 (1), 012031
- Peraturan Menteri Pekerjaan Umum dan Perumahan Rakyat 2015 No. 28/PRT/M/2015 Penetapan Garis Sempadan Sungai dan Garis Sempadan Danau
- Puslitbang Lingkungan Hidup, UNHAS 2017 Rencana Perlindungan dan Pengelolaan Lingkungan Hidup (RPPLH) Kabupaten Luwu Utara
- R M S Prastica et al 2018 Estimating Design Flood And HEC-RAS Modelling Approach For Flood Analysis In Bojonegoro City IOP Conf. Ser.: Mater. Sci. Eng. 316 012042
- Riyando, I M et al 2018 The Use of Rapid Assessment for Flood Hazard Map Development in Upper Citarum River Basin MATEC Web of Conferences 229, 04011 2018
- Setio, B B et al 2019 Evaluation of Flood Mitigation Plan for Cibaligo River, Cimahi City, West Java, Province International Journal of GEOMATE, July, 2020, Vol.19, Issue 71, pp. 188 - 193
- Suripin 2003 Sistem Drainase Kota Yang Berkelanjutan, Yogyakarta, Andi 2004
- T H Tam et al 2014 Flood Loss Assessment in the Kota Tinggi IOP Conf. Ser.: Earth Environ. Sci. 18 012120
- US Army Corps of Engineers 2016 HEC-RAS User's Manual 6.0