
Abstrak
Data masukan yang berasal dari sumber online digunakan sebagai variabel dalam perhitungan model numerik. Analisis hidrodinamika di Pantai Bedono dimodelkan menggunakan kombinasi software Delft3D-Flow dan Delft3D -Wave. Domain model menggunakan kombinasi batimetri nasional dari BATNAS dan topografi nasional dari DEMNAS. Gaya penggera pada model yaitu pasang surut TPXO 7.2 dan gelombang hasil hindcasting dari data angin National Oceanic Atmospheric and Administration (NOAA). Elevasi muka air penting HHWL = 1,156 m, MHWL = 1,060 m, MSL = 0,600 m, MLWL = 0,140 m, LLWL = 0,044 m diperoleh dari titik pengamatan pada grid model. Selain itu, tinggi gelombang signifikan dan periode puncak signifikan untuk setiap arah laut dihitung dan menjadi masukan untuk boundary dalam model gelombang. Hasil visualisasi hidrodinamika selama satu bulan setelah simulasi selesai dapat dilihat dan dianalisa menggunakan menu quickplot dari Delft3D.
Kata-kata Kunci: : Pantai Bedono, open resource, Delft3D, hidrodinamika, visualisasi
1. Introduction
Hydrodynamic modeling is very important to determine the characteristic of the water, especially as a parameter of coastal building design. Parameters such as tide and wave should be known so that the development plan in coastal area is accurate and able to prevent the damage of natural stability. Basically, in hydrodynamic modeling using Delft3D, we need a domain in the form of depth (.dep) data from topography and bathymetry. To obtain the data, The field should be measured by taking the elevation points that would be used as depth on the domain model. However, to visualize hydrodynamic model with a wide domain area, the field measurement are high-cost and time-consuming. Furthermore, tidal and wave parameters are also difficult to obtain due to long open boundary in the model. Therefore, wide area model can be simplified by using a global model. However, global data that measure using satellites for topography and bathymetry might not be accurate due to low quality of the data. The result of this model is not recommended to be applied as input for local model planning that requires a high level of accuracy. Hydrodynamic modeling with a grid size of 100 m x 100 m was carried out on Bedono Beach with a total model area 80.5 km2. Bedono Beach is located in the northern area of Bedono Village, Sayung District, Demak Regency, West Java Province.
Figure 1. Hydrodynamic model area at bedono vilage, Demak Regency.
2. Methodology
The bathymetry and topography data were obtained from the main website of Badan Informasi Geospasial (BIG). These data have different datum where the topography from DEMNAS refers to Earth Geoid Model (EGM) 2008 while the bathymetry from BATNAS refers to the EGM 2008 and mean sea level. Therefore, different elevation values are often found at the meeting point on that two spatial data. In addition, the topography resolution of DEMNAS is 0.27 arcsecond, while the bathymetry of BATNAS is 6 arcsecond (Marindah et all, 2018). The difference of elevation points were eliminated by digitizing the shoreline using Google Earth online as a separator between land and sea areas. Elevations that are positive in bathymetry were zeroed with the ArcGis 10.5 raster calculator tool. After that, the topographic and bathymetric data were converted into .xyz file format using QGIS software to be combined by the quickin tool in Delft3D with a grid size of 100 m x 100 m. Open boundaries for the model and its tidal constituents were generated by TPXO 7.2 via Delft Dashboard software. Boundary is made at the sea until it reach the digitization of shoreline.
The tidal data was obtained from TPXO 7.2 with the nearest climatology station is Semarang Climatology Station. The Formzahl Number obtained from the observation point was 1.706. Hence, the tidal in that area is categorized as mixed diurnal type. The
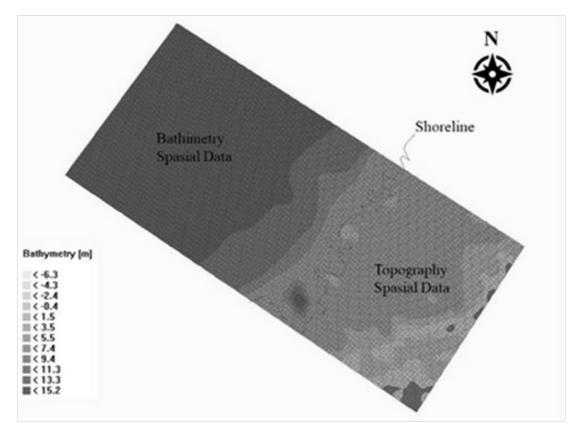
Figure 2. Domain model combination of topography and bathymetry spatial data.
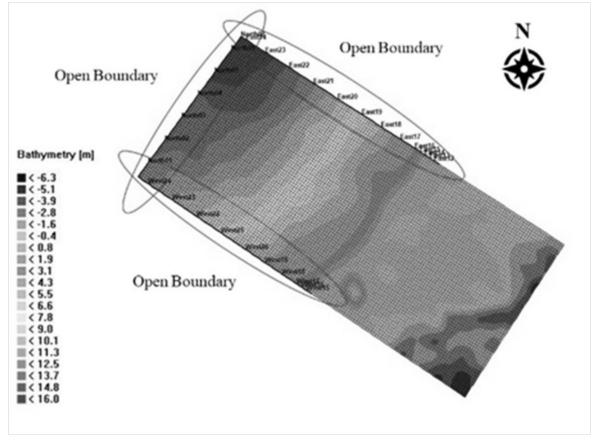
Figure 3. Open boundary generation of domain model by using delft dashboard
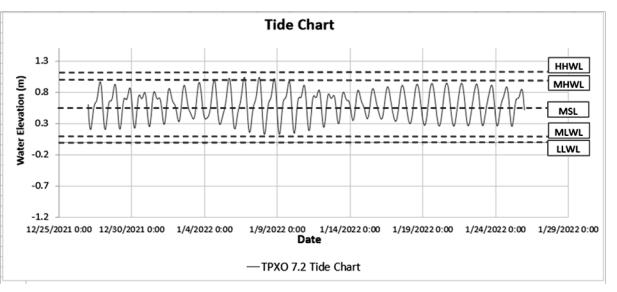
Figure 4. Tidal chart at observation point
Table 1. Significant wave height and peak period each nautical direction
| North | Northeast | East | Southeast | ||||
|---|---|---|---|---|---|---|---|
| Hs (m) | Ts (s) | Hs (m) | Ts (s) | Hs (m) | Ts (s) | Hs (m) | Ts (s) |
| 0.983 | 5.695 | 1.080 | 5.186 | 0.667 | 4.454 | 1.067 | 5.143 |
| South | Southwest | West | Northwest | ||||
| Hs (m) | Ts (s) | Hs (m) | Ts (s) | Hs (m) | Ts (s) | Hs (m) | Ts (s) |
| 0.054 | 0.802 | 0.175 | 1.639 | 1.078 | 4.849 | 0.934 | 6.056 |
important water level elevation based on the analysis were HHWL (Highest High Water Level) 1.156 m, MHWL (Mean High Water Level) 1.060 m, MSL (Mean Sea Level) 0.600 m, MLWL (Mean Low Water Level) 0.140 m, and LLWL (Lowest Low Water Level) 0.044 m.
The fetch analysis was calculated by determining the fetch point then drawing a scale line as far as 200 km with 50 intervals for each direction. Significant wave height and wave peak period were analyzed from NOAA (National Oceanic and Atmospheric Administration) wind data using the 1984 SPM hindcasting method. As a result, the significant wave height and peak period for each nautical direction were obtained and shown in Table 1.
All of the obtained data were utilized to set up a model using Delft3D software. The simulation was started by creating grids and bathymetry (depth file), as input for making flow models and wave models. Flow models are used to simulate coastal hydrodynamics. This menu of this model consists several parts, with each explanation as follows:
- 1. Domain. The data such as grids, enclosures, and bathymetry are required in the domain menu.
- 2. Boundaries. In this section, the model area is divided to land area and coastal area and combined into one bathymetry data by creating the shoreline through digitization while the tides data is added at coastal boundary. In addition, the wave data is determined into the boundary through wave model.
- 3. Physical Parameter. This parameter contains hydrodynamic parameter values, roughness, viscosity, sediment characteristics and morphology.
- 4. Operations. Operations contains discharge parameters including flow and sediment concentration from the river.
- 5. Monitoring. Monitoring or observation points are used to see the changes that have occurred at that point.
- 6. Output. In this section the outputs that will be displayed in the modeling results are determined. Output. In this section the outputs that will be displayed in the modeling results are determined.
3. Result and Discussion
The data used as model input are tidal harmonic constituent data, significant wave height data, significant peak period and nautical wave direction. The modeling was simulated for 1 month from 27 December 2021 until 27 January 2022. The hydrodynamic characteristics at the study site were obtained as follows:
3.1 Tidal visualization
The hydrodynamic conditions when there are high and low tides at each grid has different characteristics. An observation point can be put in any grid to observe several hydrodynamic phenomenon such as tide. The results of the tidal simulation model are visualized using the quickplot tool in Delft3D by taking several samples of the simulation time as follows:
Figure 5 show water level at coastal side reach 0.40 m - 0.45 m during the low tide. This water level is higher
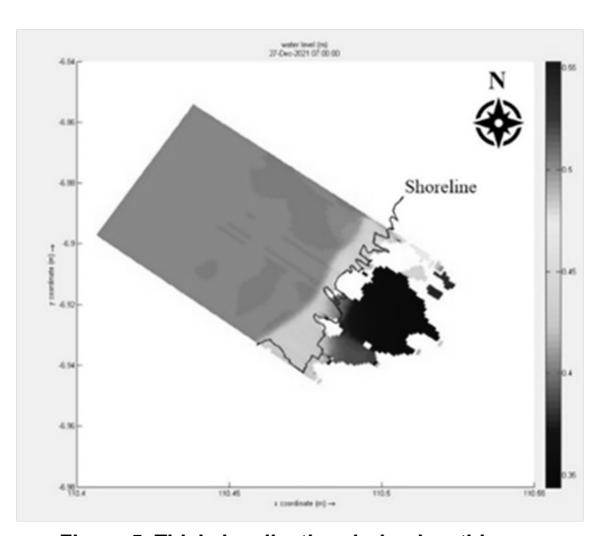
Figure 5. Tidal visualisation during low tides on 27 December 2021 00:00
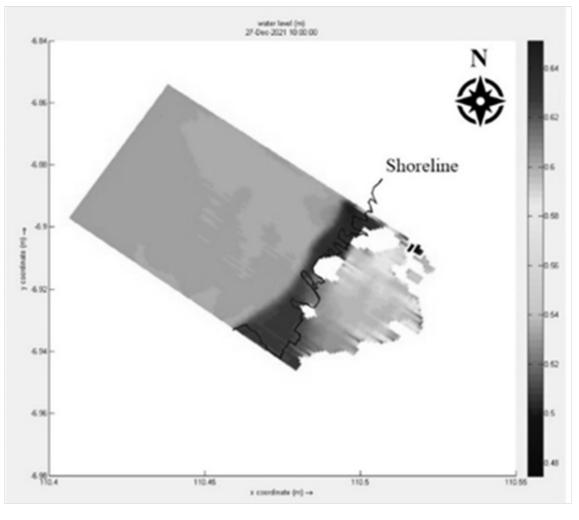
Figure 6. Tidal visualisation during high tides on 27 December 2021 10:00
than LLWL and MLWL value, but it is below the MSL value of 0.60 m. Because the topography at Bedono Village is very low, there were several land areas with lower elevation than the water level were drown. Figure 6 show the water level at coastal side rise to 0.60 m - 0.64 m. It increases the large amount of drowned area at the land side. Hydrodynamic phenomenon can be seen in every hour for a month, from 27 December 2021 until 27 January 2022. Another hydrodynamic visualization during low tide and high tide are shown in Figure 7 and Figure 8.
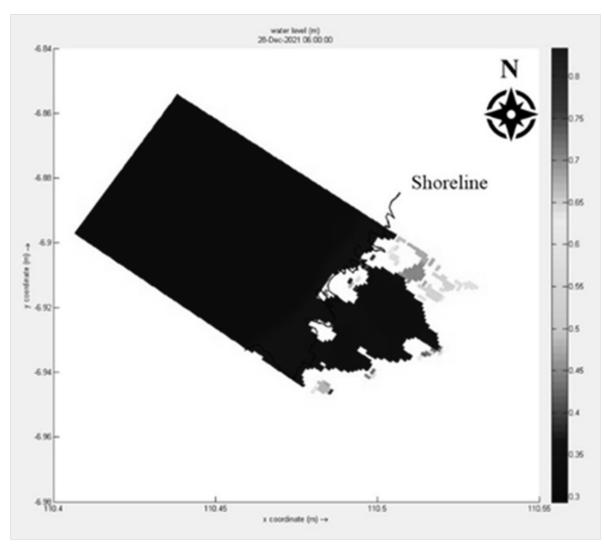
Figure 7. Tidal visualization during low tides on 28 December 2021 06:00
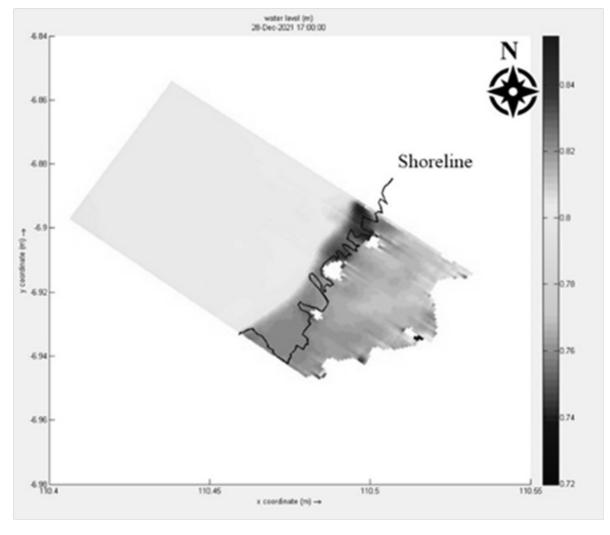
Figure 8. Tidal visualization during high tides on 28 December 2021 17:00
3.2 Wave visualization
Significant wave height and significant peak period of hindcasting results in 8 nautical directions were modeled with Delft3D so that the dominant wave direction from north was obtained based on the model. Visualization of wave height and its direction are displayed using the Delft3D quickplot tool as follows:
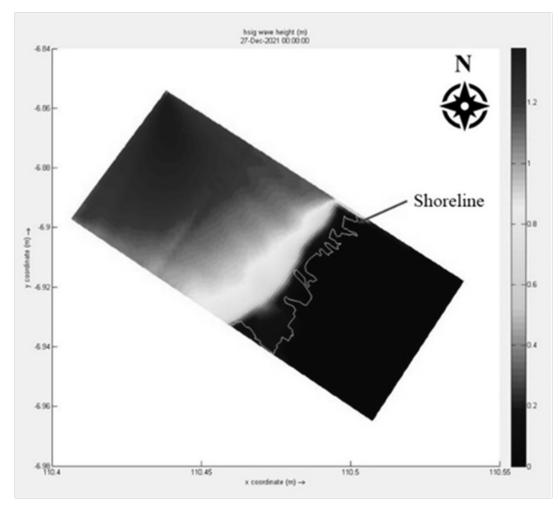
Figure 9. Magnitude of wave height on model area
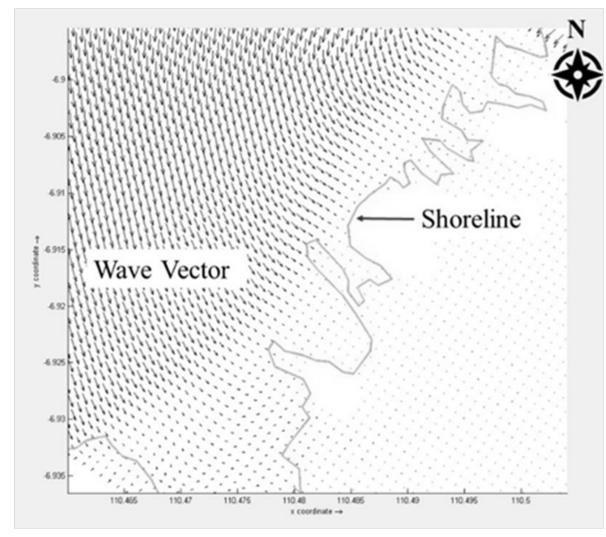
Figure 10. Wave vector near shore on model area.
The result of wave height is shown in figure 9 through colour visualization, while its direction is shown by wave vector in figure 10. In addition, the length of wave vector indicates the height of wave. Figure 9 show us the height of wave are decrease from its boundary until it reach the shoreline. The dominant wave vector from north in figure 10 change its direction from north to northwest when it reach the shore.
4. Conclusion
1. All data used for hydrodynamic modeling at Bedono Beach were obtained from website and can be downloaded for free such as topography from DEMNAS, bathymetry from BATNAS, tidal data from TPXO 7.2, and wind data from National Observation Atmospheric Administration (NOAA). Delft3D-Flow and Delft3D-Wave software that used for modeling are freeware. Because the data and the software are basically free, this modeling process called as an open resource processing for modeling.
- 2. The global model construct by global data that came from satellite measurement. Therefore, it is not relevant for local design as it contains many errors when it comes to detail. The domain refinement needs to be done to prevent elevation errors because of the differences of datum between bathymetry and topography.
- 3. Besides, the tidal and wave should be calibrated by data which observe on the field. Each grid of the hydrodynamic conditions (tidal and wave) in model can be observed by locating an observation point or visualized all the model occurred by selecting hydrodynamic parameter using quickplot.
Acknowledgment
The authors would like to acknowledge the funding from Bandung Institute of Technology (ITB) interm of P2MI 2022 (Research for Education, Community Service, and Innovation Programs 2022).
References
- Aoyama, Y., Adityawan, M.B., Widiyanto, W., Mitobe, Y., Komori, D. and Tanaka, H., 2016. Numerical study on Tsunami propagation into a river. Journal of Coastal Research, (75 (10075)), pp.1017-1021.
- CERC 1984 1:337, Shore protection manual, US Army Corps of Engineers
- Deltares 2011 27-114, Delft3D-Flow Simulation Of Multi-Dimensional Hydrodynamic Flows And Transport Phenomena, Including Sediments: User Manual. Deltares, The Netherlands.
- Deltares 2011 19-56, Delft3D-Quickin Generation and Manipulation of Grid-Related Parameters Such As Bathymetry, Initial Conditin and Roughness: User Manual. Deltares, The Netherlands.
- Deltares 2011 5-12, Delft3D-Quickplot Visualisation and Animation Program for Analysis of Simulation Results: User Manual. Deltares, The Netherlands.
- Deltares 2011 21-58, Delft3D-RGFGRID Generating and Manipulating of Curvilinear rids for Delft3D-Wave: User Manual. Deltares, The Netherlands.
- Deltares 2011 15-28, Delft3D-Tide Analysis and Predictioon of Tides: User Manual. Deltares, The Netherlands.
- Deltares 2011 32-39, Delft3D-Wave Simulation Of Short -Crested Waves with SWAN: User Manual. Deltares, The Netherlands.
- Fahmi, M., and Hafli,T.M., 2019, Simulasi Numerik Perubahan Morfologi Pantai Akibat Konstruksi JJetty Pada Muara Lambada LHOK Aceh Besar Menggunakan Software Delft3D, Jurnal Teknik SIpil, Vol.8, No.2, 50-59
- Iswari, M.Y., and Anggraini, K., 2018, Demnas : Model Digital Ketinggian Nasional Untuk Aplikasi Kepesisiran, Oseana, Vol. XLIII, No.4, 68-
- Jones, O. P., O.S. Petersen, and H. Kofoed-Hansen, 2007, Modelling of complex coastal environments: Some considerations for best practice. Coastal Engineering, 54: 717-733.
- Lesser, G. 2009. An approach to medium-term coastal morphological modeling, PhD-thesis. Delft University of Technology, ISBN 978-0-415 -55668-2.
- Ranasinghe, R., Swinkels, C., Luijendijk, A., Roelvink, D., Bosboom, J., Stive, M., &Walstra, D, 2011, Morphodynamic upscaling with the MORFAC approach: Dependencies and sensitivities. Coastal Engineering, Vol.58, No.8, 806-811
- Syamsidik, Iskandar, A., and Rasyif, T. M., 2012, Chapter 13: Progress Of Coastal Line Rehabilitation After The Indian Ocean Tsunami Around Banda Aceh Coasts, Recovery from the Indian Ocean Tsunami: A Ten-Year Journey, Springer, Tokyo, pp. 175 – 189
- Triatmodjo, B., 1999, Teknik Pantai, Beta Offset, Yogyakarta.