
Abstrak
Aktivitas manusia di wilayah pesisir umumnya akan menyebabkan bertambahnya laju erosi, yang disebabkan oleh hilangnya perlindungan alami atau pembangunan struktur yang tidak sesuai. Pantai Dadap yang terletak di Kecamatan Juntinyuat, Indramayu, Jawa Barat merupakan salah satu lokasi yang mengalami permasalahan di atas. Pada tahun 2003, dibangun Pelabuhan Perikanan di Pantai Dadap, dengan struktur menjorok 200 m dari garis pantai untuk mencegah sedimentasi. Namun, pada saat ini telah terjadi pengendapan sedimen yang masif di kolam pelabuhan dan di belakang pelabuhan. Studi ini bertujuan untuk mengetahui pola sedimentasi di Pelabuhan Dadap, dan pengaruh struktur pelabuhan terhadap morfologi pantai, dengan menggunakan simulasi model numerik. Hasil studi ini menunjukkan bahwa keberadaan struktur pelabuhan telah menyebabkan difraksi gelombang yang membentuk aliran sirkulasi di belakang struktur pelabuhan dan di sekitar area pintu masuk ke kolam pelabuhan, yang menyebabkan terbentuknya tombolo di belakang pelabuhan dan sedimen dari arus sejajar pantai dan gerusan lokal memasuki area kolam pelabuhan. Selain itu, keberadaan struktur pelabuhan Dadap menyebabkan terhambatnya arus sejajar pantai sehingga suplai sedimen ke daerah sekitar pelabuhan berkurang dan laju erosi semakin meningkat..
Kata-kata Kunci : Erosi, morfologi pantai, model numerik.
1. Introduction
Changes in coastal areas in the form of coastal erosion, accretion and sedimentation according to Bird (1984), along the North Coast of Java have caused a lot of economic losses due to the large number of human
activities in coastal areas such as settlements, rice fields, ponds, tourist attractions or ports. In general, human activities in this coastal area will lead to a greater rate of erosion and tidal flooding due to the loss of natural protection in the form of mangrove forests or inappropriate construction of structures in coastal
areas. Dadap Beach, located in Juntinyuat District, Indramayu Regency, West Java Province is one of the locations experiencing problems above.
Many researchers (Ghasemizadeh et al 2013, Jackson et al 2015, Phanomphongphaisarn et al 2020, Suciaty et al 2020, Wahyudi et al 2022, Yola et al 2022) have been working on the structures along the coastal region by using numerical calculation. The sedimentation along the coastal region also have been calculating both measurement and prediction by Huda et al 2021, Jackson et al 2015 Mahmoodi et al 2020, Mustaqim et al 2021, Phanomphongphaisarn et al 2021, Wahygudi et al 2022, and Wibowo et all 2020 along the structures in the coastal region. In 2003, a Fishing Port (PPI) was built on Dadap Beach, with a structure that jutted 200 m from the shoreline, connected to the mainland by trestles supported by piles structure with a 1.5 m spacing to prevent sedimentation. However, currently there has been a massive sediment deposition in the port pool and the trestle structure area behind the port. In addition, in recent years after the existence of the port structure, the rate of coastal erosion around the port area is increasing and threatens the rice fields and settlements in the coastal area. Based on data from BBWS Cimanuk-Cisanggarung (PPK-03 2009, 2012, 2019), the decline in coastline due to coastal erosion/ abrasion on Dadap Beach, which is located to the southeast of the Dadap port, reached about 50 m in a period of 3 years (2018 – 2020), and caused inundation of rice fields and residential areas. This retreating coastline reaches a length of + 2.6 km.
2. Study Area
Dadap Beach is administratively located in Indramayu Regency, West Java Province. Dadap beach is a fine sandy beach, with a relatively gentle shallow water slope (average slope 0.02). Because it is located on the north coast of Java, the wave characteristic in this area is mostly fetch limited, by Kalimantan Island at north and numbers of small islands to the northwest. The wind direction at this location blows in 2 dominant seasons, called the east and the west wind season. The west wind season blows from December to March, while from April to November the wind blows from the west.
The land use around the Dadap beach is dominated by rice fields and settlements which are located very close to the coastline. Under these conditions, the effects of coastline retreat will have a major impact on the social and economic conditions of the location. On the coastline bordering residential areas, there is already a coastal protection structure in the form of a revetment and a sea wall made of stone and concrete material. However, at the location where the coastline is bordering the rice fields, there is still no protection (in 2021, breakwater was built), so the coastline is retreating significantly (Figure 1).
At the study area there is the Dadap river which empties close to the port location. This river is an outlet channel from the irrigation, with an average width of 10 m and 1.5 m depth in the upstream, and an
Figure 1. Layout of study area (2021)
average width of 20 m and 1 m depth in the downstream. This river has a fairly high sediment concentration of clay in the upstream, but at the estuary it is dom inated by sand material.
3. Data and Method
To analyze the hydromorphological conditions in the study area, a numerical model is used (Delft3D). The input data required for this modelling include wind data, wave data and river discharge data. The wind data used is hourly wind data obtained from the Indonesia-windprospecting.com website (2004-2015). This data is then processed into significant wave heights and periods using the hindcasting method from the Shore Protection Manual (SPM), 1986 (according to Sugianto 2012 and Nugroho et al 2019). Tidal data was obtained from the BIG-Tides website, in the form of hourly tide forecast data from 2007-2020. Since the model simulation will be carried out in 2004, the tidal data is first processed into tidal astronomical components using the least square method, and then used as model input. There is no record of discharge on the Dadap river. For the model input, discharge measurements were carried out using currenmeter set for 1 week in the dry/no rain period. The averaged results of these measurements are then used as input models with assumptions as the baseflow of the Dadap River. The sediment data used for this study also obtained from field sampling using sediment bottom grab. Another input that required for the model is bathymetry data. This data is obtained from 2009 measurement by BBWS Cimanuk-Cisanggarung. The overall flowchart of this study is shown at Figure 2.
3.1 Wind and wave
The wind at Dadap Beach blows seasonally from the northwest and southeast. The wind from the northwest occurs between December to March, while from April to November, the wind comes from the southeast. Overall from 2004 – 2015, the average wind speed at offshore of Dadap beach was 3.45 m/s with the dominant wind direction coming from the southeast. The windrose at Dadap Beach is shown in the Figure 3.
Fetch on Dadap beach is bounded by the islands of Kalimantan and Sulawesi to the north, northeast, and several small islands to the northwest (See Figure 4). The longest fetch is from the east and north, then
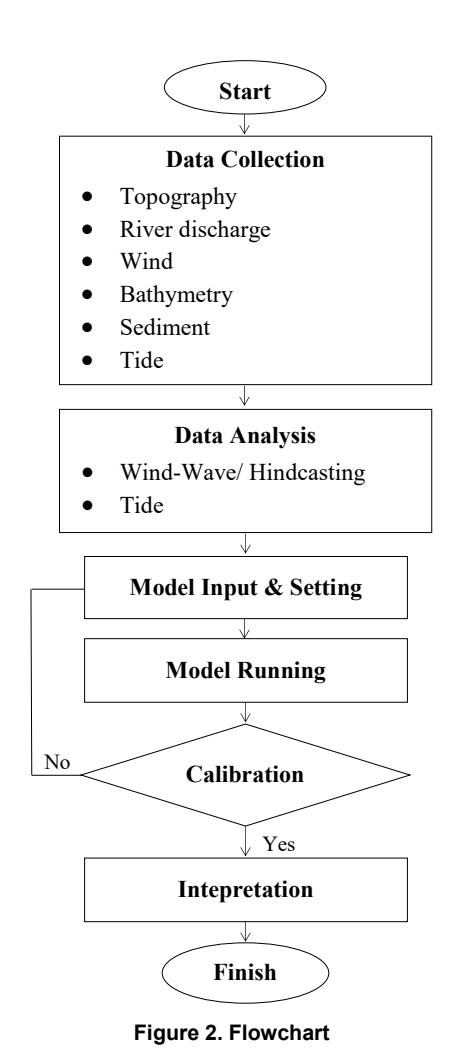
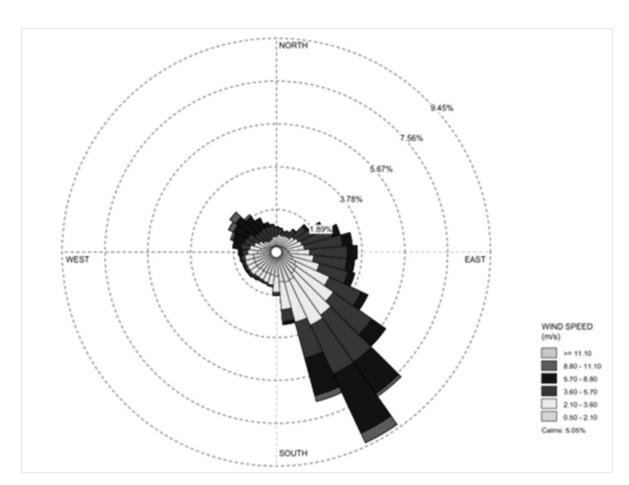
Figure 3. Windrose at study area
followed by the northeast, southeast and northwest. Fetch from the west, southwest and south has a very small length because it is directly adjacent to the coastline.
Dadap Beach topographically has a coastline facing northeast. Due to this topographical condition, winds originating from the southeast, south and southwest on Dadap Beach will not generate waves towards Dadap Beach, so that the dominant waves on Dadap Beach are
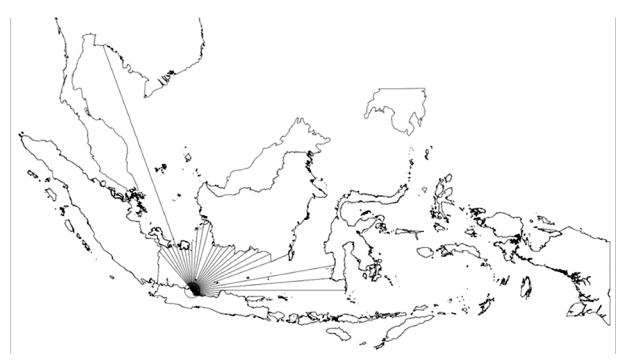
Figure 4. Fetch at study area
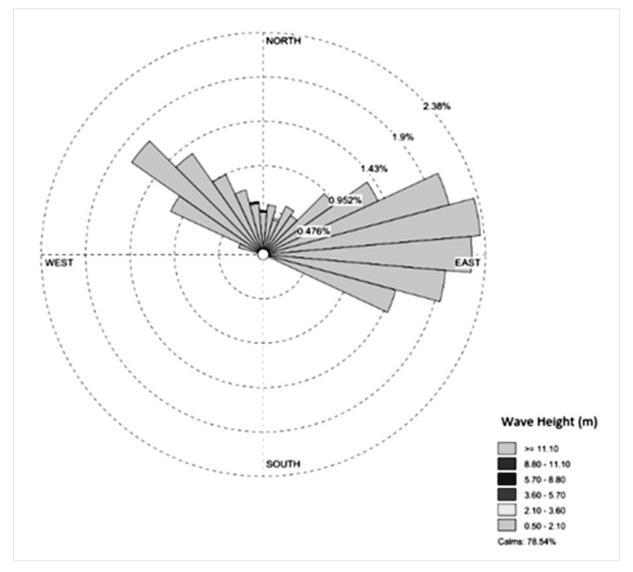
Figure 5. Waverose and significant wave at study area
from the east, northeast, northwest and north. (See Figure 5).
3.2 Tide
The tidal data used in this study is obtained from satellite data on the BIG-Tides website, which is an estimated hourly tidal height data. The data used were taken from 2007 to 2020. The tidal harmonic component was calculated using the Least Square method, which was then used for calculating the elevations parameter of tides and formal numbers. From the calculation results, it is found that the tidal type on Dadap Beach is mixed semi diurnal (formzal number 1.09) with tidal height of 1.003 m. The Tide Elevation Parameter at Dadap Beach are shown in Table 1, and the Dadap Beach Surface Elevation at Januari 2012 are shown in Figure 6.
3.3 River discharge and sediment sampling
Dadap river discharge was obtained from measurements on September 1 to 7, 2021 using currentmeter set. The measurement location is approximately 1 km upstream of estuaries. The measurement result that the average discharge of Dadap river was 0.8 m3 /s. This measurement was carried out in conditions of no rain in
Table 1. Tide elevation parameter
| No. | Important Tide Elevation | Elevasi (m) |
|---|---|---|
| 1 | HHWL (Highest high water level) | 0,474 |
| 2 | MHWL (Mean high water level) | 0,395 |
| 3 | MSL (Mean sea level) | 0,000 |
| 4 | MLWL (Mean low water level) | -0,398 |
| 5 | LLWL (Lowest low water level) | -0,474 |
| 6 | LAT (Lowest Astronomical Tide) | -0,529 |
| 7 | F= 1,09 (Mixed Semi Diurnal) |
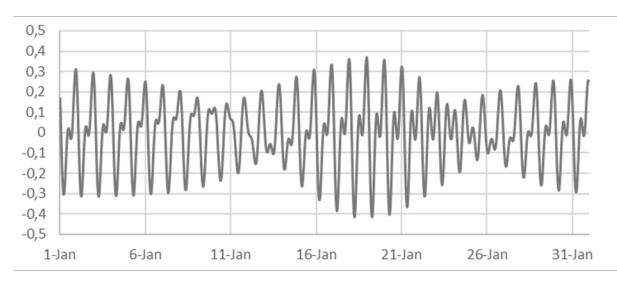
Figure 6. Dadap beach surface elevation Januari 2012 (BIG Tides)
the catchment area of the river, so it is assumed as baseflow discharge of Dadap river.
The sediment data in this study also obtained from field sampling. Sampling was carried out at 8-point location spread across the Dadap beach, Dadap port pond, river estuary, and Dadap river. The laboratory test of sediment sample results that the distribution of sediment grain size at Dadap Beach and the river estuary are fine to coarse sand with D50 ranging from 0.119 to 0.229 mm. In the port pond the sediment grains size is fine silt with D50 ranging from 0.003 to 0.01 mm. While in the Dadap river (about 1 km from the estuary) the sediment is clay, with a D50 of 0.001 mm.
3.4 Bathymetry
The bathymetry data used in this study is the 2009 measurement data obtained from BBWS Cimanuk-Cisanggarung (See Figure 7). The measurement data
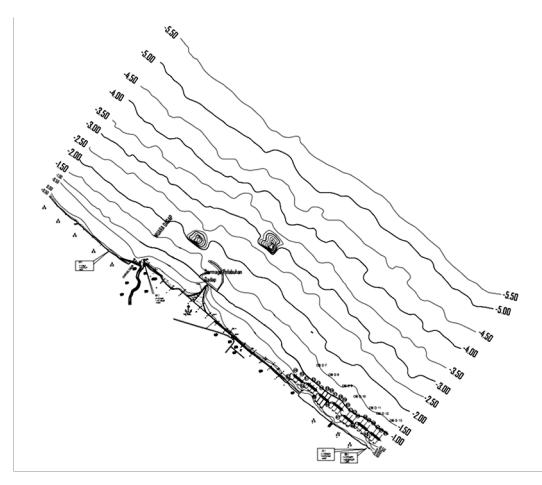
Figure 7. Dadap beach bathymetry
obtained are in the elevation range of +1 m to -5.5 m (from LWS, -0.67 MSL), with a transverse distance ranging from 1.5 km to the coastline. From this data, it can be concluded that Dadap Beach has a relatively gentle transverse beach profile, with an average slope of 0.02. In this measurement data, Dadap Port has already experienced sedimentation and form a tombolo behind the port structure.
3.5 Model input & setting
Delft3D numerical was made in 2 scenario, 1st scenario is Dadap beach with port structure, and 2nd scenario is Dadap beach without port structure. The model domain is made in a curvilinear grid with grid sizes varying from 3x3 m to 30x30 m. The boundary conditions used for this model are the tides (offshore boundary), and the Neuman boundary conditions with 0 values time series (at both lateral boundary), and daily river discharge. The wave input in this model is taken from the north direction, which form an oblique wave in 45 degree clockwise direction to the coastline (See Figure 8). To speed up the simulation time, the model in scenario 1 is multiplied by a morphological scale of 100, which means that each time step of the modeling of morphological changes is multiplied by 100. This modeling scale only applies to morphological changes while for hydrodynamic changes (speed and direction of flow) it remains the same as modeling input (not multiplied by scale).
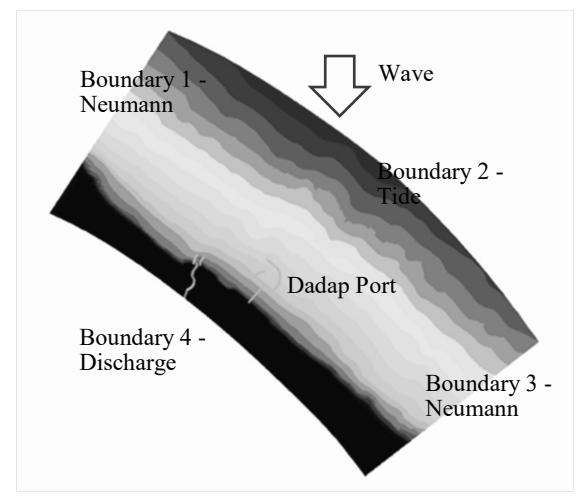
Figure 8. Delft3D model input
4. Result and Discussion
From the 1st scenario model, it is found that the cause of the tombolo formation is because the wave energy is reduced by the presence of the port structure. Figure 9 shown the current and sediment pattern around the Dadap Port. Waves that come obliquely from the shoreline cause longshore currents in shallow water, but behind the port structure these currents experience a significant reduction in speed. For example, from the results of 1st scenario model with waves from the north (Hs = 0.42 m, Tp = 2.93 s), the average longshore current velocity in the west of the port is 0.117 m/s, while the
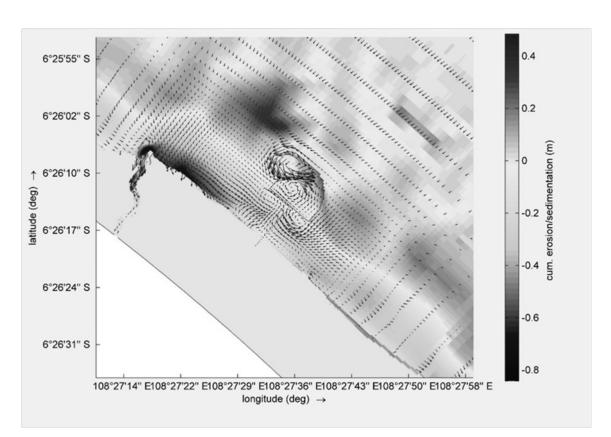
Figure 9. Current and sediment/ erosion pattern around Dadap port
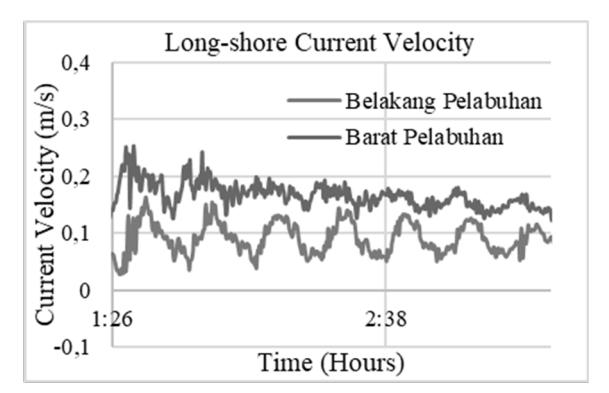
Figure 10. Long-shore current velocity beside and behind Dadap port
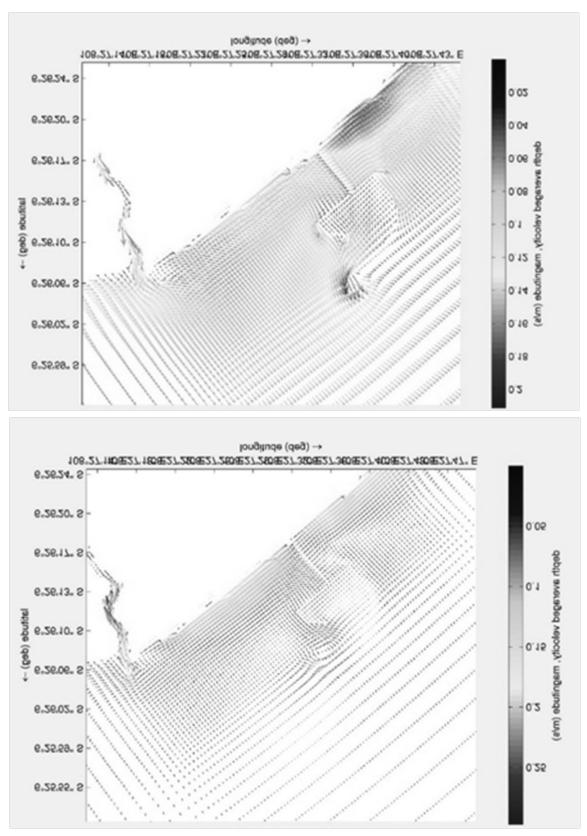
Figure 11. Sediment transport mechanism from Dadap river
average longshore current velocity behind the port is drops significantly to 0.063 m/s. (See Figure 10).
The velocity reduction of the long-shore current behind the port structure is caused by the presence of currents that are diffracted by the port structure (at both ends of the structure) which tend to form a current circulation/ turbulence in the area behind the port. This current circulation when interacting with the longshore current causes the long-shore current speed to decrease significantly. This phenomenon will form a cuspate on the shoreline and occur continuously so that over time it forms a tombolo.
In the port pond area, the sediment supply source is a mixture of sediment grains from the Dadap river, longshore currents, and local scour around the tip of the port breakwater. This can be confirmed from the sediment sample test results which show various gradations between sand, clay, and silt.
The Dadap River at low tide will provide a supply of sediment in front of the river mouth, which is then carried away by long-shore currents during high tide conditions, partly back into the river and partly towards the pond and port trestle (See Figure 11). This mechanism will occur when the wind and waves come from the northwest and north.
To determine the effect of the port structure on the coastal area that is experiencing erosion (southeast of
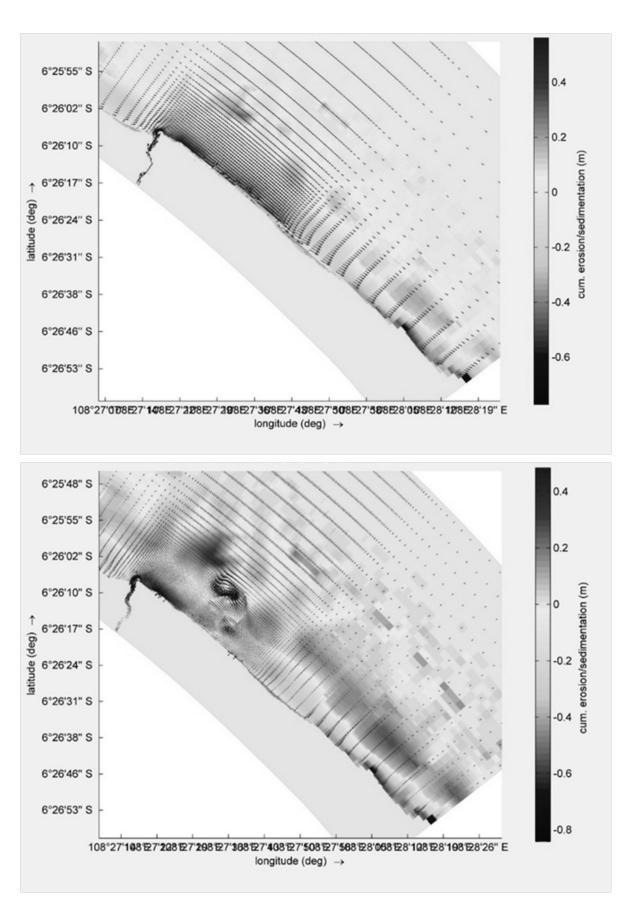
Figure 12. Sediment transport before and after the existence of Dadap port
the port), 2nd scenario is made, by eliminating the whole port structure at Dadap beach, so that changes in current patterns and trends of erosion/sedimentation before the existence of the port can be known.
From the modeling results, it can be seen that there is no significant change in current pattern and velocity between conditions before and after the port existence, but with an increasing tendency for erosion to occur (See Figure 12). From this result, it can be concluded that the increase of erosion rate at the south-east side of the Dadap port is due to the disruption of sediment transport caused by the presence of the port structure. The sediment supply from the northwest that brought by long-shore current is blocked by the port structure, resulting in a reduction in the supply of sediment and an increase in the rate of erosion.
5. Conclusion
- 1. The existence of port structure on Dadap Beach, Indramayu Regency causes wave diffraction and current circulation/ turbulence behind the port which results long-shore current velocity reduced significantly.
- 2. From the modelling results with the wave direction from the north (Hs = 0.42 m, Tp = 2.93 s), the average longshore current velocity behind the port structure is reduced about 53.84% (from 0.117 m/s to 0.063 m /s) and causes sediment to settle behind the port structure.
- 3. The increase of erosion rate at coastal area southeast from Dadap port is due to the reduced sediment supply from the north-west which is blocked by the port structure.
References
- Bird, E., C., F., 1984, An Introduction to Coastal Geomorphology, Third Edition.
- Beselly Putra, S. M., Suharyanto, A., & Pujiraharjo, A., 2017, Simulasi Numeris Perubahan Morfologi Dasar Laut Pada Desain Pelabuhan Di Kabupaten Gresik, Indonesia, Jurnal Teknik Pengairan: Journal of Water Resources Engineering, 8(1), 130–138. https:// doi.org/10.21776/ub.jtp.2017.008.01.13
- Galvin, C.,J., 1968, Breaker type Classification on Three Laboratory Beaches. J. Geophys. Res. 73: 12 3651-9. https://doi.org/10.1029/ JB073i012p03651
- Ghasemizadeh, N., Tajziehchi, M, 2013, Impact of Long Jetties on Shoreline Evaluation (Case Study: Eastern Coast of Bandar Abbas), J. Basic. Appl. Sci. Res., 3(3)1256-1266, 2013, ISSN 2090-4304, https://www.textroad.com/ pdf/JBASR/J.%20Basic.%20Appl.%20Sci.% 20Res., %203(3)1256-1266,%202013.pdf
- Huda, A. C., Laksono, R., Dewi, A. V. R., Harahap, R. G. ., Nurwati, N., Rahayuningsih, S. ., Putri, D. L. ., Dianiswara, A. ., & Wirawan, M. K., 2021, Sedimentation Rate Analysis in Dock C PT. Petrokimia Gresik, Indonesia. Indonesian Journal of Earth Sciences, 1(2), 74-83. https:// doi.org/10.52562/injoes.v1i2.237
- Jackson, N., L., Harley, M., D., Armaroli, C., Nordstrom, K., F.. 2015,. Beach morphologies induced by breakwaters with different orientations. Geomorphology. 239: 48–57. Bibcode: 2015 Geomo. 239…48J. https:// doi.org/10.1016/j.geomorph.2015.03.010
- Mahmoodi, A., Neshaei, M., A.. L., Mansouri, A., and Bejestan, M. S., 2020, Study of Current- and Wave-Induced Sediment Transport in the Nowshahr Port Entrance Channel by Using Numerical Modeling and Field Measurements, Journal of Marine Science and Engineering 8, no. 4: 284. https://doi.org/10.3390/jmse8040284
- Mustaqim, R., Widyaningtias, Pratama, M., B., Suryadi, Y., Nugroho, E., O., Kardhana, H., Bumi, I., S., Analisis Sedimentasi Dengan Penerapan Permeable Structure Di Pantai Bedono, Kabupaten Demak, Jawa Tengah, Prosiding Pertemuan Ilmiah Tahunan (PIT) HATHI ke-38 Surabaya, 30 Oktober 2021, https://hathi-pusat.org/blog/detail/pit38-hathi-2021-surabaya-prosiding
- Nugroho, E. O., Moniaga, B. A., Suciaty, F., Chrysanti, A., , Harlan D., and Kusuma, M. S. B., 2019. Comparative study on wave hindcasting using wind downscaling data at Bojong Salawe Beach, The 2nd Conference for Civil Engineering Research Networks (ConCERN-2 2018), MATEC Web Conf., 270 (2019) 04024 DOI: https://doi.org/10.1051/ matecconf/201927004024
- Phanomphongphaisarn, N., Rukvichai, C., and Bidorn, B., 2020, Impacts of Long Jetties Construction on Shoreline Change at the Western Coast of the Gulf of Thailand, Eng. J., vol. 24, no. 4, pp. 1-17, Jul. 2020. DOI: https://doi.org/10.4186/ ej.2020.24.4.1
- PPK-03 Perencanaan dan Program, Satker Balai Besar Wilayah Sungai Cimanuk- Cisanggarung, Direktorat Jenderal Sumber Daya Air, Kementerian Pekerjaan Umum dan Perumahan Rakyat, 2009, Laporan Akhir, Detail Desain Pengaman Pantai Glayem dan Dadap Kabupaten Indramayu.
- PPK-03 Perencanaan dan Program, Satker Balai Besar Wilayah Sungai Cimanuk- Cisanggarung, Direktorat Jenderal Sumber Daya Air,
- Kementerian Pekerjaan Umum dan Perumahan Rakyat, 2012, Laporan Akhir, Detail Desain Breakwater Dadap Kabupaten Indramayu.
- PPK-03 Perencanaan dan Program, Satker Balai Besar Wilayah Sungai Cimanuk- Cisanggarung, Direktorat Jenderal Sumber Daya Air, Kementerian Pekerjaan Umum dan Perumahan Rakyat, 2019, Laporan Nota Desain, Review Desain Pengaman Pantai Dadap, Kabupaten Indramayu.
- Suciaty, F., Dharmawan, Z., Nugroho, E. O., 2020, Hydrodynamics Modelling for Dock Layout Planning in Fish Landing Port (PPI) Api-Api, East Kalimantan, Vol. 2020: International Conference On Green Technology And Design (ICGTD), p 19-26 https://eproceeding.itenas.ac. id/index.php/icgtd/article/view/97/89
- Sugianto, D., N., 2012, Model Distribusi Data Kecepatan Angin dan Pemanfaatannya dalam Peramalan Gelombang di Perairan Laut Paciran, Jawa Timur. Ilmu Kelautan: Indonesian Journal of Marine Sciences, 15 (3), 143-152 (https:// doi.org/10.14710/ik.ijms.15.3.143-152)
- Sullivan, D., 2001, Coastal Geological Materials. National Park Service.
- US Army Corps of Engineers. 1984. Shore Protection Manual, Volume I. Washington D.C., Government Printing Office.
- US Army Corps of Engineers. 1984. Shore Protection Manual, Volume I. Washington D.C., Government Printing Office.
- Wahyudi, N. R., Wahyudi, S. I., Husni, F., and Subagyo, A., 2022, Wave and sedimentation simulation of jetty construction to protect estuary, case study in Batang, Indonesia, IOP Conf. Ser.: Earth Environ. Sci. 955 012006, https://doi.org/ 10. 1088/1755-1315/955/1/012006
- Wibowo, M., Hendriyono, W., Rahman, R., A., Susatijo, G., Kongko, W., Istiyanto, D., C., Widagdo, A., B., Nugroho, S., Khoirunnisa. H., Wigunam, E., 2020, Sediment Transport Modeling at Jelitik Estuary, Sungailiat - Bangka Regency for the Design of Sediment Control Structures, Journal of Physics: Conference Series, Volume 1625, 2nd International Conference on Sustainable Infrastructure 28 - 29 October 2019, Yogyakarta – Indonesia, J. Phys.: Conf. Ser. 1625 012042, https://doi.org/10.1088/1742-6596/1625/1/012042
- Yola, Yuanita, N. , Kurniawan, A., Nugroho, E., O., Martin, R., J., Muhammad, I., F., Wijaya, F., S., and Fauzi, N., 2022, Coastal protection system design at the Indonesian Mangrove Center in
Pekalongan, Central Java - Indonesia, IOP Conf. Ser.: Earth Environ. Sci. 1065 012062, https:// doi.org/10.1088/1755-1315/1065/1/012062
The Effect of Dadap Port Structure in Indramayu...