
Abstrak
Banjir di wilayah Toli-toli sering terjadi akibat terus berkurangnya lahan resapan. Peristiwa banjir dari tahun ke tahun memberikan dampak yang lebih besar dan menimbulkan banyak kerugian. Dampak banjir ini perlu dianalisis dan diprediksi besarannya sehingga potensi banjir dapat diperkirakan. Penanganan banjir dapat diatasi sejak dini sehingga ketika terjadi banjir kerugian yang ditimbulkan tidak begitu besar. Prediksi banjir dapat dilakukan dengan analisis hidrologi menggunakan HEC HMS 4.5 dan dilanjutkan hidrolika menggunakan HEC RAS 5.0.3. Berdasarkan kejadian hujan selama 10 tahun terakhir, diketahui periode ulang hujan di wilayah Toli-toli bervariasi mulai dari periode 2 tahun, 5 tahun, 10 tahun, dan 15 tahun. Berdasarkan hasil perhitungan diketahui banjir di wilayah Toli-toli periode ulang 2 tahun mempunyai kedalaman 0,66 meter dengan luas genangan banjir seperti terlihat pada Gambar 7 artikel ini. Dalam mengatasi banjir ini perlu dilakukan upaya penanganan dengan beberapa alternatif seperti memperbanyak lahan resapan, normalisasi sungai, dan lain sebagainya.
Kata Kunci: Prediksi banjir, Toli-toli, hidrologi, topografi
1. Introduction
Changes in land use in a watershed will hurt harm all aspects of hydrology (Roy dan Islam, 2019). The reduction in infiltration land can cause a very high increase in runoff discharge (Butler and Davies, 2014). The increasing quantity of surface water can cause potential flooding in some areas in the watershed (Dong, at. Al., 2019). Flash floods or the so-called rapid flow of surface water, it is very dangerous and very deadly (Javier and Smith, 2010). In some areas affected by this flash flood, it was noted that the losses caused were very large and caused many casualties (Peng, at. Al., 2018).
The increase in runoff discharge can be detrimental for the downstream area (Zhang and Singh, 2005). This will be very large if the downstream area is very densely populated or in urban areas (Zischg, at. Al., 2021). The current climate change will cause so many changes in hydrological conditions that occur so that humans must adapt to this (Zhang and Singh, 2006). The current runoff discharge occurs in large quantities so that the potential for landslides and river erosion is very likely to occur (Xiao, at. Al., 2019).
One of the areas affected by flash floods is the Indonesian Toli-Toli area. Toli-toli is one of the districts in Central Sulawesi, Indonesia. This district has an
* Penulis Korespondensi: riki.chandra@eng.unila.ac.id
area of 4,079.77 km<sup>2</sup> and a population of 220,411 in 2020 (Wikipedia online, 2021). On Sunday, October 24, 2021, there has been a flash flood in the Toli-toli area which is very dangerous and has caused a lot of material and moral losses (Sangalu online, 2021).
This change in hydrological conditions needs to be anticipated so that when the flood arrives, the community will be able to adjust (Shabani, at. Al., 2021). This global climate change certainly needs to do the latest hydrological studies so that all impacts that occur can be estimated, and that the community can anticipate them immediately (Xiong, at. Al., 2018). Therefore, this research is very helpful in estimating the impact of floods that occurred in the Toli-toli area, Indonesia.
2. Method
Hydrology is a cycle consisting of evaporation, precipitation, surface runoff, infiltration, evapotranspiration, groundwater flow, and other events that support the occurrence of rain (Njogu and Waita, 2021). In this hydrological analysis, the main data needed is rainfall data that affects the Toli-Toli Regency area. Based on the survey data, it is known that the nearest station is the Sultan Bantilan Meteorological Station which is located at the coordinates of latitude: 1.12114 and longitude: 120.79433. Rainfall data for the last 10 years is used in this study. The rainfall data is then determined by the maximum daily value in each year. Rainfall data will be processed statistically by determining the average value, standard deviation, coefficient of skewness or skewness, coefficient of kurtosis using the equation (Subramanya, 1995):
\[\bar{x} = \frac{\sum x}{n}\] determine the average value
\[Std(x) = \sqrt{\frac{(x - \bar{x})^2}{n - 1}}\]
determine the standard deviation
\[Cs = \frac{n\sum (x - \bar{x})^3}{(n-1)(n-2)(std(x))^3}\]
determine the coefficient of skewness
\[Ck = \frac{n^2 \sum (x - \bar{x})^4}{(n-1)(n-2)(n-3)(std(x))^4}\]
determine the coefficient of kurtosis
Furthermore, the appropriate method of calculating the return period of rain is determined. Based on the results of the analysis, it is known that one of the appropriate methods in calculating the return period of rain is the Gumbel analysis method (Guo and Markus, 2011). Gumbel analysis can be used using the equation:
Gumbel equation that is often used in practice is.
\[x_T = \bar{x} + K\sigma_{n-1}\]
Where:
\(\sigma_{n-1}\) = standard deviation of the number of samples
\[N = \sqrt{\frac{\sum (x - \bar{x})^2}{N - 1}}\]
\[K = \text{frequention factors} = \frac{y_T - \overline{y_n}}{S_n}\]
\(v_T\) = variasi reduksi =
\[-\left[\ln \ln \frac{T}{T-1}\right] = -\left[0.834 + 2.303 \log \log \frac{T}{T-1}\right]\]
\(S_n = \text{from table}\)
\(\bar{y}_n = \text{from table}\)
After determining the maximum rain return period for 2 years, 5 years, 10 years, and 15 years. The rainfall data for the return period is then analyzed for hourly rainfall forecasts using the equation (Chow and Te, 1994):
\[R_t = R_0 \left(\frac{5}{T}\right)^{2/3}\]
\(R_t\) = the average rain from the beginning to the T hour
T = rainy time from the beginning to the T hour
\(R_{24}\) = daily effective rain (net rain causing runoff)
Furthermore, to determine the amount of rainfall at hour T, the following equation can be used (Chow and
Te, 1994): \[R_{T} = t.R_{t} - (t-1)R_{(t-1)}\] \[R_{0} = \frac{R_{24}}{5}\] Where:
\(R_T\) = amount of precipitation in hours to T t = rainy time from start to hour to T
\(R_t\) = average rainfall from start to hour to T
\(R_{(t-1)}\) = the average rainfall from the beginning to the hour to (t-1)
Furthermore, the rain data is inputted into the hydrological model for further analysis of the surface runoff that occurs (USACE, 2000). several other methods are used to support the hydrological analysis carried out such as analysis of land-use change (SCS Curve Number), flow concentration time, and so on (Chow and Te, 1994).
3. Result and Discussion
The watershed that affects the Toli-toli district is the watershed which has an area of around 98.4 km2. The watershed is illustrated in the following Figure 1.
The area of the watershed is divided into several parts, each of which has an area as shown in the following Table 1.
Based on the results of Gumbel's analysis and calculated hourly rainfall estimates based on the return period of rain as in the following Table 2.
Figure 1. The watershed of Toli-toli
Table 1. Area of subbasin
| Subbasin Name | Area (Km2 ) |
|---|---|
| Subbasin-13 | 4.6 |
| Subbasin-12 | 3.6 |
| Subbasin-2 | 4.8 |
| Subbasin-1 | 2.8 |
| Subbasin-3 | 2.6 |
| Subbasin-4 | 2.44 |
| Subbasin-9 | 2.76 |
| Subbasin-5 | 1.58 |
| Subbasin-6 | 0.94 |
| Subbasin-7 | 1.5 |
| Subbasin-10 | 2.76 |
| Subbasin-8 | 1.96 |
| Subbasin-11 | 1.59 |
The rain pattern for 10 years in the Toli-toli watershed can be shown in the graph (Figure 2).
The 10-year rainfall pattern in the Toli-toli watershed looks very irregular and seems extreme at certain times. The land use conditions in the Toli-toli watershed are mostly forest and grassland. Initial loss, constant loss, and impervious are determined based on land use conditions in the Toli-toli watershed. Based on the conditions of the Toli-toli watershed, the coefficient values are set as in the following Table 3.
Increase watertight conditions in each subbasin indicates how much catchment area is available. The surface runoff will gather in the river to then flow towards the downstream area. The travel time of this flow is indicated by the time of concentration value in each subbasin. The time of concentration and time lag values are shown in the following Table 4.
Several analyzes were then carried out to determine the time lag in each river and perform other hydrological
Table 2. The return period of rainfall
| Time | Rainfall (mm) | |||
|---|---|---|---|---|
| (hour) | 2 | 5 | 10 | 15 |
| 1 | 11.27 | 39.59 | 69.53 | 78.24 |
| 2 | 3.11 | 10.92 | 19.18 | 21.58 |
| 3 | 1.94 | 6.83 | 11.99 | 13.49 |
| 4 | 1.55 | 5.46 | 9.59 | 10.79 |
| 5 | 1.55 | 5.46 | 9.59 | 10.79 |

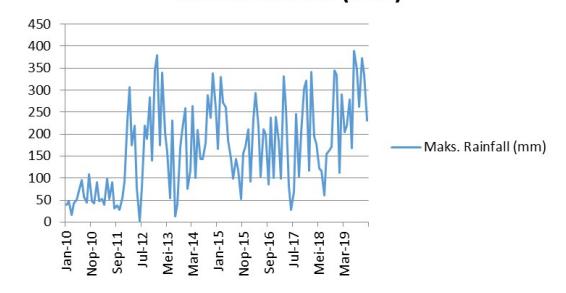
Figure 2. Maximum rainfall in the watershed at 10 years
Table 3. Initial loss and impervious in the subbasin
| Subbasin Name | Initial Loss (mm) | Constant Loss (mm/hour) | Impervious (%) |
|---|---|---|---|
| Subbasin-13 | 460 | 230 | 15 |
| Subbasin-12 | 360 | 180 | 15 |
| Subbasin-2 | 480 | 240 | 15 |
| Subbasin-1 | 280 | 140 | 15 |
| Subbasin-3 | 260 | 130 | 15 |
| Subbasin-4 | 244 | 122 | 15 |
| Subbasin-9 | 276 | 138 | 15 |
| Subbasin-5 | 158 | 79 | 15 |
| Subbasin-6 | 94 | 47 | 15 |
| Subbasin-7 | 150 | 75 | 15 |
| Subbasin-10 | 276 | 138 | 15 |
| Subbasin-8 | 196 | 98 | 15 |
| Subbasin-11 | 159 | 79.5 | 15 |
Table 4. Time of concentration and time lag in the subbasin
| Subbasin Name | Time of Concentration (Hour) | Time Lag (Hour) |
|---|---|---|
| Subbasin-13 | 0.11390 | 0.068340 |
| Subbasin-12 | 0.09431 | 0.056585 |
| Subbasin-2 | 0.11769 | 0.070616 |
| Subbasin-1 | 0.07772 | 0.046630 |
| Subbasin-3 | 0.07341 | 0.044043 |
| Subbasin-4 | 0.06990 | 0.041941 |
| Subbasin-9 | 0.07686 | 0.046116 |
| Subbasin-5 | 0.05002 | 0.030013 |
| Subbasin-6 | 0.03354 | 0.020121 |
| Subbasin-7 | 0.04806 | 0.028836 |
| Subbasin-10 | 0.01692 | 0.010149 |
| Subbasin-8 | 0.00999 | 0.005994 |
| Subbasin-11 | 0.00728 | 0.004370 |
analyzes to obtain the discharge value and hydrograph shape at the control point. Based on this hydrological analysis, the outflow discharge from the Toli-toli watershed is obtained as shown in the following Figure 3.
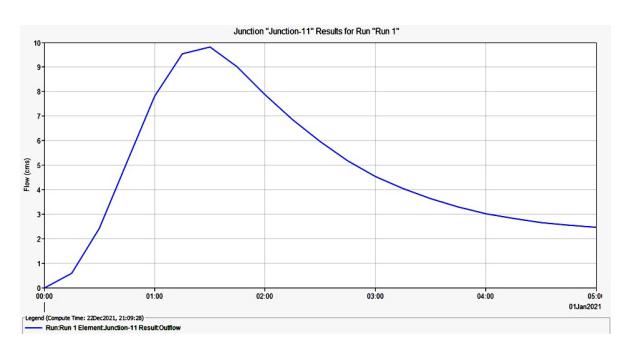
Figure 3. 2 year return period flow discharge
In the 2-year return period, the peak discharge reaches 9.8 m3 /s. As for the 5-year return period, it can be seen in the following hydrograph (Figure 4).
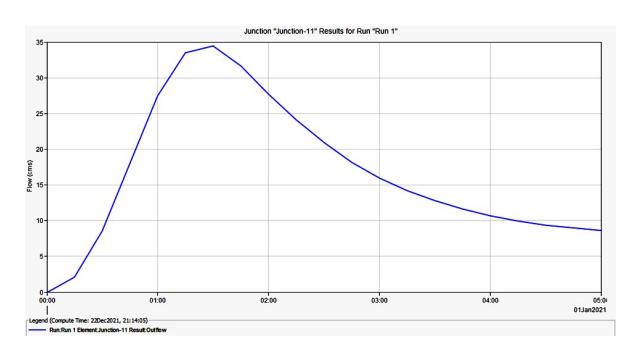
Figure 4. 5 year return period flow discharge
In the 5-year return period, the peak discharge reaches 34.5 m3 /s. As for the 10 year return period, it can be seen in the following hydrograph (Figure 5).
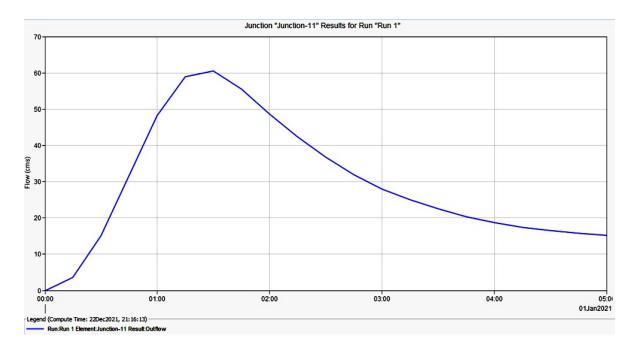
Figure 5. 10 year return period flow discharge
In the 10 year return period, the peak discharge reaches 60.5 m3 /s. As for the 15 year return period, it can be seen in the following hydrograph (Figure 6).
In the 15 year return period, the peak discharge reaches 68.1 m3 /s. The largest maximum water quantity in this 15 year return period must of course be adjusted to the
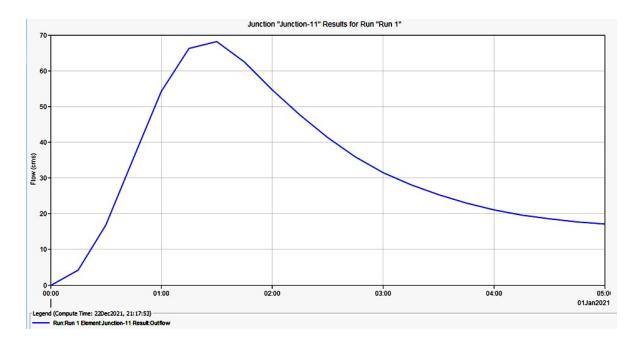
Figure 6. 15 year return period flow discharge
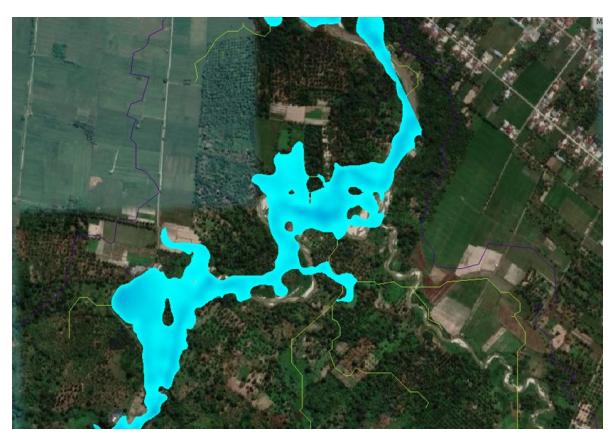
Figure 7. Flood Inundation Area on the Toli-toli River in a 2-Year Period
existing river capacity. Based on the results of hydraulic analysis on the cross-section of the Toli-toli river, it can be seen that there is a very large overflow of water every time it rains. The overflow can be seen as in the following image (Figure 7).
The picture above is the condition at 2 year return period which looks like an overflow occurs. Based on this condition, it can be seen that at the lowest return period the river has overflowed, of course at higher return times the overflow will be even greater. The depth of the water can be seen in the graph below (Figure 8).
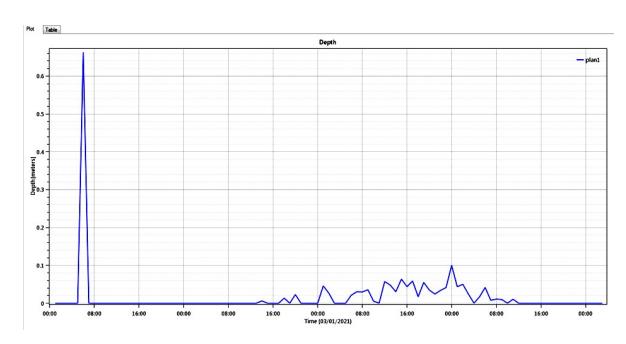
Figure 8. Prediction of water depth at flow rate return period of 2 years
Based on the graph above, it can be seen that the depth of the flood in the 2-year return period is around 0.66 meters. This shows that flood awareness for the river
border needs to be increased. To overcome this condition, it is necessary to anticipate immediately by making some improvements to the cross-section of the river or other hydrological conditions the upstream.
4. Conclusion
- 1. It is predicted that the overflow of river water will certainly occur during the smallest return period of rain. The capacity of the river is no longer able to channel runoff discharge in the watershed. In the 2 year return period, the river has overflowed and has the potential to flood, this will certainly be greater in the 5-year, 10-year, and 15-year return periods. Thus, flooding in the Toli-toli area is an unavoidable event (Wijaya and Lasminto, 2016).
- 2. It is recommended that in dealing with flooding in the Toli-toli area, it is necessary to immediately normalize the river, enlarge the infiltration area upstream to downstream, as well as several other engineering techniques to reduce runoff discharge or increase the river's storage capacity (Chao and Wang, 2017).