
1. Introduction
Flood inundation disrupts the lives and livelihoods of residents. In Indonesia, flood is one of the major natural disasters, and the frequency has increased over the past few years (Moe, dkk., 2015). The Serayu River always causes floods every year. The location of the flood is in the Banyumas and Cilacap districts, resulting in losses of tens of billions of rupiah due to damage to people's houses, agricultural land, as well as other public interest facilities (Hernanda, dkk., 2016). Based on this, a study related to flooding is important to do. The location of this research focuses on the Banyumas and Cilacap District in the Downstream Serayu River Basin. December 2020 was one of the major flood events that hit the location. Based on field interviews in one of the sub-districts in the study location, namely Kebasen sub-district and Rawalo subdistrict, especially those around the confluence of the main river with the Tajum tributary, farmers complained of flooding as high as 2m on their agricultural land, resulting in crop failure. Resident houses located at a higher elevation or far enough from the river affected by flooding are about 1m, while houses on the riverbank located in Banjarparakan are affected by floods up to 2m.
It is a worrying thing if there is a big flood similar to or even bigger than the flood incident to the residents of Banyumas and Cilacap district in Downstream Serayu River Basin. One alternative to overcome this problem is to conduct a risk analysis (Farid, at al., 2020), so that it can help stakeholders to determine steps and priorities for flood disaster management. Based on the above explanation then the objective of this study is to develop a flood risk map on Banyumas and Cilacap District in Downstream Serayu River Basin. In this research, the flood risk assessment consists of three components, namely hazard, vulnerability, capacity. The hazard map, vulnerability map, and capacity map are overlaid by using ArcGIS to produce flood risk maps.
Floods in this research are defined as streams that flow beyond the capacity of the river (Asdak, 2007), so it overflows to the side inundating the surrounding area. There are some of the factors that cause flood including heavy rainfall, decreased drainage or river capacity, topographic conditions, changes in land use/cover, and tidal effects (Farid, 2017). The hazard assessment is commonly used to determine the danger level of the flood (Koks, 2015). The modeling of flood level can be approached by the numerical model as the common tools. Vulnerability assessment is the characteristics and situations of a community, system, or asset that make them susceptible to the adverse effects of a hazard (UNISDR, 2009). The capacity parameter is related to the measurement of indicators of achieving regional resilience to face the disasters, in this case flooding.
2. Study Case Location
Parts of the Banyumas District and Cilacap District, Central Java Province, Indonesia, are included in the Downstream Serayu River Basin. It is part of the
Serayu Basin that geographically located between 7° 10'-7°41' south latitude dan 108°55'-109°06' east longitude. Map of the research location as in figure 1. The coverage of the Downstream Serayu River Basin area is starting from the Serayu Motion Weir (BGS) to the estuary. The river flows as far as 28.49 km² with the area of 233.77 km².
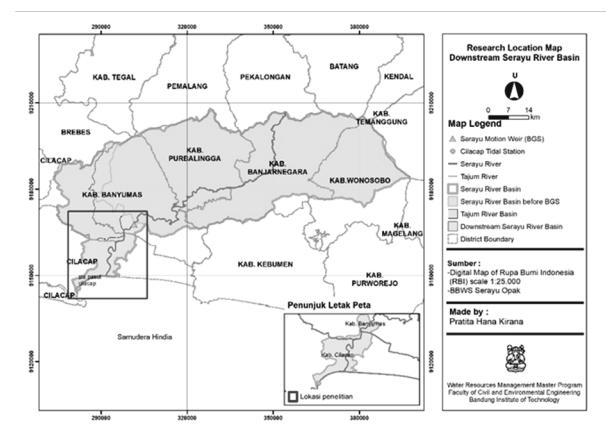
Figure 1. Map of research area
3. Material and Method
3.1 Data for flood modeling
To model the discharge flow, some data from the relevant agencies needed. is use of the latest data is highly suggested to obtain adequate flood control infrastructures (Farid, 2021). In this study, for the hazard component, the required data include; daily rainfall data 2002-2020 (19 years) that is obtained from five rain stations scattered in Serayu Basin, daily discharge data at Serayu Motion Weir (BGS) 2001-2020, tidal measurement data of March-April 2021 from Cilacap station, cross section river from BGS to estuary, and research location spatial data. All of the data is obtained from Balai Besar Wilayah Sungai (BBWS) Serayu Opak, Ministry of Public Work and Housing (PUPR) Indonesia. MERIT DEM is also used which is obtained from http:// hydro.iis.u-tokyo.ac.jp/~yamadai/ MERIT DEM/ [22]
3.2 Data processing for flood modeling
The first step is hydrology analysis for river discharge in both the main and tributary rivers. The data used is daily rain data for a period of 19 years from 2002 to 2020 at five rain stations scattered around the Serayu basin. Calculation of the area's average rain using Thiessen polygons. Then frequency analysis to get the selected design rain using a 50-year return period. Using the Alternating Block Method (ABM) to create a hyetograph plan from the IDF curve. The daily rain intensity will be converted into hourly rain intensity using the Mononobe formula. Calculation of Effective Rain with SCS CN method is used (Chow, 1988). Design flood discharge analysis using HSS use Snyder, Nakayasu, ITB 1, ITB 2 Synthetic Unit Hydrograph (SUH) technique.
After several parameters have been calibrated according to each theoretical basis, then the SUH closest to the 50 year return period measurement discharge at the Serayu Weir will be used. Rainfall datasets input is essential for flood runoff generation (Farid, 2011). Flood simulation uses discharge design for 50-year return period of flood. The location of this study consists of two regencies, namely Banyumas Regency and Cilacap Regency, both of which are included in the province of Central Java. based on the Fundamentals of the 2017 Flood Infrastructure Planning Module of the PUPR Ministry. Determination of the planned flood discharge based on economic considerations and the status of the protected area, for the Provincial Capital to drain the planned discharge (Q20 -Q50) (Fundamentals of the 2017 Flood Infrastructure Planning Module of the PUPR Ministry). Then among these ranges the maximum used is Q50.
The results of the HSS used are HSS ITB 1. To analyze the hydrograph of synthetic units in a watershed using the ITB method, it is necessary to know several important components that construct the hydrograph of synthetic units: 1) Height and Duration of Unit Rain. 2) Time Lag (TL), Peak Time (Tp) and Base Time (Tb), 3) Unit Hydrograph Form and 4) Unit Hydrograph Peak Discharge. HSS ITB-1 has the equation for the entire ascending and descending curve which is expressed by the same equation (Natakusumah, at al., 2011) as follows
\[q(t) = \exp\left\{2 - t - \frac{1}{t}\right\}^{\alpha C_p} \tag{1}\] where t = T/Tp and q = Q/Qp, each of them are time and discharge that have been normalized, so that the value of t=T/Tp is between 0 and 1, while the value of q = Q/Qp is between 0 and ∞ (or between 0 and 10 if the value of Tb/Tp=10). Cp is the calibration coefficient Qp (0.3-1.5)
The second step is tidal analysis which is the downstream boundary. This research uses LP-Tides, this program brings the basic features of T-Tide namely harmonic constant analysis and tide prediction. The tidal data analysis method used the least-square method from the t-tide_V1.4beta module made by R. Pawlowicz et al. LP-Tides was developed by Teguh Sulistian, a researcher from the Geospatial Information Agency (BIG) Indonesia. LP Tides program cannot stand alone, but still runs in the Matlab software (Tides, 2021). The third step is merging the river cross section measurement data with Merit DEM. Cross rivers derived from field measurements for hydraulic modeling and Merit DEM which is DTM for banks (flood inundation).
Multi-Error-Removed Improved Terrain (MERIT) DEM is the product generated by Dai Yamazaki (University of Tokyo). MERIT DEM provides globally consistent terrain elevation data with a very high vertical accuracy (Yamazaki, at al., 2017). MERIT DEM is assessed useful for hydrological studies. Study has shown that the MERIT DEM in plain areas (Kendrapara site) have high accuracies (Bhardwaj, 2019). Besides that, the overall result shows the significant improvement in the performance of Hydrodynamic Flood Model using the MERIT DEM in Amazon basin (Modi, 2020). Based on these, the author has also compared the MERIT DEM elevation with the Point Height elevation on the
Indonesian Earth Map (RBI) at the same point location in this study area. As a result, for elevation around the river (plain area), the MERIT DEM elevation value is close to the RBI point height elevation. The following is an illustration of the data processing scheme used for flood modeling in this study.
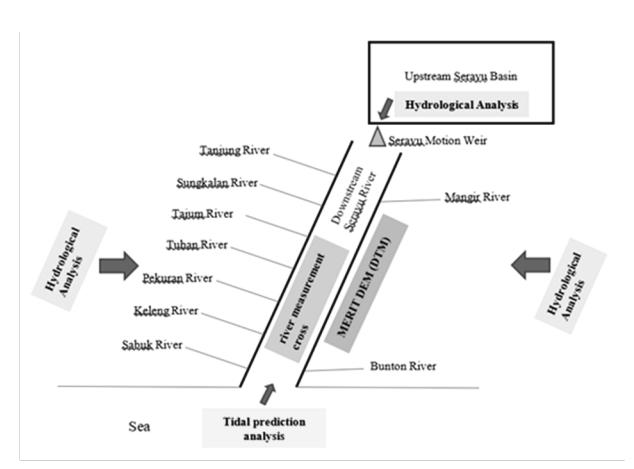
Figure 2. Scheme of data processing
3.3 Flood modeling
The fourth step is 2D flood modeling because what is needed is the result of flood inundation. The 2D flow calculation uses three equations, namely the 2D continuity equation, the 2D momentum equation in the x-axis direction, and the 2D momentum equation in the y-direction (Ginting, at al., 2015).
a. 2D Continuity Equation
\[\frac{\partial \zeta}{\partial t} + \frac{\partial (uh)}{\partial x} + \frac{\partial (vh)}{\partial y} = 0 \tag{2}\] where:
u: x-axis direction velocity
v: y-axis direction velocity
V: velocity V = √v 2 + u2
ζ: water level above reference
h: water level depth ζ + d
d: depth under reference (m)
b. 2D flow momentum equation in the x-axis direction
\[\frac{\partial u}{\partial t} + u \frac{\partial u}{\partial x} + v \frac{\partial u}{\partial y} + g \frac{\partial \zeta}{\partial x} + g \frac{u|V|}{C^2 h} + au|u| = 0\] (3)
where:
C : Chezy coefficient a : wall roughness coefficient
c. 2D flow momentum equation y-direction
\[\frac{\partial v}{\partial t} + u \frac{\partial v}{\partial x} + v \frac{\partial v}{\partial y} + g \frac{\partial \zeta}{\partial x} + g \frac{u|V|}{C^2 h} + av|v| = 0\] (4)
Flood modeling using HEC RAS 5.0.6 software. Flow data using the unsteady feature, for flow from the river, a flow hydrograph is used while for tides, a stage hydrograph is used (HECRAS, 2016). The equation used for running is the Full Momentum equation because the full momentum equation is suitable for use in the following conditions (Brunner, 2021):
- 1. Highly dynamic flood waves: rapidly rising and falling flood waves (flash floods)
- 2. Abrupt contractions and expansions: flow with high velocities
- 3. Flat sloping river systems: slopes less than 2 ft/mile
- 4. Tidal boundary conditions
- 5. Super elevation around bends
In the terrain, it is also associated with .shp of different manning values according to each land cover refer to https://www.hec.usace.army.mil/ (Creating Land Cover). After a successful HEC-RAS model run, the layer of depth can be used to visualize the model results in an inundation mapping form. Verification of model uses observation data based on field interview with the people around the study area and some online news.
3.4 Flood risk parameters
The fifth step is data processing risk parameter maps. In the hazard parameter, the flood inundation results from the modeling are processed into a hazard map using ArcGIS. the classification of the flood hazard level refers to the BNPB No. 02 of 2012 (BNPB, 2012). The flood hazard level consists of three levels, namely low, medium, and high. Floods with a depth of < 0.76 m are included in the low level, floods with a depth of 0.76 – 1.5 m are included in the medium level, and floods with a depth of > 1.5 m are included in the high level.
For the assessment of capacity component, related to the condition of regional resilience, it is known through information from the Cilacap BPBD and local residents. The classification of the capacity level also refers to the BNPB Number 2 Year 2012 (BNPB, 2012). The vulnerability component refers to a 2014 study from the Ministry of Public Work and Housing (PUPR) Indonesia. Flood vulnerability is the result of combining two aspects of vulnerability, namely social (population density) and physical aspects (drainage density, land use, slope, and landform) (Puslitbang Sumber Daya Air, 2014).
The flood risk map (R) is obtained from the result of multiplying the flood hazard (H) with the vulnerability (V) divided by capacity (C). The weighting of flood risk is done by equalizing the level of weighting on the weight of the hazard index, vulnerability index, and capacity index. The risk map is based on the concept of overlay per polygon so as to produce polygons of different sizes. Then all risk polygons (the result of multiplication of hazard by vulnerability divided by capacity) are classified into low, medium, high risks categories using statistical calculations, in this study a natural breaks classification is used. The following flow chart illustrates the recapitulation of the methodology used in this study.
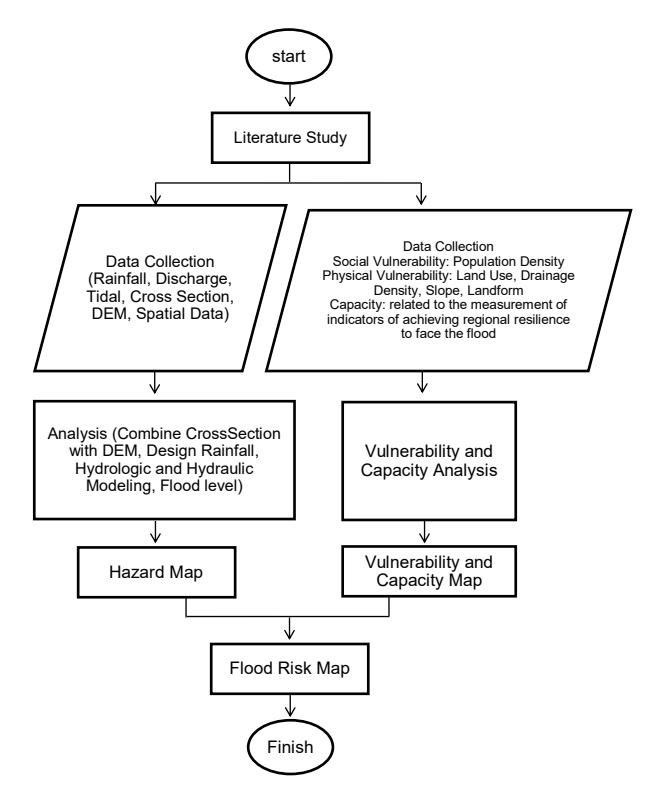
Figure 3. Diagram of research
4. Results and Discussion
4.1 Hydrological Analysis
Based on the simulation results in 50 years return period, flood discharge from upstream Serayu is 2191.97 m3/s. The flood discharge from 9 sub catchments is variative. Tajum has the biggest flood discharge (739.43 m3/s) and Pekuran has the smallest flood discharge (2.12 m3/s). Besides Tajum, Sabuk also has big flood discharge (119.66 m3/s), the other sub catchment has flood discharge under 68 m3/s.
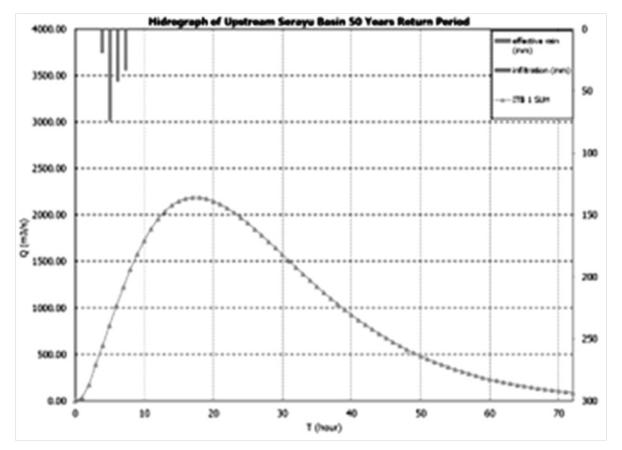
Figure 4. Hydrograph of upstream Serayu basin
Then for the analysis of tidal predictions as follows:
After the material for flood modeling is ready, then flood modeling is carried out using HEC RAS 5.0.6
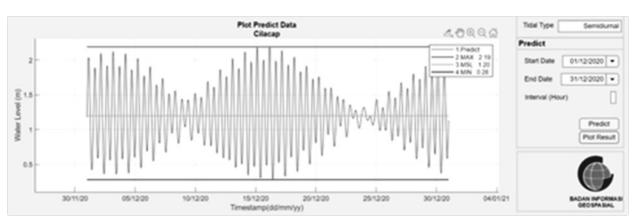
Figure 5. Tidal prediction
with the results of flood inundation shown in the following flood hazard map. Then the following are the results of data processing for vulnerability maps and capacity maps.
Based on the hazard map above, many locations are experiencing a flood depth of more than 1.5m (symbolized in red) or a high flood level. Some locations also have a flood depth between 0.76–1.5m (symbolized in yellow) or medium flood level, and some under 0.76 m (symbolized in green) or low flood level. Widespread flooding in Cindaga and Kebasen villages can be caused by upstream and Mangir river discharge.
Based on the results of field interviews in several flood locations, namely in the Kebasen sub-district and Rawalo sub-district (the confluence of the Downstream Serayu River with Tajum River), flooding due to the overflow of the downstream Serayu river inundated agricultural land as high as 1m to 2m more, especially in December 2020, causing farmers to fail to harvest. The flood modeling results also show that this location is classified as a high hazard level. This can be caused by upstream and Tajum river discharge. Besides that, based on the modeling results, the farthest influence of the tides is in the area around Cindaga village, close to the Tajum River.
In addition, flooding also affects residents whose houses are near riverbanks. However, for residential areas located at a higher elevation or far from the river, the flood height is less than 1m. The flood modeling result
also shows this location is classified as medium and low flood levels. For the vulnerable map, the east side looks more vulnerable when viewed as a whole, visualizing in orange color than the west side, although the west side is also vulnerable at some points. The east side looks more vulnerable can be caused by the drainage density. There is more gap on the east side than on the west side which has higher density.
The capacity map is visualized in the same color because in this area many things have been attempted regarding the resilience of the area to flooding from the relevant stakeholders, so all regions are included in capacity level 4. The results of the interview with BPBD Cilacap can be seen that BPBD Cilacap cooperates with Basarnas and village officials for coordination in evacuating victims and distributing logistics. BPBD has prepared rubber boats, village halls or mosques for evacuation shelters for victims, logistics for food and medicines.
There are many volunteers who help distribute logistical assistance in the form of food and medicine for flood-affected residents. Raising aid funds for disaster victims, including flood disasters, is promoted through communities on social media. If a flood comes, warnings to residents can be made via WhatsApp Group. In addition, there is also socialization to community officials or representatives at the village hall and community participation in creating a disaster risk reduction forum (FPRB).
After the hazard map, vulnerability map, and capacity map have been processed, they are then overlaid using ArcGIS to produce a flood risk map (FRM). Downstream Serayu River flows almost 30 km, so for a clearer visualization, here the results of the flood risk map in the first segment, second segment, and third segment. In both maps, a grid size of 1km x 1km has been designed to make it easier to read the distance of the flood inundation from the river. Most of the resulting flood
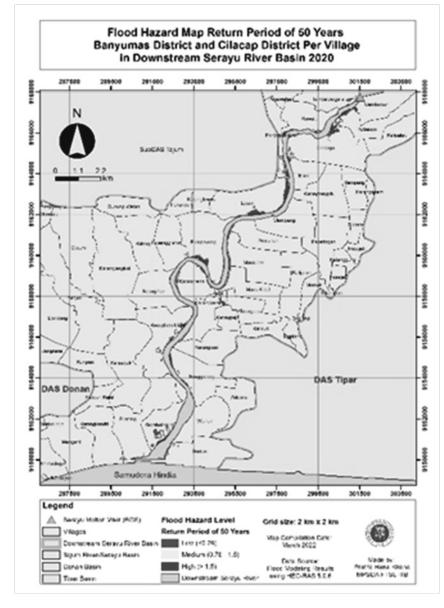
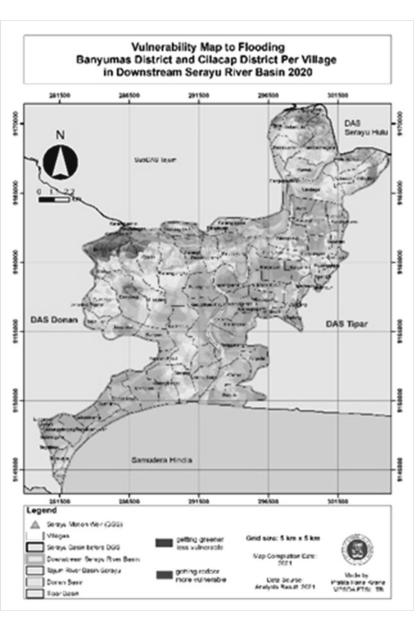
Figure 6. Flood hazard map Figure 7. Flood vulnerability map Figure 8. Flood capacity map
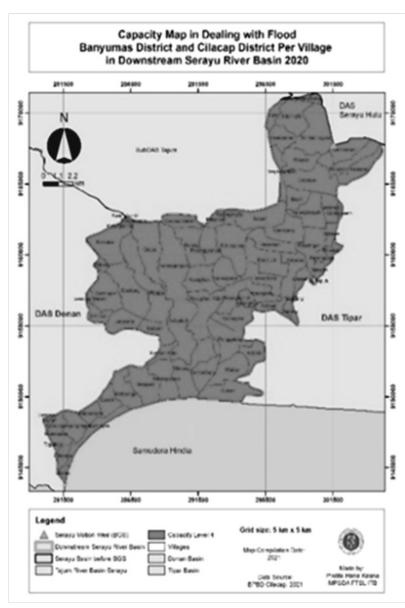
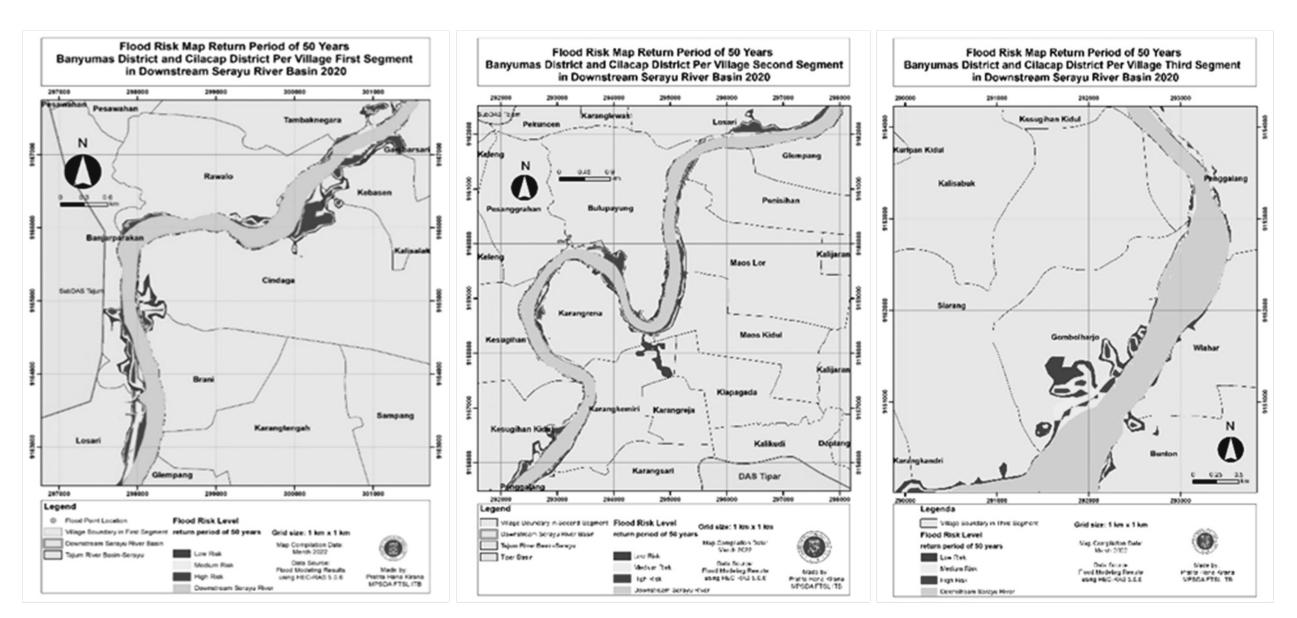
Figure 9. FRM 1<sup>st</sup> Segment
Figure 10. FRM 2<sup>nd</sup> Segment
Figure 11. FRM 3<sup>rd</sup> Segment
*FRM= Flood Risk Map
Table 1. Flood risk area (m²) per village and percentage of flood risk (%) (1)
| Land Cover per Village | Flood Risk Area (m²) | Total Area | Percentage to Area (%) | |||||
|---|---|---|---|---|---|---|---|---|
| Low Risk | Medium Risk | High Risk | Total | (m²) | High Risk | Total | ||
| Banjarparakan | ||||||||
| 1 | Built-up Land | 3873,56 | 2261,45 | 603,10 | 6738,11 | 341211 | 0,18 | 1,97 |
| Rice Fields and Farmland | 54954,83 | 48230,95 | 64070,84 | 167256,62 | 1304388 | 4,91 | 12,82 | |
| 2 | Brani | |||||||
| 2 | Rice Fields and Farmland | 16449,83 | 18929,43 | 16289,30 | 51668,56 | 1425983 | 1,14 | 3,62 |
| Bulupayung | ||||||||
| 3 | Built-up Land | 43865,69 | 30895,65 | 56200,23 | 130961,57 | 1075217 | 5,23 | 12,18 |
| Rice Fields and Farmland | 17428,11 | 9122,43 | 13389,98 | 39940,51 | 3892471 | 0,34 | 1,03 | |
| 4 | Bunton | |||||||
| 4 | Rice Fields and Farmland | 25432,33 | 13041,07 | 2779,09 | 41252,48 | 2731266 | 0,10 | 1,51 |
| Cindaga | ||||||||
| 5 | Built-up Land | 25964,92 | 18877,70 | 19851,08 | 64693,70 | 2451514 | 0,81 | 2,64 |
| Rice Fields and Farmland | 72933,24 | 92995,64 | 143590,88 | 309519,76 | 2800399 | 5,13 | 11,05 | |
| Gambarsari | ||||||||
| 6 | Built-up Land | 2024,01 | 1478,04 | 4049,80 | 7551,85 | 820917,8 | 0,49 | 0,92 |
| Rice Fields and Farmland | 1399,19 | 1490,60 | 3719,43 | 6609,22 | 1380888 | 0,27 | 0,48 | |
| Glempang | • | , | , | , | , | , | ||
| 7 | Built-up Land | 4815,96 | 1977,61 | 2130,94 | 8924,50 | 893348,3 | 0,24 | 1,00 |
| Rice Fields and Farmland | 5924,30 | 3240,75 | 5630,81 | 14795,86 | 1932057 | 0,29 | 0,77 | |
| Gombolharjo | * | , | , , , , , , , , , , , , , , , , , , , | , | · · · · · · · · · · · · · · · · · · · | • | ||
| 8 | Rice Fields and Farmland | 172145,75 | 171717,86 | 65798,97 | 409662,59 | 1869473 | 3,52 | 21,91 |
| Karangkandri | • | • | , | , | • | • | ||
| 9 | Built-up Land | 5639,56 | 1138,37 | 6777,93 | 2131241 | 0,00 | 0,32 | |
| Rice Fields and Farmland | 6399,90 | 10730,36 | 2812,46 | 19942,72 | 1918502 | 0,15 | 1,04 | |
| Karangkemiri | · | • | • | • | · | |||
| 10 | Built-up Land | 29164,46 | 13578,86 | 12319,64 | 55062,97 | 1406110 | 0,88 | 3,92 |
| Rice Fields and Farmland | 116986,71 | 1833,91 | 2151,25 | 120971,87 | 1155165 | 0,19 | 10,47 | |
| Karangreja | · · · · · · · · · · · · · · · · · · · | , | , , , , , , , , , , , , , , , , , , , | , | · · · · · · · · · · · · · · · · · · · | • | ||
| 11 | Rice Fields and Farmland | 40,32 | 40,32 | 430928,2 | 0.00 | 0,01 | ||
| Karangrena | * | , | , | · · · · · · · · · · · · · · · · · · · | · · · · · · · · · · · · · · · · · · · | |||
| 12 | Built-up Land | 25468,81 | 9609,04 | 29489,87 | 64567,72 | 1064721 | 2,77 | 6,06 |
| Rice Fields and Farmland | 42013,71 | 13281,08 | 23084,33 | 78379,12 | 1335003 | 1,73 | 5,87 | |
| Karangsari | ,. | ., | -, | |||||
| 13 | Built-up Land | 14254,57 | 6699,16 | 6579,15 | 27532,88 | 1790618 | 0,37 | 1,54 |
| Rice Fields and Farmland | 1860,79 | 2304,80 | 2954,08 | 7119,67 | 1494066 | 0,20 | 0,48 | |
| Karangtengah | -, | -, | ||||||
| 14 | Rice Fields and Farmland | 1923,55 | 1042,09 | 1049,49 | 4015,14 | 2567202 | 0,04 | 0,16 |
| Kebasen | .020,00 | , 10 | , | 200.202 | 0,0. | |||
| 15 | Built-up Land | 33508,41 | 22341,82 | 30872,09 | 86722,33 | 1290690 | 2,39 | 6,72 |
| Rice Fields and Farmland | 29565,00 | 22896,52 | 83551,70 | 136013,22 | 1770925 | 4,72 | 7,68 | |
| I loido dila i diffilaria | 20000,00 | 00001,70 | 100010,22 | 11.0020 | 1,12 | .,00 | ||
154 Jurnal Teknik Sipil
Table 1. Flood risk area (m²) per village and percentage of flood risk (%) (2)
| Land Cover per Village | Flood Risk Area (m²) | Total Area | Percentage 1 | to Area (%) | ||||
|---|---|---|---|---|---|---|---|---|
| Low Risk | Medium Risk | Total | (m²) | High Risk | Total | |||
| Kesugihan | ||||||||
| 16 | Built-up Land | 15500,62 | 12272,27 | 9841,34 | 37614,23 | 1348979 | 0,73 | 2,79 |
| Rice Fields and Farmland | 2419,25 | 1385,20 | 4695,11 | 8499,56 | 2439706 | 0,19 | 0,35 | |
| Kesugihan Kidul | ||||||||
| 17 | Built-up Land | 13276,85 | 11757,58 | 4323,48 | 29357,91 | 1691277 | 0,26 | 1,74 |
| Rice Fields and Farmland | 131759,93 | 88765,44 | 60018,22 | 280543,59 | 4006861 | 1,50 | 7,00 | |
| 18 | Losari | |||||||
| 10 | Rice Fields and Farmland | 61815,97 | 38499,84 | 166346,69 | 266662,50 | 4139313 | 4,02 | 6,44 |
| Maos Kidul | ||||||||
| 19 | Built-up Land | 2819,13 | 138,88 | 122,86 | 3080,87 | 698220,9 | 0,02 | 0,44 |
| Rice Fields and Farmland | 32818,68 | 30905,49 | 54568,85 | 118293,02 | 2302118 | 2,37 | 5,14 | |
| Maos Lor | ||||||||
| 20 | Built-up Land | 32192,33 | 28508,20 | 44414,89 | 105115,42 | 988063,1 | 4,50 | 10,64 |
| Rice Fields and Farmland | 4530,86 | 4530,86 | 3451228 | 0,13 | 0,13 | |||
| Penggalang | ||||||||
| 21 | Built-up Land | 176,34 | 176,34 | 1444721 | 0,00 | 0,01 | ||
| Rice Fields and Farmland | 22586,77 | 11793,44 | 32992,25 | 67372,47 | 2506872 | 1,32 | 2,69 | |
| Penisihan | ||||||||
| 22 | Built-up Land | 12477,74 | 9457,55 | 23943,42 | 45878,71 | 789695,9 | 3,03 | 5,81 |
| Rice Fields and Farmland | 1287,59 | 1122,67 | 1612,35 | 4022,62 | 1361601 | 0,12 | 0,30 | |
| Pesanggrahan | ||||||||
| 23 | Built-up Land | 14163,32 | 8091,75 | 4267,42 | 26522,49 | 1045729 | 0,41 | 2,54 |
| Rice Fields and Farmland | 1186,60 | 1355,90 | 2407,61 | 4950,11 | 1945273 | 0,12 | 0,25 | |
| Rawalo | ||||||||
| 24 | Built-up Land | 313,92 | 615,65 | 1326,06 | 2255,63 | 1147622 | 0,12 | 0,20 |
| Rice Fields and Farmland | 33045,62 | 30366,54 | 47195,25 | 110607,40 | 1513762 | 3,12 | 7,31 | |
| Slarang | ||||||||
| 25 | Built-up Land | 4332,41 | 1002,13 | 3,44 | 5337,98 | 2512279 | 0,00 | 0,21 |
| Rice Fields and Farmland | 10441,48 | 12544,61 | 6380,27 | 29366,36 | 3244065 | 0,20 | 0,91 | |
| Tambaknegara | ||||||||
| 26 | Built-up Land | 27043,34 | 14017,31 | 22592,43 | 63653,08 | 1908873 | 1,18 | 3,33 |
| Rice Fields and Farmland | 0,73 | 0,73 | 2086536 | 0,00 | 0,00 | |||
| 27 | Wlahar | _ | ||||||
| Rice Fields and Farmland | 12635,60 | 4049,11 | 13489,74 | 30174,44 | 2055596 | 0,66 | 1,47 | |
| al Luas Risiko Banjir per Level (m²) | 2372663,44 | 1652729,50 | 2196082,12 | 6221475,06 | ||||
| Tot | al Luas Risiko Banjir per Level (km²) | 2,37 | 1,65 | 2,20 | 6,22 | |||
inundation flows approximately 500 m or less from the river with different levels of danger at each location.
In the first segment, the risk of flooding with a high level and fairly extensive inundation is spread across Cindaga and Kebasen. In addition, the risk of flooding with a high level also occurs around the bend area of the river in Rawalo and Banjarparakan as well as around the confluence area between the Serayu Hilir River and Kali Tajum in the Losari and Brani areas. Then for segment II, the risk of flooding with a high level is in Bulupayung, Losari, and Kesugihan Kidul around the river. Meanwhile, segment III is located around the river located in Gombolharjo. For more details, the following is the table regarding the area affected by flooding, both at low, medium, and high risk, each land cover per village. In addition, the Percentage of Flood Risk is also presented for both high risk (high risk/total area) and total (sum of low, medium, high risk/total area).
The total area of flood risk in the Downstream Serayu River basin is 6.22 km<sup>2</sup>, while the high-level flood risk area is 2.2 km<sup>2</sup>. The highest percentage of high-level
flood risk area is in Kebasen Village, with the percentage of agricultural land affected by 4.72% and built-up land affected by 2.39%. Cindaga Village is an area with the highest high-level flood risk for rice fields and agricultural land cover, which is 5.13% of the total rice field and agricultural land area in Cindaga. Bulupayung Village is an area with the highest highlevel flood risk for land cover in the form of built-up land, which is 5.23% of the total built-up land area in Bulupayung. The largest flood risk area (from low, medium, to high risk) is in Gombolharjo with a total percentage of 21.91%, but the level of risk in that area is dominated by low level flood risk and medium flood risk.
In the study location, the percentage result between the flood risk area and the administrative area of each village is no more than 25%, so the authors do not generalize that all areas within the village are at risk of flooding just because there are some areas that are at risk of flooding. Based on this, the creation of a flood risk map uses the concept of overlay per polygon, not the concept of overlay per administrative boundary. The unit of analysis used is the village level for more detail, so that the reading is in the form of the percentage of flood risk in a village from the area of the village, more specifically per land cover.
5. Conclusions
- 1. The flood modeling results at the study site indicate a flood with a height of between 1m to 2m. This is in line with the results of field interviews.
- 2. Based on the results of flood modeling, the reach of the overflow is approximately 500 m from the river to the mainland.
- 3. The total area of flood risk in the Downstream Serayu River basin is 6.22 km<sup>2</sup>, while the high-level flood risk area is 2.2 km<sup>2</sup>.
- 4. Several villages at high-risk of flooding include Cindaga, Kebasen, Banjarparakan (near the bend of the river), Losari, Bulupayung. In addition, several villages that are also at risk of low and medium level flooding include Rawalo, Karangrena, Karangkemiri, Kesugihan Kidul, and Gombolharjo.
Acknowledgment
The authors would like to acknowledge the support given by Institut Teknologi Bandung (ITB) and BBWS Serayu Opak Ministry of Public Work and Housing (PUPR) Indonesia for the availability of data, assistance, and guidance.
References
- Asdak, C., 2007. Hidrologi dan Pengelolaan Daerah Aliran Sungai. Yogyakarta: Gadjah Mada University Press
- Badan Nasional Penanggulangan Bencana (BNPB), Pedoman Umum Pengkajian Risiko Bencana. Peraturan Kepala No. 2, 2012
- Bhardwaj, A., 2019. Evaluation of Openly Accessible MERIT DEM for Vertical Accuracy in Different Topographic Regions of India. Dehradun: Indian Institute of Remote Sensing (IIRS)
- Brunner, G., 2021. HEC-RAS 2D Class: 3.1 Equation Selection (Shallow Water Flow or Diffusion Wave). Accessed via the HEC RAS youtube channel
- Chow, 1988. Applied Hydrology. New York: McGraw-Hill
- Creating Land Cover, Manning's n values, and % Impervious Layers. Accessed via https://www.hec.usace.army.mil/
- Farid, et al., 2017. Flood Hazard Mapping of Palembang City by Using 2D Model. AIP Conference Proceedings 1903, 100009 (2017)
- Farid, M., Gunawan, B., Kusuma, B.M.S., Habibi, S.A., Yahya, A., 2020. Assessment of flood risk reduction in Bengawan Solo River: A case study of Sragen Regency. International Journal of GEOMATE, 18(70), pp. 229–234
- Farid, M., Mano, A., Udo, K. 2011. Distributed flood model for urbanization assessment in a limited-gauged river basin. WIT Transactions on Ecology and the Environment, 146, pp. 83–94
- Farid, M., Saputra, D., Maitsa, T.R., Kuntoro, A.A., Chrysanti, A., 2021. Relationship between extreme rainfall and design flood-discharge of the Ciliwung river. IOP Conference Series: Earth and Environmental Science, 708(1)
- Fundamentals of the 2017. Flood Infrastructure Planning Module of the PUPR Ministry
- Ginting, S., Farid, M., Kusuma, S. 2015. Pengembangan Peta Bahaya Banjir Berdasarkan Model Matematik Quasi 2 Dimensi. Jurnal Teknik Sipil Vol. 22 No. 3 Desember 2015. Bandung: Institut Teknologi Bandung
- HECRAS Reference Manual. 2016
- Hernanda, dkk. 2016. Tanggul Sungai Serayu Hilir dari Muara Hingga Bendung Gerak Serayu. Jurnal Karya Teknik Sipil, Volume 5, Nomor 1, Tahun 2016, Halaman 135-145: Universitas Diponegoro
- Koks, E.E., Jongman, B., Husby, T.G., Botzen, W.J.W., Environ. Sci. Policy, 47, 42–52 (2015).
- LP Tides. 2021. Diakses dari https://geodesiana.com/
- Modi, P., Revel, M., Zhou, X., Yamazaki, D. 2020. MERIT DEM Performs Better for Hydrodynamic Flood Model in Amazon Basin. American Geophysical Union, Fall Meeting 2020, abstract #H010-0013
- Moe, dkk. 2015. Numerical Simulation of Flooding in Jakarta and Evaluation of A Counter Measure To Mitigate Flood Damage. Journal of Japan Society of Civil Engineers Ser G (Environmental Research): Tohoku University
- Natakusumah, D., Hatmoko, W., Harlan, D. 2011. Prosedur Umum Perhitungan Hidrograf Satuan Sintetis dengan Cara ITB dan Beberapa Contoh Penerapannya. Jurnal Teknik Sipil Vol. 18 No. 3 Desember 2011. Bandung: Institut Teknologi Bandung.
- Puslitbang Sumber Daya Air . 2014. Peta Risiko Kekeringan dan Banjir Berdasarkan Analisa Rainfall-Runoff. Bandung: Kementerian PUPR
- UNISDR Terminology of Disaster Risk Reduction. 2009. Diakses dari https://www.unisdr.org/
- Yamazaki, D., Ikeshima, D., Tawatari, R., Yamaguchi, T., O'Loughlin, F., Neal, J., Sampson, C., Kanae, S., Bates, P. 2017. A high-accuracy map of global terrain elevations. Geophysical Research Letters 10.1002/2017GL072874. AGU Publications