
M Syahril Badri Kusuma
Researchers of Water Resources Engineering Group and Lecturers in Faculty of Civil and Environmental Engineering, Bandung Institute of Technology, West Java, Indonesia. Email: msbadrik2014@gmail.com
Dantje K Natakusumah
Researchers of Water Resources Engineering Group and Lecturers in Faculty of Civil and Environmental Engineering, Bandung Institute of Technology, West Java, Indonesia. Email: dkn.mpsda.01@gmail.com
Abstrak.
Bandara Internasional Yogyakarta terletak di Kawasan Strategis Nasional, Kabupaten Kulon Progo. Daerah ini secara geologis merupakan daerah dataran rendah yang diapit oleh Sungai Bogowonto dan Sungai Serang yang menyebabkan banjir tahunan pada musim hujan. Sistem pengendalian banjir dikembangkan untuk menjaga kinerja bandara. Penetapan Kawasan Strategis Nasional juga menyebabkan perubahan tata guna lahan di sekitarnya yang dapat mempengaruhi perubahan morfologi sungai. Perubahan morfologi di kedua sungai tersebut telah diidentifikasi berdasarkan pengamatan di lapangan. Berdasarkan pengamatan tersebut dapat diketahui bahwa peningkatan laju sedimentasi merupakan parameter terpenting yang dapat mengubah morfologi kedua sungai tersebut. Pengaruh perubahan morfologi di muara sungai Serang telah dipelajari dengan menggunakan software DELFT3D, sedimentasi di muara sungai Serang telah disimulasikan dengan beberapa skenario antara lain pada saat monsun barat dan monsun timur. Hasil pemodelan menunjukkan bahwa tebal sedimentasi di muara Serang pada kondisi eksisting adalah 3,5 m pada musim barat dengan luas 0,063 ha dan 4,0 m pada musim timur dengan luas 0,437 ha.
Kata-kata Kunci: Morfologi, muara, Delft3D
Abstract.
The Yogyakarta International Airport has located in the National Strategic Area, Kulon Progo regency. This area is geologically a low-lying area flanked by the Bogowonto River and the Serang River which causes annual flooding in the rainy season. A flood control system was developed to maintain airport performance. The determination of the National Strategic Area has also led to changes in the surrounding land use which can affect changes in the morphology of the rivers. The morphological changes in the two rivers have been identified based on field observations. Based on this observation, it can be seen that the increase in sedimentation rate is the most important parameter that can change the morphology of the two rivers. The effect of morphological changes in the Serang river estuary has been studied using DELFT3D software, the sedimentation in the Serang river estuary has been simulated with several scenarios, including during the west monsoon and east monsoon. The modeling results show that the sedimentation thickness in the Serang estuary under existing conditions is 3.5 m in the west season with an area of 0.063 ha and 4.0 m in the east monsoon with an area of 0.437 ha.
Keywords: Morphology, estuary, Delft3D
1. Introduction
The morphology change of estuary river due to the river sedimentation is a common problem in the southern part of Java Coastal Area (Salim, et al., 2006). The influence of sedimentation is commonly high
during the rainy season and achieve its maximum rate in flood condition, that's why the change of river estuary morphology is also related to the flood problem. Meanwhile, sedimentation is also a wellknown as one of the main caused, beside climate change and land use change, of severe flood hazard in the urban area of Indonesia as it is found by Rahayu, et al., 2019; Formanek, et al., 2013; Farid, et al., 2017. Several previous studies demonstrate very well the correlation of land use change to the increasing extreme discharge as it is shown by Papagiannaki, at al., 2015; Kuntoro, et al., 2017 and Abfertiawan, at al. Rahayu, et al., 2019 discussed how to enhance the resiliency of the impacted community to reduce the risk generated by the influence of climate change on increasing the extreme discharge. Meanwhile lack of field data, of rainfall and discharge distribution, remains the main concern to get eligible results of climate change influence to the extreme discharge as it is indicated by Farahnaz, et al., 2020. Based on neural network methods, Jonathan, et al., 2021 developed machine learning model to correlate satellite data to flood level for supporting flood hazard prediction meanwhile Gunawan, et al., 2017 developed model for river sediment load estimation, however this model requires a well record data measurement that is not applicable for Serang River data. Furthermore, several weir and dam that developed in the upper part of Serang and Kulon Progo river can be used not only to optimize the freshwater availability during the dry season but also to reduce the sedimentation rate and the extreme discharge during the wet/rainy season as indicated by Kusuma, et al., 2009. However, Sengara, et al., 2008 concluded that as an archipelago country located in a very active tectonic plate and volcano, Indonesia has a very high probability of earthquake hazard that will generate high risk of dam failure of any reservoir in its surrounding area. This dam break will generate collateral hazard to its downstream area that usually become a favor urban area development. Sudden release of a large water mass of the reservoir might cause massive destructions either in life or property particularly in that urban area as indicated by Kusuma, et al., 2009; Haltas, et al., 2016; Kusuma, et
Figure 1. Existing condition of Serang river estuary Figure 2. Sedimen sampling location
al., 2019; and Kusuma, et al. Sarminingsih, et al., 2014 discussed the influence of the increasing flood depth to the increasing flood disaster risk. Yatsrib, et al. discuss the effort of decreasing the influence of sedimentation to the flood risk through river normalization. Based on the above discussion and regarding current condition of Serang River and its estuary (physical characteristic, data availability, potential previous research results and hydraulic capacity), this paper discuss the influence of Serang river sedimentation to the morphology change in the study area (The National Strategic Area Yogyakarta International Airport (Ksn Yia).
In 2019, there were several flood events that resulted in material and non-material losses in Kulon Progo district, this flood incident also caused operational disruption at Yogyakarta International Airport. As one of the National Strategic Areas (KSN) with a fairly large investment value and by considering the future development of this area which is expected to provide social and economic benefits for the surrounding community, an integrated action is needed in flood control in the Serang watershed so that similar incidents can be avoided. One of the factors that can cause flooding in the Serang River is the condition of the Serang River estuary which is covered with sediment so that it can lead to backwater in the downstream river which has the potential to exacerbate the risk of flooding and disrupt airport activities. Sedimentation that occurs at the estuary of the Serang River can also cause a decrease in the flow capacity of the Serang River, for that it is necessary to conduct a morphological study at the Serang River estuary as an effort to control flooding in the Serang watershed.
2. Overview of The Study
Longshore sediment analysis was carried out to determine the effect of sedimentation along the Gelagah coast on silting at the Serang river estuary, longshore sediment analysis was carried out by modeling the conditions in the east monsoon and west monsoon, where each condition was first calculated the variables both from the river and from the sea. Longshore sediment analysis will use sample data obtained from sampling along the Gelagah coast.
This study will conduct hydrodynamic simulations in the west monsoon and east monsoon where the west monsoon occurs from October to March while the east monsoon occurs from April to September, where the
discharge in the Bogowonto and Serang rivers is adjusted to each season, based on the results. The simulation will analyze the sedimentation that occurs in the Serang estuary.
3. Research Methods
This study uses 4 variables as input, namely, river discharge, sediment samples, bathymetry survey, and hindcasting analysis. These inputs are then used in the model setup using 3D delft. The model is divided into two conditions, namely the east monsoon and the west monsoon. The results of the model are then verified using google earth images and analysis is carried out to draw conclusions.
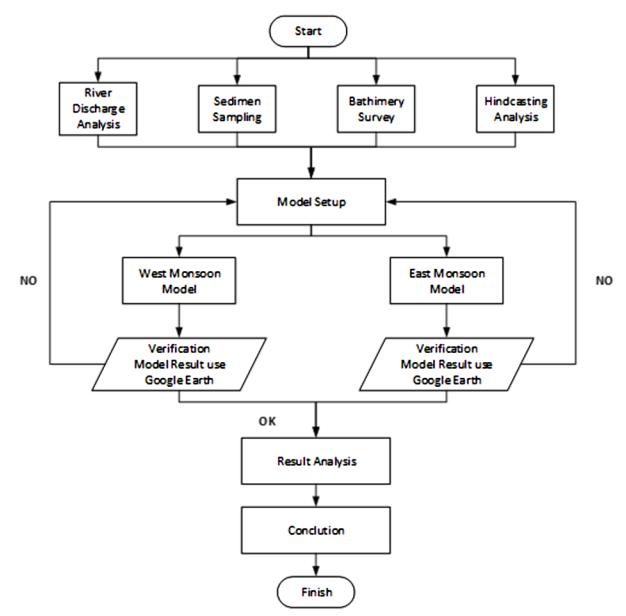
Figure 3. Research methodology
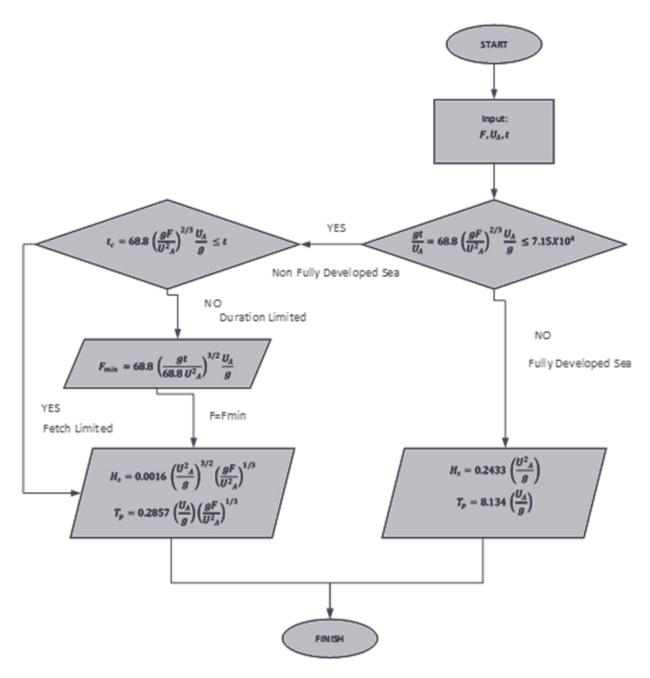
Figure 4. Shore manual protection method
The studies use a hindcasting calculation method from Shore Protection Manual (SMP), which is published by the Coastal Engineering Research Center (CERC) [18], the US Army has been applied to a variety of coastal engineering, wave generation method is based on the wind speed and the length of the effective fetch.
Wind data uses hourly data obtained from the website https://marine.copernicus.eu/ for the last 10 years, then grouping based on the east monsoon and west monsoon, then windrose analysis for each season to determine the dominant wind direction and effective speed.
4. Result
4.1 River discharge analysis
Determination of the discharge value of the Serang river is carried out by making rainfall-runoff modelling using the Nreca Modified method from 2003 to 2019, based on the modelling results, the average discharge in the dry season is 4.31 m<sup>3</sup>/s and the average discharge in the rainy season is 7.31 m<sup>3</sup>/s. the modelling results for the discharge of the Serang river in the dry and wet seasons are shown as follows:
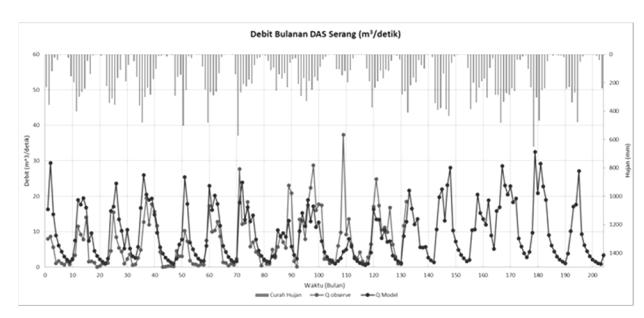
Figure 5. Rainfall-runoff at Serang river
In the Bogowonto river the average discharge calculation for each season is carried out using observation data at the Punggangan station from 2010 to 2015, based on the calculation results obtained an average discharge the average dry season of the Bogowonto river is 12.45 m<sup>3</sup>/s and the average wet season discharge is 25.39 m<sup>3</sup>/s
4.2 Hindcasting analysis
The calculation of hindcasting is carried out using the Shore Manual Protection (SMP) method, where first corrections are made to the wind data, then calculations are carried out to obtain the effective wave height (Hs) and wave propagation time (Ts), the results of the hindcasting analysis are shown as follows (Figure 6):
During the west monsoon season, the highest probability of wind speed based on the data for the last 10 years is in the speed class 0.5-2.1 m/s with a probability value of 39.9%, followed by the speed class 2.1-3.6 m/s with a probability value of 35.4%, and speed class 3.6-5.7 m/s with a probability value of 19.7%.
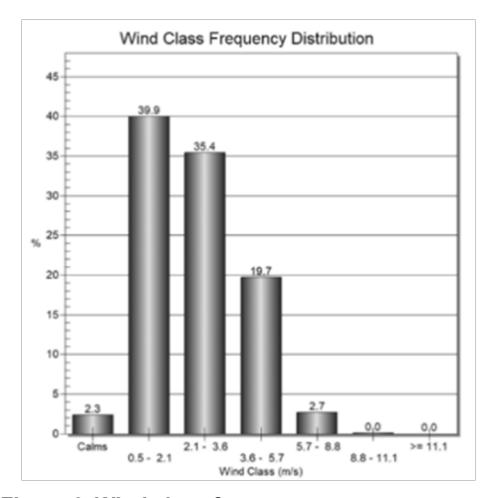
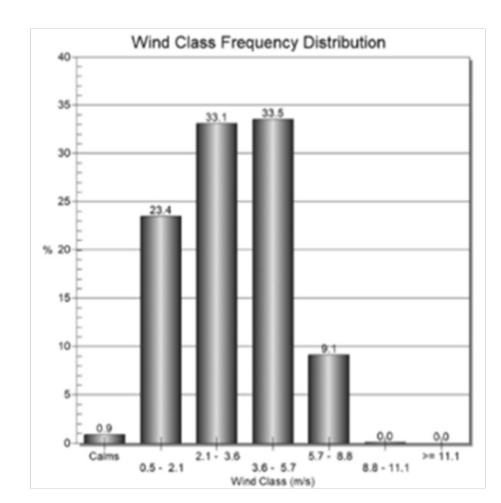
Figure 6. Wind class frequency west monsoon Figure 7. Wind class frequency east monsoon
During the east monsoon season, the highest probability of wind speed based on the data for the last 10 years is in the speed class 3.6-5.7 m/s with a probability value of 33.5%, then followed by the speed class 2.1- 3.6 m/s with a probability value of 33.1%, and speed class 0.5-2.1 m/s with a probability value of 23.4%.
In general, the average wind speed in the east monsoon is much faster than the average wind speed in the west monsoon, this is influenced by the geographical and astronomical position where Kulon Progo Regency is located. Based on the analysis and calculation of wind
data, windrose and waverose analysis in the western and eastern monsoons were performed which will later be used as input on the Delft3D model.
Based on the results of calculations using the SMP method, it is obtained that for the west monsoon the dominant wave comes from the west with Hs = 1.87 m and Tp = 7.09 s
Based on the calculation results, the dominant wave in the east monsoon comes from the southeast with Hs = 1.89 m and Tp = 7.38 s
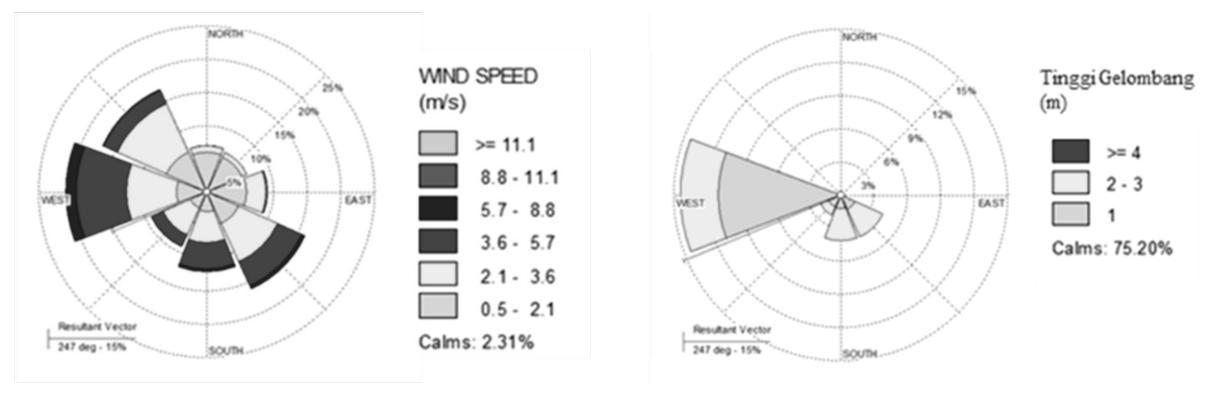
Figure 8. Windrose and waverose foe west monsoon
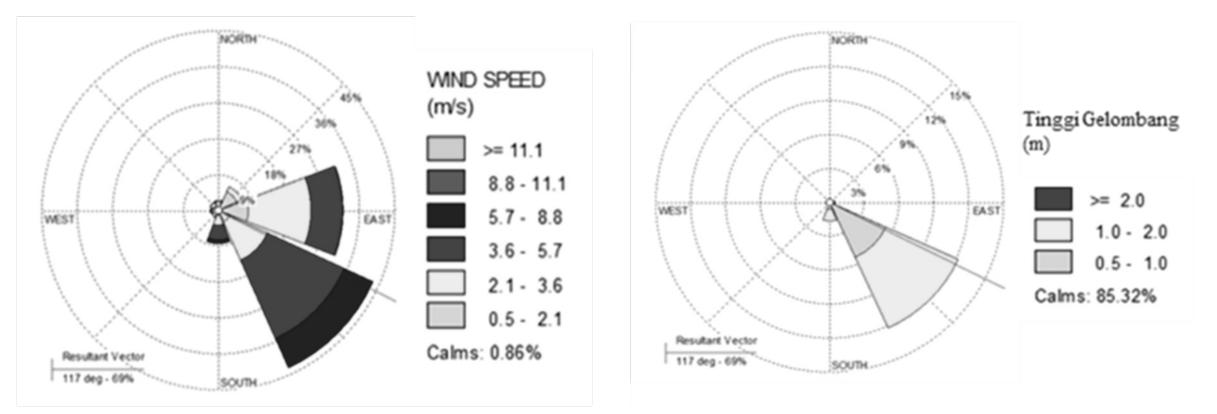
Figure 9. Windrose and wiverose for east monsoon
4.3 Delft3D model setup
The initial stage in doing a modelling is to create a domain for the modelling, making the domain in this modelling using the Delft Dashboard application, where the grid used is 25 mx 25 m with bathymetry using secondary data from the results of field measurements in previous studies, then for the boundary in the model in the form of astronomical parameters of tides, Bogowonto river discharge and Serang River discharge in each east monsoon and west monsoon. The results of domain and boundary modelling are shown as follows (Figure 10):
4.4 Wave analysis
Gelagah Beach based on admiralty calculations is a beach with mixed tides with a double daily trend, where in 1 day there can be 2 high tides and 2 low tides. The Figure 10. Delft3D model Setup
results of wave modeling for each season using hindcasting calculations obtained the following results:
In modelling the wave monsoon west can be seen significant waves coming from the west with an average
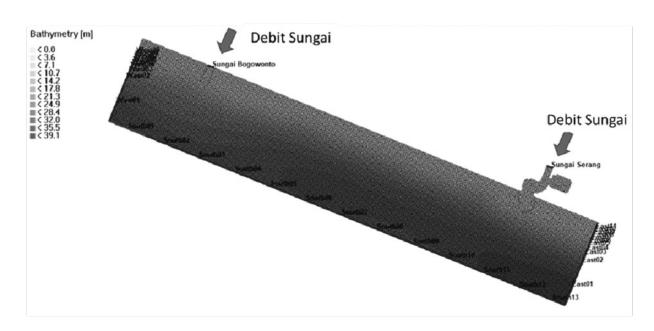
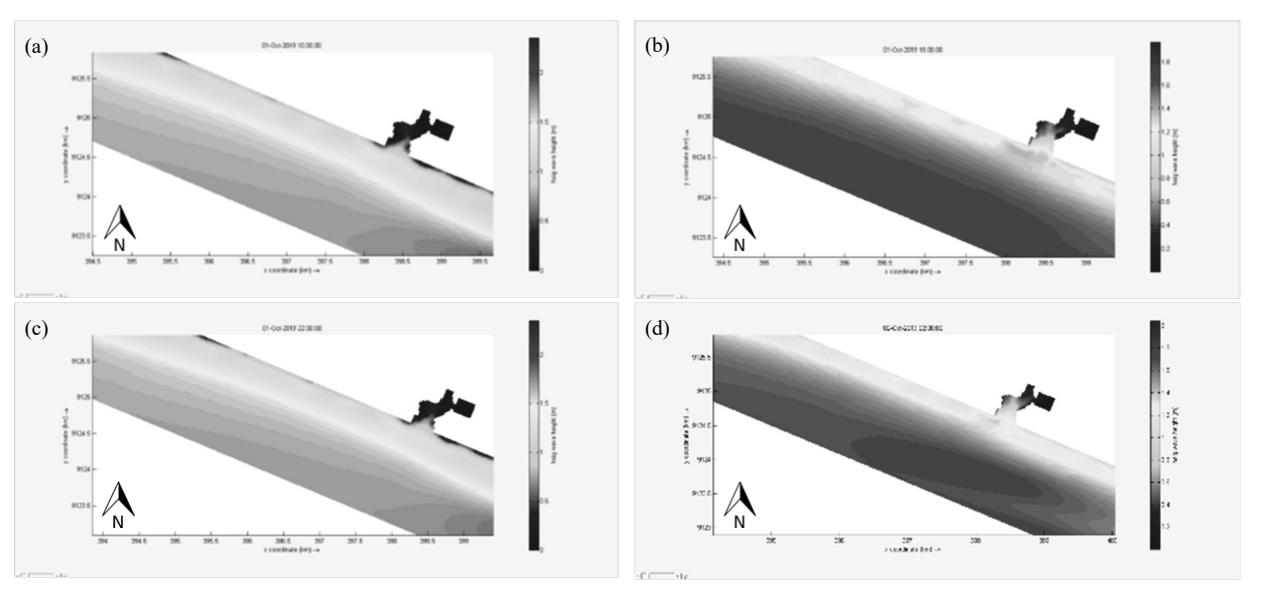
Figure 11. (a) Low tide 1, (b) High tide 1, (c) Low tide 2, (d) High tide 2 on west monsoon
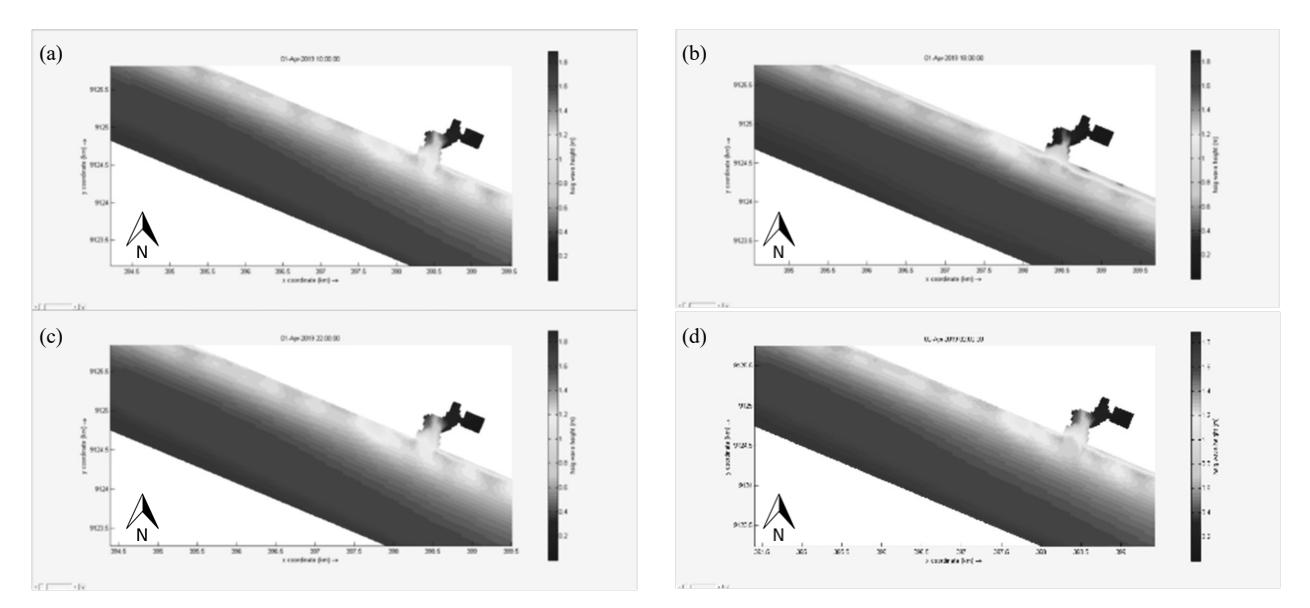
Figure 12. (a) Low tide 1, (b) High tide 1, (c) Low tide 2, (d) High tide 2 on east monsoon
height of 1.8 m and then undergo transformation due to the shoaling due to silting bathymetry towards the coast, causing a decrease in wave height.
Results of modelling during the monsoon west seen waves touching the shore in phase At low tide 1 is around 1 m, then in the high tide phase 1 there is an increase in the height of the waves touching the beach with a value of around 1.6 m, while in the low tide phase 2 there is a decrease in the wave height to 1 m and in the high tide phase 2 there is an increase again by 1.2 m.
In the modelling of the east monsoon waves, it can be seen that significant waves came from the southeast with an average height of 1.8 m and then underwent a transformation due to the shoaling process due to shallow bathymetry towards the coast, resulting in a decrease in wave height.
Gelagah Beach based on admiralty calculations is a beach with mixed tides with a double daily trend, where in 1 day there can be 2 high tides and 2 low tides. The results of the modelling during the east monsoon show that the waves touching the beach in the low tide phase 1 are around 1 m, then in the tidal phase 1 there is an increase in the height of the waves touching the beach with a value of around 1.4 m, while in the low tide phase 2 there is a decrease in the wave height again to 1 m and in the tidal phase 2 there was another increase of 1.6 m.
4.5 Longshore sediment analysis
The results of the longshore sediment modeling of the existing condition using Delft3D in the west monsoon are shown as follows:
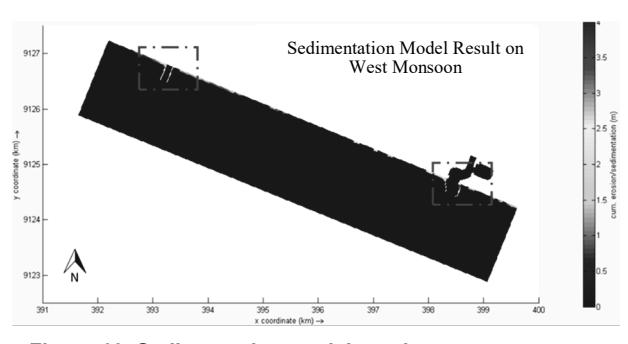
Figure 13. Sedimentation model result on west monsoon
The results of longshore sediment modelling that occur in the west monsoon can be seen that accretion occurs on the west side of the Bogowonto estuary jetty and erosion occurs on the east of the Bogowonto estuary, as well as in the Serang estuary accretion occurs on the west side of the Serang estuary breakwater and erosion occurs on the east side of the Serang estuary, this occurs due to the direction of the dominant longshore current coming from the west side.
On the west side of the jetty Bogowonto sedimentation occurs with an average height of 1.5 m and on the breakwater of the Serang estuary to the west there is sedimentation with an average height of 3 m.
The results of the longshore sediment modelling of the existing condition using Delft3D in the east monsoon are shown as follows:
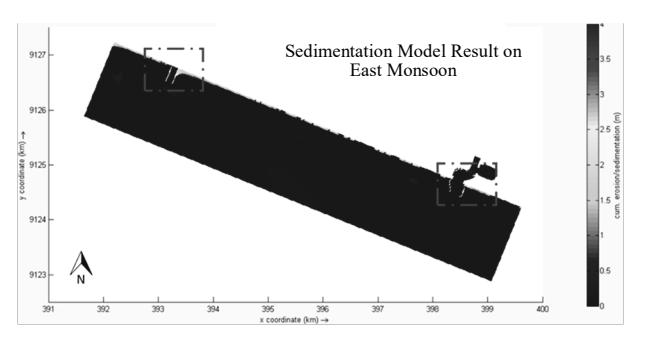
Figure 14. Sedimentation model result on east monsoon
The results of longshore sediment modelling that occur in the east monsoon can be seen that accretion occurs on the east side of the Bogowonto estuary jetty and erosion occurs on the west side of the Bogowonto estuary, as well as in the Serang estuary accretion occurs on the east side of the Serang estuary breakwater and erosion occurs on the west side of the Serang estuary, this occurs due to the direction of the dominant longshore current coming from the east side.
On the east side of the jetty Bogowonto sedimentation occurs with an average height of 2.5 m and on the west side of the breakwater of the Serang estuary there is sedimentation with an average height of 2.5 m
Viewed at the breakwater of the Serang estuary, the results of modellling the existing conditions in the West Monsoon at the Serang River Estuary show that sedimentation occurs in the Serang estuary with a maximum thickness of 3.5 m with a sedimentation area of approximately 0.063 Ha, then based on the modelling it can be seen also on the west side of the Serang estuary that occurs accumulation of sediment causes an updrift effect while on the east side which does not get a sediment supply causes a downdrift effect.
The modelling results were compared with aerial observations using Google Earth in January 2016.
Observations using Google Earth in January 2016 also showed that the river flow could still flow and there was no significant closure at the mouth of the Serang estuary. Comparison with the same model shows that in the west monsoon there is no closure of the mouth of the Serang river estuary with significant sedimentation, it's just that there is still sedimentation with a maximum thickness of 1 m, this shows that breakwater at the Serang estuary is still not effective enough to reduce sedimentation in the estuary. the Serang estuary during the West monsoon.
The opening of the Serang estuary from sedimentation that occurs is caused by the discharge from the Serang river which is large enough to push the deposited sediment towards the sea, but according to observations from Google Earth imagery, the flushing
Figure 15. (a) Serang estuary sedimentation model result on west monsoon, (b) Google earth view on January 2016
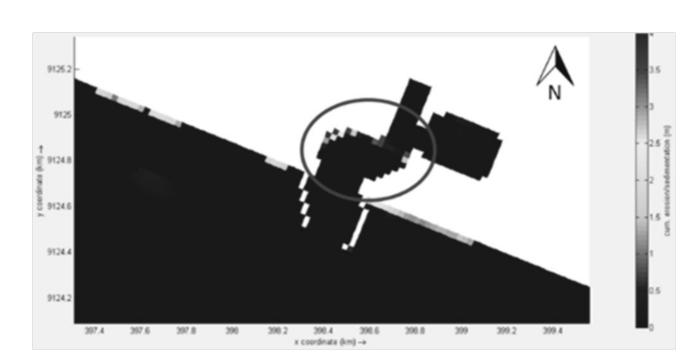
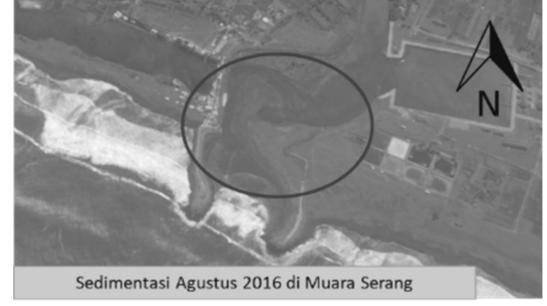
Figure 16. (a) Serang estuary sedimentation model result on east monsoon, (b) Google earth view on January 2016
ability of the Serang River continues to decrease, so it was found that in recent years the Serang estuary is still low. covered with sediment in the wet season.
The results of modelling the existing conditions in the east monsoon at the Serang River estuary showed that sedimentation occurred in the Serang estuary with a maximum thickness of 4 m with a sedimentation area of approximately 0.437 ha, then based on the modelling it can be seen also on the east side of the Serang estuary there was a buildup of sediment which caused an updrift effect while on the west side which does not get a sediment supply causes a downdrift effect. The modelling results also show that there is sedimentation that almost covers the body of the Serang river.
The modelling results were compared with aerial observations using Google Earth in August 2016.
Observations using Google Erath in August 2016 also showed that the remaining river flow at the mouth of the Serang estuary was quite small with sedimentation almost covering the entire river body. Comparison with the same model shows that in the monsoon there is a buildup of sediment that almost covers the entire body of the Serang river, this shows that the Serang river discharge in the east monsoon is not sufficient to push sediment in the Serang estuary towards the sea and also the breakwater in the Serang estuary is still not sufficient. effective in reducing sedimentation in the Serang estuary during the east monsoon.
4.6 Serang river morfology analysis
Analysis of channel bottom changes in the Serang river is carried out by providing a cross section line on the model as shown in the figure below, then a comparison
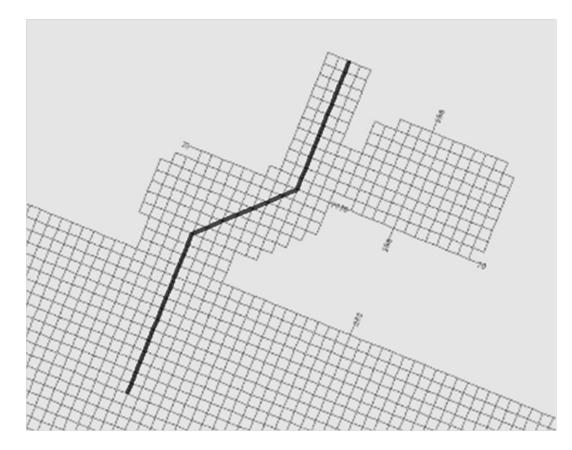
Figure 17. Long section of Serang river
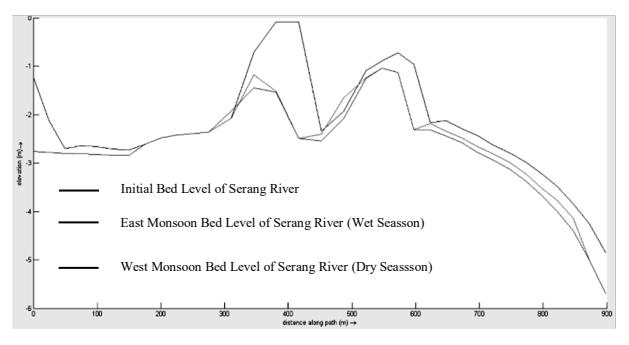
Figure 18. Morfology change of Serang river
is made for the initial conditions and the modeling results for each season.
Comparing the initial conditions and conditions during the east monsoon, it can be seen that a significant
increase in the elevation of the channel bottom occurred, we can see that during the east monsoon there was an increase in the elevation of the Serang riverbed due to the influence of longshore sediments, this of course will result in a decrease in the capacity of the Serang river and cause a backwater effect in the upstream of the Serang river and increase the flood water level.
While the comparison of initial conditions and conditions during the west monsoon, there was a decrease in the elevation of the Serang river bed as a result of the flushing effect caused by the large discharge from the Serang river. However, when compared with the initial conditions the changes in the elevation of the Serang river bed were not significant.
5. Conclusion
The conclusions that we can conclude from the study are:
- 1. The west monsoon conditions the waves (wet season) dominantly came from the west with Hs=1.87 m and Tp=7.09 s, while in the east monsoon conditions the waves (dry season) came from the southeast with Hs=1.89 m and Tp=7.038.
- 2. The modelling results show that the sedimentation thickness in Muara Serang under existing conditions is 3.5 m in the west monsoon (wet season) with an area of 0.063 Ha and 4.0 m in the east monsoon (dry season) with an area of 0.437 Ha
- 3. For this reason it is necessary to control the sedimentation at Serang river estuary. One of the ways to control sedimentation at the Serang river estuary is by increasing the length of the breakwater.
Efforts need to be made to control sedimentation at the Serang river estuary so as not to have an impact on the Serang river upstream caused by a decrease in the capacity of the Serang river and the backwater effect due to sedimentation at the Serang river estuary.
References
- Abfertiawan, M.S. Gautama, R.S. Kusuma, S.B. Notosiswoyo, S., Hydrology simulation of Ukud river in lati coal mine, Evergreen, vol. 3(1), pp. 21–31
- CERC, 1984, Shore Protection Manual, Volume II, US Army Corps of Engineering, Washington (SPM, 1984).
- Farahnaz, N., Kuntoro, A.A., Kusuma M.S.B., 2020. Statistical Downscaling for the Projection of the Keetch Byram Drought Index in the Barito Basin, Int J. on Advanced Science Engineering Information Technology, pp 873-879, Vol 10 (2010) 2. http://dx.doi.org/10.18517/ijaseit.10.2. 10102
- Farid, M., Pusparani H. H., Kusuma M.S.B., and Natasaputra S., 2017. Study on effectiveness of flood control based on risk level: case study of Kampung Melayu Village and Bukit Duri village, MATEC Web Conf. 101 05003.
- Formánek, A., Silasari, R., Kusuma, M.S.B., Kardhana, H., Two-dimensional Model of Ciliwung River Flood in DKI Jakarta for Development of the Regional Flood Index Map. Journal of Engineering and Technological Sciences, Vol. 45, Issue 3, 2013, pp. 307-325
- Gunawan, T.A., Kusuma, M.S.B., Cahyono, M., and Nugroho, J., The Application of Backpropagation Neural Network Method to Estimate the Sediment Loads. MATEC Web of Conferences 101, 2017, 05016.
- Haltas, I., Tayfur, R., and Elci, S., Two-dimensional Numerical Modeling of Flood Wave Propagation in an Urban Area due to Urkmez Dam-break, Izmir, Turkey. Natural Hazards, Vol. 81, 2016, pp.2103-2119.
- Kesuma, T.N.A., Saputra, D., Farid, M., Kusuma, M.S.B., Kuntoro, A.A., Contribution of Manggarai gate improvement to flood in Manggarai Village based on recorded flood event, IOP Conference Series: Earth and Environmental Science 737 (1), 012027
- Kuntoro A.A., Putro A.W., Kusuma M.S.B., Natasaputra S., 2017 The effect of land use change to maximum and minimum discharge in Cikapundung river basin the 3rd International Conference on Construction and Building Engineering (ICONBUILD) 1903 p 100011- 1,100011-7, DOI: https://doi.org/10.1063/1. 5011621
- Kusuma, M.S.B., Rahayu, R.A., and Cahyono, Development Study of Turbulent κ-ε Model for Recirculation Flow III: Two Dimension Recirculation Flow in a Reservoir. ITB Journal of Engineering Science, Vol. 41, Issue B(1), 2009, pp. 1-16
- Kusuma, M.S.B., Setiawati, T., and Farid, M., Experimental Model of Dam Break Flow around several Blockages Configurations. International Journal of GEOMATE, Vol. 16, Issue 58, 2019, pp. 26-32.
- Papagiannaki, K., Lagouvardos, K., Kotroni, V., and Bezes, A., 2015. Flash flood occurrence and relation to the rainfall hazard in a highly urbanized area Nat. Hazards Earth Syst. Sci. 15 1859–1871, www.nat-hazards-earth-systsci.net/ 15/1859/2015/, DOI:10.5194/nhess-15- 1859-2015
- Rahayu, H.P., Haigh, R., Amaratunga, D., Kombaitan, B., Khoirunnisa, D., Pradana, V., 2019, A micro scale study of climate change adaptation and disaster risk reduction in coastal urban strategic planning for the Jakarta, International Journal of Disaster Resilience in the Built Environment, vol. 11(1), pp. 119–133
- Salim, H., Kusuma, S.B., Nazili, 2006. Mathematical model of spit growth in serayu estuary, central Java, Indonesia, Proceedings of the International Offshore and Polar Engineering Conference, pp 746–750
- Sarminingsih, A., Soekarno, I., Hadihardaja, I. K., Kusuma, M.S.B., 2014. Flood Vulnerability Assessment of Upper Citarum River Basin, West Java, Indonesia. International Journal of Applied Engineering Research, Vol. 9, Issue 23, pp. 22921 -22940
- Sengara, I.W., Latief, H., Kusuma, S.B., Probabilistic seismic and tsunami hazard analysis for design criteria and disaster mitigation in rehabilitation and reconstruction of a coastal area in city of Banda Aceh, Geotechnical Engineering for Disaster Mitigation and Rehabilitation - Proceedings of the 2nd International Conference GEDMAR08, 2008, pp. 224–230
- Valerian, J.R., Rohmat, F., Kardhana, H., Kusuma, M.S.B., Yatsrib, M., Sadewa satellite remote sensing data to Manggarai 1-hour water level machine learning model, 2021 8th International Conference on Advanced Informatics: Concepts, Theory and Applications (ICAICTA), IEEE, pp 1- 6
- Yatsrib, M., Tajri, R., Rifdah, S., Chrysanti, A., Kusuma, M.S.B., Assessment of flood risk reduction in DKI Jakarta: Cengkareng Subdistrict, IOP Conference Series: Earth and Environmental Science 737 (1), 012026
| The Influence of Sedimentation to The Morfology | |
|---|---|
| 176 Jurnal Teknik Sipil |