
Abstrak
Bandung dipilih sebagai daerah percontohan proyek Mass Transit (MASTRAN) Indonesia yang bertujuan untuk meningkatkan mobilitas dan aksesibilitas perkotaan. Dengan adanya proyek MASTRAN ini, simpul-simpul transportasi umum seharusnya dapat diakses oleh semua moda, salah satunya dengan berjalan kaki. Namun di wilayah perkotaan di Indonesia, aktivitas berjalan kaki masih belum menjadi pilihan. Menurut beberapa penelitian, hal ini disebabkan oleh kurangnya kelayakan infrastruktur dan lingkungan pejalan kaki. Oleh karena itu, kualitas infrastruktur dan lingkungan pejalan kaki harus ditingkatkan agar simpul-simpul transportasi umum tersebut mudah dijangkau oleh pejalan kaki. Dalam hal ini, penilaian walking permeability dan walking effort dipilih sebagai alat untuk menilai kemampuan pejalan kaki untuk berjalan kaki. Dengan melakukan penilaian tersebut diperoleh bahwa Stasiun Kiaracondong memiliki rata-rata nilai WPDI dan WPTI terbesar dengan nilai masingmasing sebesar 1,48 dan 1,90. Selain itu, Stasiun Bandung Selatan mempunyai indeks walking effort terbesar yaitu sebesar 1,66. Dengan menganalisis hasil dari kedua penilaian tersebut, dapat disimpulkan bahwa peningkatan WPDI cenderung meningkatkan WPTI. Selain itu, dapat juga disimpulkan bahwa stasiun memiliki pertambahan waktu yang lebih tinggi dibandingkan terminal bus karena adanya peningkatan jarak yang diperlukan untuk akses pejalan kaki ke pintu masuk terminal utama.
Kata-kata Kunci: Fasilitas pejalan kaki, walking permeability, walking effort, terminal.
1. Introduction
Among the major cities in Indonesia, Bandung was chosen as a pilot area for Indonesian Mass Transit (MASTRAN) project (The World Bank, 2022). The MASTRAN project aims to increase urban mobility and accessibility, especially in urban areas with high mobility and strengthen institutional capacity for the development of mass transportation. Construction of public transportation electrification in Bandung area is planned to begin in Q3 2024, supported by financing of 224 million USD by the Board Executive Directors of
World Bank on May 20th, 2022 (The World Bank, 2023). Bandung Raya was chosen because it is included in the third largest urban agglomeration with Bandung City being the second most populous city in Indonesia. Numerous factors impact in the efficiency of a transit network, including its routes, coverage area, station placement, amenities, and accessibility. A terminal's accessibility refers to how easily people can reach it, with walking accessibility being particularly crucial in determining transit system usage. As a form to support this project, a terminal which is accessible through pedestrian facilities is needed in accordance with feasibility assessment.
With this MASTRAN project, public transportation nodes should be accessible by all modes, one of which is walking. Walking is the simplest mode of transportation to move from one place to another. As a part of traffic, pedestrian movement must be regulated in such a way that it can be carried out safely and comfortably like the movement of other traffic components. However, in urban areas in Indonesia, walking activities are still not an option (Wibowo, 2015). This is evidenced by the fact that Indonesia is considered as the lowest rank in walking activities with an average of 3,513 steps per day compared to other cities or countries such as Hong Kong with the average citizen walks 6,880 steps per day and Ukraine with an average of 6,107 steps per day (Althoff, 2017). According to some studies, this is caused by the lack of walking infrastructure and environment (Tanan N. W., 2017). Focusing on the principles of planning pedestrian facilities by Ministry of Public Works and Housing (2017), these facilities must adhere to requirements to integrate systems seamlessly, from environmental arrangements, transportation systems, to interconnection between areas; ensuring continuity by smoothly connecting origin and destination locations; guaranteeing safety, security, and comfort; and considering accessibility by ensuring that planned facilities can be accessed by all users, including those with physical limitations. Besides, according to Land Transport New Zealand (2007), the extent to which an environment has an environmentally friendly impression for pedestrians can be called walkability. In this research, walking pearmeability and walking effort are chosen as tools to assess the pedestrian walkability to the selected terminals in Bandung City. To pursue the MASTRAN project and long-term improvement of pedestrian walkability, the correlation between walking pearmeability and walking effort needs to be analyzed.
2. Literature Review
2.1 Walking permeability
Based on previous research, accessibility indices have been developed by geographers based on mathematical abstractions of transportation networks (Yakovleff, 2012). However, these indices are more suitable for large areas, as a whole system. They are not useful at smaller neighborhood and pedestrian scales such as the scope of review in this study (Yakovleff, 2012). The solution to this problem is to use the pedestrian permeability index approach.
How easily pedestrians can penetrate some blocks in the city center is indicated by pedestrian permeability. The first and most basic accessibility index is discussed in Maghelal (2011) and Allan (2001). It measures how functionally close a hypothetical point is to another point in a network, or how close it is, and is a better measure of real-world connectivity. Walking Permeability Distance Index (WPDI) and Walking Permeability Time Index (WPTI) are two indices that were formulated with the consideration that pedestrians do not have the time and stamina to cover unnecessary distances or routes. These two indices are marked with a value of 1 as the ideal situation that planners want to achieve with the following explanation.
1. Walking Permeability Distance Index (WPDI) is the ratio between the shortest distance between origin and destination (DD) to the actual distance to the most practical route (AD). This index is used to determine if a network is permeable enough to allow pedestrians to walk directly to the destination with a WPDI value of 1.5 as the maximum accessibility limit.
\[WPDI = \frac{Actual\ Distance\ by\ Most\ Practical\ Route\ (AD)}{Direct\ Distance\ between\ Origin\ and\ Destination\ (DD)}\](1)
2. The Walking Permeability Time Index (WPTI) is the ratio between the travel time for the shortest distance between the origin and destination (ADT) and the actual travel time for the most practical route (DDT). This index is considered to have a more realistic approach in conditions where pedestrians must share the network with other modes of transportation because there are no dedicated pedestrian paths. Distance may not be a sufficiently accurate factor if pedestrians have limited crossing opportunities. The WPTI has a value of 1.5 as the maximum accessibility limit, but a value greater than 2 may be required to indicate a practical limit for pedestrian accessibility to certain facilities (Allan, 2001).
\[WPTI = \frac{Actual\ Direct\ Distance\ in\ Time\ (ADT)}{Direct\ Distance\ in\ Time\ (DDT)}\](2)
2.2 Walking effort
Walking accessibility is also indicated by how much walking effort is required to access a place on foot. Some researchers have conducted calculations of walking accessibility by walking effort. Tang, Wong, & Wong Wai (2020) developed an enhanced Waling Accessibility Measurement Tool (WAAT) for measuring walking accessibility within the complex, multi-level, hilly terrain of urban Hong Kong. WAAT employs walking time to gauge walking effort and integrates factors such as street terrain, formal crossings, physical walking obstructions, designated access points, and uneven walking speed. WAAT conducted analysis within sensitive to a 3D and complex walking environment, also uphill and downhill. M.A & M.R (2005) conducted an analysis on the walking accessibility of transit stations in Kuala Lumpur, incorporating the impact of walking distance on the level of effort needed. This analysis, carried out by GIS-based transit system modeling, revealed that accessibility to a transit station is significantly higher when the distance is short, but if stations situated in secluded areas pose greater challenges for pedestrian access. Olzewsky & Wibowo (2005) calculated walking accessibility by developing a calculation of walking effort at the Mass Rapid Transit Terminal in Singapore. Walking effort is calculated using the Equivalent Walking Distance (EWD) concept, that means the characteristics of pedestrian routes influence the quality of accessibility of a place. Each component of the pedestrian route will be converted into an equivalent distance. All forms of pedestrian routes to a place, such as walkways, sidewalks, and crossing areas have several elements that can influence walking efforts. This journal will use the basic model of Equivalent Walking Distance according to Olzewski & Wibowo (2005).
\[EWD = WDIST + f(pedestrian route characteristics)\](3)
This model was created with the assumption that the characteristics of the pedestrian route traversed have a linear relationship with the equivalent value of pedestrian distance. Based on the equation above, EWD consists of two components, namely WDIST which is the actual walking distance, and the second function is the converted distance based on the characteristics of the pedestrian route. WDIST is obtained by conducting direct measurement surveys, as well as values for components on walking routes obtained through the Walking Access Model. These components consist of the number of steps, number of crossings, and number of conflicts with vehicles. The equation for EWD is as follows.
\[EWD = WDIST + \frac{\beta_4}{\beta_2}RXING + \frac{\beta_5}{\beta_2}ASTEP + \frac{\beta_6}{\beta_2}TCONF\] (4)
The value of the coefficient for each component is obtained from the Walking Access Model. In this journal, an equation will be used according to Olzewsky and Wibowo (2005) with the assumption that each component of the pedestrian route has similar conditions and characteristics. The following is the EWD equation that will be used in calculating walking effort.
\[EWD = WDIST + 55.4 RXING + 2.81 ASTEP + 36.31 TCONF\] (5)
Information:
EWD = equivalent walking distance (meters)
WDIST = walking distance (meters)
RXING = number of crossings
ASTEP = number of uphill roads (stairs)
TCONF = number of conflicts on pedestrian routes
High calculation results will show that walking accessibility to a place is increasingly difficult. The ratio between EWD and WDIST means that there is an additional distance that must be covered due to the characteristics of the pedestrian route taken. A high ratio value will indicate that the effort expended to access a place is greater.
3. Methodology
The research methodology is described through the following flowchart Figure 1. This research begins with determining the points of origin and destination. It is used to find out the potential walking distance that people are willing to walk. The road sections need to be defined as part of the selected route from point of origin to point of destination. The preliminary survey aims to obtain an overview of the road section and environmental conditions on the specified route. The segments on the pedestrian path are the output of a preliminary survey process with limitations that include availability of walking track infrastructure, type and surface condition of pedestrian paths, and presence or absence of intersections.
Data collection was carried out using two methods, such as questionnaires and field surveys. A questionnaire was conducted to determine the point of origin with 30 respondents who had walked to the destination terminal. A field survey was carried out to see the condition of the pedestrian route and to count the number of steps of each route taken with a pedometer. Calculations are carried out for walking assessment of selected pedestrian routes. The walking assessment is carried out using walking permeability which was developed by Allan (2001) and walking effort which was developed by Olszewsky and Wibowo (2005). An evaluation is given after a walking assessment is carried out for each route from the selected pedestrian to the destination terminal.
The following is a flow chart for the walking assessment calculation stages (Figure 2, Figure 3)
3.1 Data Collection
Walking accessibility assessment will be carried out for seven terminals in Bandung City. These areas are type
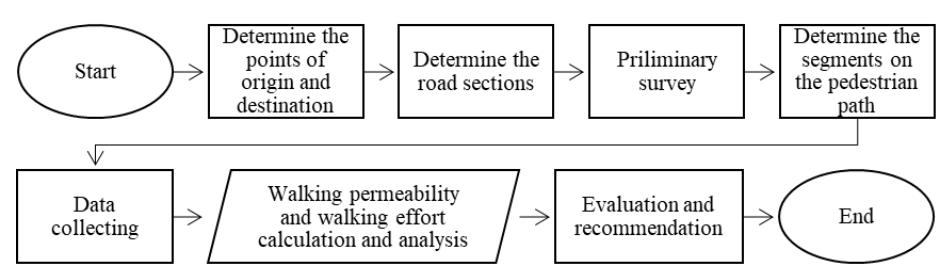
Figure 1. Walking assessment methodology flow chart
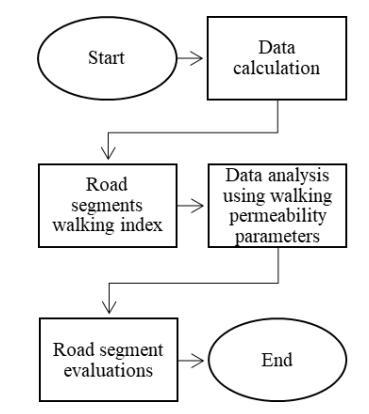
Figure 2. Walking permeability flow chart
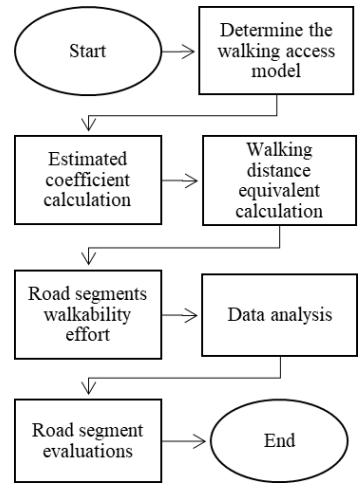
Figure 3. Walking effort flow chart
A and B terminals with the list of locations for the study area can be seen in Table 1.
Data collection is done by field surveys. The Field survey aims to measure walking distance, number of road crossings and delay time, number of ascending and descending steps for elevated road crossings, and conflict points. Walking distance is obtained by converting the number of steps for each route. Besides, the field survey also determines the characteristics of walking infrastructure and environment.
For each study area, determine the center activity of the location and it should be a destination that most people will reach by walking. The destination can be the main gate of the terminal. After that, determine the catchment area as a circular area with 500 meters of radii from the destination. Within the catchment area, identify some origin points within 500 meters of airline distance from the destination.
4. Data Analysis and Discussion
4.1 Walking permeability
Pedestrian permeability is measured by an index of distance and travel time from selected origin locations (origin) to the terminals (destination). The following are the calculation results of the Walking Permeability Distance Index (WPDI) and Walking Permeability Time Index (WPTI) for each origin.
Looking at the Table 2, it is found that Cicaheum Terminal has the smallest value of average WPDI and WPTI. Both values are smaller than 1.5 and the closest to 1. This value indicates that Cicaheum Terminal area has the best pedestrian accessibility compared to other terminals' areas based on the distance and travel time. Different from Cicaheum Terminal, Kiaracondong Station has the biggest value both on average WPDI and WPTI. Although the value of average WPDI is still smaller than 1.5, but it should be improved so the value becomes smaller and closer to 1.0. Besides that, the value of the average WPTI of Kiaracondong Terminal is the biggest among others. It is bigger than 1.5 and closer to 2.0. Apart from Kiaracondong Terminal, North and South Bandung Station also have the value of average WPTI bigger than 1.5. This value indicates that the crossings and obstacles on pedestrian paths need to be improved. According to the site condition, these terminals have a high number of vehicles passing by the road, so it took more than a minute to cross the road. To conclude, all the selected origins have good pedestrian accessibility except for Kiaracondong Station, Bandung North Gate Station, and Bandung South Gate Station that need to be improved for its crossing facilities and obstacles on the pedestrian paths.
Table 1. The relationship between the walkability index and the conditions of pedestrian facilities
| Type of Area | Location | Remarks | ||||
|---|---|---|---|---|---|---|
| Cicaheum Terminal | The destination point is the entrance gate right at the ticket counter on A. Yani Street. | |||||
| Bus Terminal Type A | Leuwipanjang Terminal | The destination point is the entrance to the terminal building (right after the parking area) on Leuwi Panjang Street. | ||||
| Hall Kebon Jati Station Terminal | The destination point is the entrance gate on Suniaraja Street. | |||||
| Bus Terminal Type B | Ledeng Terminal | The destination point is the entrance gate on Dr. Setiabudi Street. | ||||
| North Bandung Station | The destination point is the entrance gate for pedestrian on Kebon Kawung Street (near the car park entrance) | |||||
| Railway Station | South Bandung Station | The destination point is the entrance gate on Stasiun Timur Street | ||||
| Kiaracondong Station | The destination point is the entrance gate on Stasiun Lama Street (near the motorcycle parking area) | |||||
Table 2. Terminals walking permeability
| Destination | Route_# | DD (m) | AD (m) | WPDI | Average WPDI | DDT (s) | ADT (s) | WPTI | Average WPTI |
|---|---|---|---|---|---|---|---|---|---|
| Route_1 | 437 | 492 | 1.13 | 350 | 481 1.38 | ||||
| Cicaheum | Route_2 | 273 | 280 | 1.03 | 1.06 | 218 | 241 | 1.10 | 1.20 |
| Terminal | Route_3 | 207 | 212 | 1.02 | 1.00 | 166 | 202 | 1.22 | 1.20 |
| Route_4 | 260 | 273 | 1.05 | 208 | 225 | 1.08 | |||
| Route_1 | 412 | 488 | 1.18 | 330 | 493 | 1.50 | 1.35 | ||
| Leuwipanjang | Route_2 | 365 | 477 | 1.31 | 1.19 | 292 | 407 | 1.39 | |
| Terminal | Route_3 | 402 | 445 | 1.11 | 1.19 | 322 | 385 | 1.20 | |
| Route_4 | 55 | 65 | 1.18 | 44 | 57 | 1.30 | |||
| Route_1 | 258 | 361 | 1.40 | 206 | 371 | 1.80 | |||
| Hall Kebon Jati | Route_2 | 317 | 411 | 1.30 | 1.25 | 254 | 462 | 1.82 | 1.45 |
| Station Terminal | Route_3 | 411 | 441 | 1.07 | 1.23 | 329 | 355 | 1.08 | |
| Route_4 | 147 | 183 | 1.24 | 118 | 131 | 1.11 | |||
| Route_1 | 451 | 467 | 1.04 | 361 | 426 | 1.18 | |||
| Ledeng Terminal | Route_2 | 108 | 208.4 | 1.93 | 1.34 | 86 | 135 | 1.56 | 1.31 |
| Route_3 | 276 | 292.1 | 1.06 | 221 | 265 | 1.20 | |||
| Route_1 | 215 | 226 | 1.05 | 172 | 303 | 1.76 | |||
| North Bandung | Route_2 | 100 | 107 | 1.07 | 1.00 | 80 | 202 | 2.53 | 1 70 |
| Station | Route_3 | 347 | 361 | 1.04 | 1.09 | 278 | 298 | 1.07 | 1.70 |
| Route_4 | 308 | 363 | 1.18 | 246 | 360 | 1.46 | |||
| Route_1 | 72 | 91 | 1.26 | 58 | 59 | 1.02 | |||
| Bandung Station R | Route_2 | 67 | 75 | 1.12 | 1.21 | 54 | 95 | 1.77 | 1.71 |
| Route_3 | 310 | 326 | 1.05 | 248 | 350 | 1.41 | |||
| Route_4 | 136 | 190 | 1.40 | 109 | 286 | 2.63 | |||
| Route_1 | 242 | 255 | 1.06 | 194 | 221 | 1.14 | |||
| Kiaracondong Station | Route_2 | 217 | 434 | 2.00 | 1.48 | 174 | 425 | 2.45 | 1.90 |
| Route_3 | 217 | 303 | 1.40 | 174 | 365 | 2.10 |
4.2 Walking effort
The effort of walking can be quantified by Equivalent Walking Distance (EWD) concept. The EWD model contains two components, which are the actual walking distance and the distance that is converted from the components of the pedestrian route. The EWD model that will be used is the actual walking distance with the equivalent distance of the components of the pedestrian route. The ratio between EWD and WDIST is the additional distance that can represent the gain in walking effort. The ratio with higher value means that more effort to walk is needed. The value of WDIST, EWD, and the ratios are shown as follows.
The effort of walking for the seven study areas is represented by the additional walking distance as shown in table above. The additional distance is caused by the characteristic of walking route among the study areas, such as the number of crossing road, ascending steps, and number of traffic conflict. On average, the seven study areas have 49% of additional walking distance. South Bandung Station has the longest additional walking distance on average, which is around 66%, while Leuwipanjang Terminal is the shortest with 39% of additional distance on average. North and South
Bandung Station have more than 50% added distance. That means some of terminals have more difficulties so need put additional effort to walk around. Based on the calculation of EWD, walking facilities can be improved to reduce some traffic conflicts and provide a better walking path, especially for terminals that have additional distance more than 50%.
4.3 Result
Based on the calculation above, the values of walking permeability and effort of each station and terminal can be summarized through Table 4.
4.3.1 Stations
Stations have increased the actual walking distance in average (WPDI) is less than 30%, travel time in average (WPTI) is more than 50% and walking distance due to characteristics in average (Walking Effort) is more than 50%. Actual walking distance increases due to the connection of walking path between origin places and stations. Kiaracondong Station has the largest WPDI value because the original route has a path that leads to the alley way, making the path more circuitous. Besides, additional distance because of the entrance
Table 3. Terminals walking effort
| Destination | Route_# | WDIST | RXING | ASTEP | TCONF | EWD | ||
|---|---|---|---|---|---|---|---|---|
| Route_1 | 492 | 2 | 0 | 3 | 711.53 | 1.45 | ||
| Cicaheum | Route_2 | 280 | 0 | 0 | 2 | 352.77 | 1.26 | 1.32 |
| Terminal | Route_3 | 212 | 1 | 0 | 1 | 303.61 | 1.43 | |
| Route_4 | 273 | 0 | 0 | 1 | 309.31 | 1.13 | ||
| Route_1 | 488 | 2 | 0 | 2 | 671.57 | 1.38 | 1.47 | |
| Leuwipanjang | Route_2 | 477 | 0 | 0 | 1 | 513.41 | 1.076 | |
| Terminal | Route_3 | 445 | 0 | 0 | 0 | 444.6 | 1 | |
| Route_4 | 65 | 1 | 0 | 1 | 156.71 | 2.41 | ||
| Route_1 | 361 | 1 | 0 | 4 | 562.04 | 1.56 | ||
| Hall Kebon Jati Station Terminal | Route_2 | 411 | 3 | 0 | 2 | 649.57 | 1.58 | |
| Route_3 | 441 | 0 | 0 | 3 | 549.63 | 1.25 | 1.47 | |
| Route_4 | 183 | 1 | 0 | 1 | 274.36 | 1.5 | ||
| Route_1 | 467 | 1 0 2 595.02 1.27 | ||||||
| Ledeng Terminal | Route_2 | 208.4 | 2 | 0 | 1 | 355.51 | 1.71 | 1.49 |
| Route_3 | 292.1 | 2 | 0 | 1 | 439.21 | 1.5 | ||
| Route_1 | 226 | 1 | 0 | 1 | 317.91 | 1.41 | ||
| North Bandung | Route_2 | 107 | 1 | 0 | 2 | 235.27 | 2.19 | |
| Station | Route_3 | 361 | 0 | 32 | 0 | 450.67 | 1.25 | 1.53 |
| Route_4 | 363 | 1 | 0 | 1 | 455.02 | 1.25 | ||
| Route_1 | 91 | 0 | 0 | 1 | 127.31 | 1.39 | ||
| South | Route_2 | 75 | 0 | 0 | 1 | 111.31 | 1.48 | |
| Bandung Station | Route_3 | 326 | 2 | 1.66 0 4 581.69 1.79 | ||||
| Route_4 | 190 | 2 | 0 | 2 | 373.42 | 1.97 | ||
| Kiaracondong Station | Route_1 | 255 | 0 | 0 | 1 | 291.76 | 1.14 | 1.36 |
| Route_2 | 434 | 1 | 0 | 3 | 597.88 | 1.38 | ||
| Route_3 | 303 | 1 | 0 | 3 | 467.23 | 1.54 | ||
| Average | 1.49 |
Table 4. Comparison between walking permeability and walking effort
| Walking Permeability | |||
|---|---|---|---|
| Location | WPDI | WPTI | Walking Effort |
| Cicaheum Terminal | 1.06 | 1.2 | 1.32 |
| Leuwipanjang Terminal | 1.19 | 1.35 | 1.47 |
| Hall Kebon Jati Station Terminal | 1.25 | 1.45 | 1.47 |
| Ledeng Terminal | 1.34 | 1.31 | 1.49 |
| North Bandung Station | 1.09 | 1.7 | 1.53 |
| South Bandung Station | 1.21 | 1.71 | 1.66 |
| Kiaracondong Station | 1.48 | 1.9 | 1.36 |
access from the gate to the terminal building also involves increasing the actual walking distance. The value of actual walking distance will impact travel time.
The enhancement of walking distance due to the characteristics of pedestrian path also results in an increase in travel time. North and South Bandung Stations have a large increase of walking distance because both stations are in public activities, such as commercial areas, so that the route passes through many vehicles entrance access for buildings. The pedestrian path also passes through some crossings that will impact the walking effort. Because of the pedestrian path in the collector road with high traffic, it raises large waiting
time when pass the crossing area. Kiaracondong Station has the smallest walking effort because the pedestrian paths are mostly in-residence area. Based on the values of all parameters, all the stations have an actual distance with a low increase, but they have a high increase in travel time due to the characteristics of the pedestrian path. These conditions are proven by the small values of WPDI and high values of WPTI.
4.3.2 Type A bus terminal
Based on their services, Leuwipanjang and Cicaheum Terminal are type A terminals. These terminals are in the central area of community activities, especially
trade activities. Based on the survey conducted, it was found that the value of the increase in distance and travel time compared to actual conditions was quite different between those terminals. This is due to the location of the entrance to the Cicaheum Terminal building which is on the edge of the collector road so that the increase in distance and travel time is quite small compared to Leuwipanjang Terminal with its entrance which is 50 meters from the edge of the collector road.
Apart from that, it was also found that the increase in actual distance from the Leuwipanjang Terminal was 34%, while Cicaheum Terminal was only 6%. The increase in actual distance from the Leuwipanjang Terminal is due to the increase in distance that pedestrians need to travel to reach the terminal building entrance. Meanwhile, the Cicaheum Terminal building entrance is not far from the collector road and this terminal has routes that tend to be straight so the increase in actual distance quite small. The increase in actual distance from the Cicaheum Terminal, which is smaller than 10%, means that the increase in travel time is only 20%. This increase in time is also influenced by the increase in distance due to the characteristics of the pedestrian path which is only 32% (Figure 4).
4.3.3 Type B bus terminal
Ledeng and Kebon Jati Terminal are both in commercial and educational areas. Walking effort, walking distance,
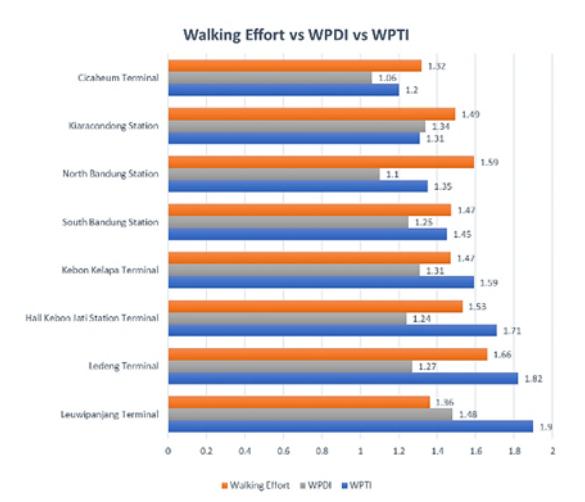
Figure 4. Walking effort vs WPDI vs WPTI
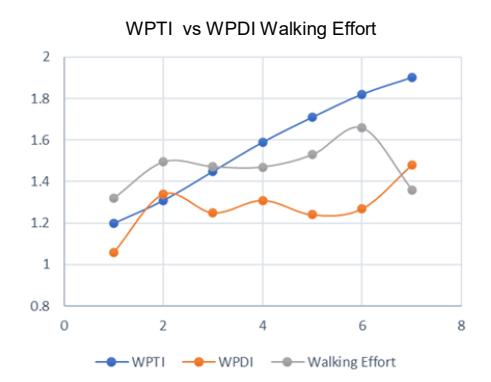
Figure 5. Walking effort vs WPTI
and walking time have a slight difference between those two terminals. This is due to the almost similar characteristics of pedestrian paths, especially in terms of crossings, parallel and transverse conflicts, as well as side obstacles. The terminal buildings are both located on the edge of the collector road. In addition, it was found that the increase in the actual distance between the two terminals was greater than 30%. This is caused by quite a circuitous road. This increase in distance is also caused by the characteristics of pedestrian paths which reach 49% and 47%. This large increase in distance certainly results in an increase in time.
Based on the discussion above, it can be concluded that stations, type A, and B terminals are mostly located in the central area of community activities, such as commercial, educational, and residence area. Both stations and terminals experienced an average actual distance increase of less than 50% with pedestrian routes mostly connected to collector roads. This condition indicates that the existing pedestrian routes are circuitous. Besides that, both stations and terminals have an increase in distance due to the characteristics of pedestrians with a range of 30 - 60%. By reviewing its time increments, stations have higher time increments than terminals. This can be seen from the North and South Bandung stations which have quite high walking efforts, namely greater than 50% and the Kiaracondong station which has the highest increase in actual distance.
5. Recommendation
The recommendations below are given for each parameter whit a value greater than 1.5, which is determined as the index that is considered feasible for walkability.
5.1 South Bandung Station
South Bandung Station is located 100 meters from the intersection of the 4 arms of Stasiun Timur Street. This indicates that a pelican crossing needs to be installed 50 meters after the intersection due to high pedestrian demand. To facilitate pedestrians moving to and from the station, zebra crossing and rumble street facilities need to be installed 5 meters before the vehicle exit on Stasiun Timur Street.
5.2 North Bandung Station
At North Bandung Station, a zebra crossing is currently positioned between the entrance and exit of motor vehicles, raising serious concerns about pedestrian safety. Consequently, it is recommended to remove the existing zebra crossing and replace it with a new pelican crossing facility. According to the Technical Guidelines for the Engineering of Public Passenger Vehicle Stops (1996), the minimum distance between a bus stop and a crossing should be 20 meters. Considering to the high traffic demand and the need to avoid disrupting bus passenger boarding and alighting, the pelican crossing is planned to be installed 50 meters before the bus stop sign.
5.3 Kiaracondong Station
Kiaracondong Station is located in a densely commercialized area, specifically a marketplace. As a result, the presence of numerous narrow alleys leads to increased actual walking distances and numerous traffic conflicts. Therefore, a detailed study considering social, economic, and transportation factors is required to develop recommendations for facility improvements aimed at reducing both walking time and distance.
6. Conclusion
- 1. This paper aims to assess the walkability of major terminals and stations in Bandung City by evaluating walking permeability and walking effort, based on the distance and duration of walking. Field surveys were conducted to collect data on the walking distance and duration for each pedestrian route from the terminals and stations. The analysis results indicate a correlation between walking permeability and walking effort.
- 2. The analysis shows that an increase in distance can lead to longer walking durations, as evidenced by a rise in WPDI values relative to WPTI. For example, Kiaracondong Station has a WPDI of 1.48 and a WPTI of 1.9, indicating low walking effort. Additionally, higher walking effort values tend to correlate with longer walking durations, as observed at North Bandung Station, where a walking effort of 1.53 and a WPTI of 1.7 suggest greater difficulty in walking, but with a lower WPDI value.
- 3. The differences in walkability between stations and terminals are also highlighted in this analysis. Stations exhibit higher time increments compared to bus terminals, primarily due to the increased distance required for pedestrian access to the main terminal entrance. This is reflected in the higher WPTI values observed at stations.
- 4. This paper also provides recommendations to reduce WPTI and walking effort values above 1.5, as observed at North and South Bandung Stations. The suggested improvement is the installation of pelican crossings to reduce pedestrian-vehicle conflicts on high-traffic roads with further impact analysis is needed to assess the addition of these facilities.