
Abstrak
Merancang infrastruktur tentu memperhitungkan beban rencana yang mungkin terjadi. Selain beban rencana, mungkin terjadi beban yang tidak disengaja seperti yang terjadi pada jembatan Pedamaran II di Riau. Terjadi kecelakaan pada jembatan dimana fondasi jembatan tertabrak oleh kapal hingga terjadi patah pada sejumlah tiang. Hal tersebut namun tidak membuat kegagalan struktur pada jembatan walaupun jumlah tiang yang patah mencapai lebih dari 30% dari jumlah tiang. Hipotesis awal adalah adanya dampak dari penggunaan bracing pada jembatan eksisting terhadap redistribusi gaya. Sehingga dilakukan pemodelan secara numerik menggunakan Opensees dengan memodelkan pembebanan lateral pada badan salah satu tiang dari sebuah elevated pile cap. Dilakukan pemodelan fondasi 2x2 secara tiga dimensi pada dua kondisi yaitu tanpa bracing dan bracing menggunakan elemen elastik. Tujuan dari penelitian adalah melihat pemodelan yang tepat untuk memodelkan perilaku bracing dan pengaruh bracing terhadap reaksi dari pembebanan. Letak beban yang eksentrik ini akan menimbulkan gaya pada sumbu x dan y. Disimpulkan pemodelan bracing dengan elemen elastik akan mendistribusikan gaya secara merata antar baris tiang, dimana distribusi paling besar terletak pada baris tiang yang dibebani. Momen maksimum terjadi pada sambungan bracing, sehingga menunjukan peran penting bracing dalam mendistribusikan beban. Kurva force-displacement menunjukan bracing akan meningkatkan kapasitas lateral sampai sekitar 60%.
Kata-kata Kunci: Analisis pushover, beban eksentrik, elevated pile cap, opensees
1. Introduction
Bridge construction must be supported by a strong structural system to withstand continuous heavy loads occurring within the planned timeframe (Pusat Litbang Jalan dan Jembatan, 2015). Several things can happen that can affect the strength of a bridge structure, and one of the causes is accidents, such as the accident phenomenon that occurred on the Pedamaran II Bridge
located in the Pekaitan District, Rokan Hilir Regency, Riau. Pedamaran II Bridge is a cable-stayed bridge with a length of 1,200 meters spanning the Rokan River. This bridge uses elevated pile cap foundation with spun and the piles are interconnected with bracing made of steel material, as shown in Figure 1. Pedamaran II bridge uses diagonal bracing between the pile foundation.
Figure 1. Bracing in pedamaran II bridge foundation
In 2021, an accident occurred where a pontoon ship collided with one of the groups of bridge foundation piles. The pontoon ship passing through the lower part of the bridge struck the foundation, resulting in the breakage of some piles and the emergence of cracks in one pile group. 11 out of 30 piles, or approximately 36% of the total, broke and cracks appeared on the pile cap. Figure 2 provides a visualization of the damage to the bridge foundation piles, showing several broken piles.
Figure 2. Damage in pedamaran II bridge foundation
After the damage occurred to the Pedamaran Bridge foundation, the bridge remained in a stable condition, showing no failure in the overall structural system. This phenomenon is interesting, considering the loss of 37% of the pile quantity (assumption that losing 37% of pile will also reduce 37% of the foundation ultimate capacity) and the appearance of cracks in the pile cap should reached an unsafe limit (Kementerian PUPR, 2017). Hence, the writer felt important to explore further understanding about the effect of bracing in the foundation structure when experiencing lateral loading. Bracing in foundation can increase lateral stiffness but also weak to buckling due to compression forces (FEMA, 2011). Bracing on bridges tends to be modeled as tension-only structural elements. The structural elements existing in the foundation will influence the distribution of forces, both lateral forces and moments. The loading points occurring on the structure will also affect the force distribution, where loading points can occur either concentrically or eccentrically to the foundation structure. Eccentric
loads tend to decrease the stiffness of the structure, which affects the stability of the structure (Basha & Eldisouky, 2023).
To investigate this, a simple modeling of the bridge foundation was conducted. The modeling involved a 2x2 bridge foundation with pile and soil material parameters adjusted to the existing conditions of the Pedamaran II Bridge. This simple modeling of a 2x2 pile group is conducted to provide an initial understanding of the behavior of structural elements in the existing foundation as well as the behavior of eccentric loading. Once these aspects are understood, they will serve as a basis for further analysis of the existing foundation of Pedamaran II Bridge. A pushover analysis will be performed on one of the piles, specifically on the pile body, to simulate the failure process in the pile. This research aims to understand the role of bracing in the pushover loading results, focusing on the distribution of loads on the group foundation. The entire study will be facilitated using the Open System for Earthquake Engineering Simulation (OpenSees).
2. Research Method
Figure 3 displays the configuration and dimensions of the pile cap used in the study. At the center of the pile cap, a lumped mass point was applied, representing the pile cap mass. At that lumped mass node, there is axial load from the self-weight of the pile cap and the load from the piles. The axial load originating from the pile load was calculated using the Equation (1).
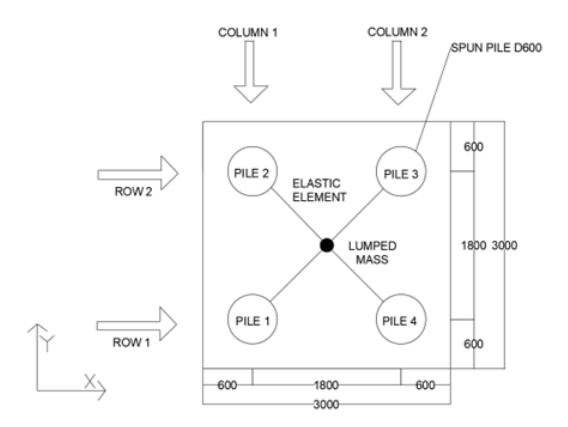
Figure 3. Top view of 2x2 pile cap model
\[Paxial = 0.1 x f c' x Ag\] (1)
where, Paxial: Axial load on the structure (kN), fc': Concrete compressive strength at 28 days (kPa), Ag: Cross-sectional area of the pile (m2 ), and 0.1 is the factor for the maximum axial compressive force. The compressive strength of concrete is 49.8 MPa with a cross-sectional area of 0.157 m². Using Eq. (1) resulted in an axial load for one pile of 781.86 kN and with that the total axial load from pile for 4 pile is 3127.44 kN. Axial force from pile was calculated by multiplying pile cap density with gravity and pile cap volume, resulting in a total axial force of 3551.23 kN. The mass
center was modeled to be able to distribute force to each nodal head of the pile through modeled high stiffness elastic elements, serving only to distribute forces. At the pile head, it was modeled as a pinnedfixed support where the pile head can resist rotational movements in horizontal axes, while rotational movement in the vertical axis was not restrained due to the eccentric load position that can generate torsional forces on the pile head (Tabatabael, 2010).
The pile used in the model was a 47-meter-long spun pile with 36 m embedded in soil. In the numerical modeling of the pile, it is necessary to identify the plastic length of the pile section, According to in FHWA (Federal Highway Administration, 2014), plastic length (Lp) is calculated using Equation (2)
\[Lp = 0.1H' + D \le 1.5D \tag{2}\] where, H': length between ground surface and contraflexure point (m) and D: pile diameter. Using Eq. (2) it can be determined that plastic length is 0.9 m. Plastic length should determine nodal placement in numerical model, since plastic node in every 0.9 m will make the model more complicated, it was decided to placed the nodal every 1 m, resulted in 48 nodal with 47 elements in each pile. The element type used was displacement-beam column elements to achieve plasticity distribution along the entire pile, allowing for yielding in each element. The pile section was modeled with a fiber cross-section to capture nonlinearities in concrete without reducing the sectional modulus due to material cracking. Concrete02 (Mazzoni et al, 2010) was used for concrete material, and Steel02 (Mazzoni et al, 2012) was used for PC Strand steel. Concrete02 is one of the uniaxial materials in OpenSees, that incorporate the tensile strength. Since the modeled foundation structure is prestressed concrete, the Concrete02 type was chosen for the model. Steel02 material was selected as the steel material because it possesses isotropic strain hardening capabilities, which are suitable for prestressed column structures. Table 1 shows the dimensions of the pile and pile cap used in the study.
Table 1. Modelling parameters
| Aspect | Parameter | Unit | |
|---|---|---|---|
| Diameter | 600 | mm | |
| Pile | Туре | Spun Pile PC | |
| Inner Diameter 40 | mm | ||
| Length | 47 | m | |
| Height Above Ground 1 | m | ||
| Height Below Ground | 36 | m | |
| Pile Cap | Thickness | 2 | m |
| Width | 3 | m | |
| Length | 3 | m | |
| Pile Spacing | 1.8 | m | |
| Edge Spacing | 0.6 | m | |
| Load | Height Above Ground | 8 | m |
The bracing model used was a steel profile bracing. A type of WF steel with dimensions of 150x150 was employed. elasticBeamColumn model was used for bracing because the assumption was that the bracing only functions to distribute forces without experiencing failure. Therefore, bracing has elastic behavior. The placement of bracing on the pile was done based on estimates from the existing conditions as indicated in Figure 4.
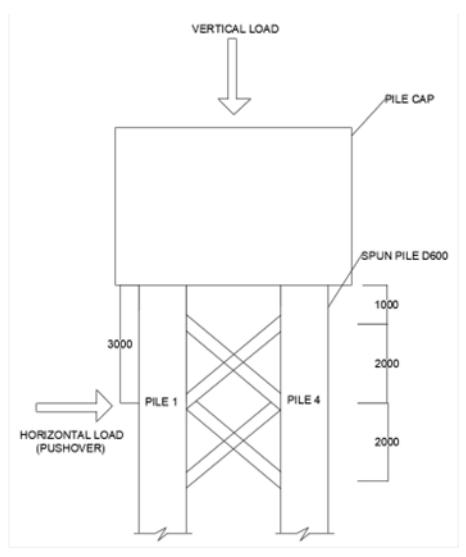
Figure 4. Bracing placement on piles
The soil used was sandy soil, and the ultimate capacity calculation follows the API (1993) method. In the soil modeling process, it is necessary to identify the ultimate capacity (Pult) and the displacement at 50% of the ultimate capacity (y50). The formula for the ultimate capacity of sandy soil is stated in Equation (3)-(5).
\[Pu = min [Pus, Pud]\] (3)
\[Pus = (C1H + C2d)\gamma H \tag{4}\]
\[Pud = C3D\gamma H \tag{5}\] where, Pu: Ultimate soil resistance (kN/m). Pus: Ultimate strength of shallow depth, Pud: Ultimate strength of deep depth, C1 C2 C3: Coefficients based on soil shear angle from API (2005), \(\gamma\) = Soil unit weight (kN/m3), H = Depth of soil for each soil element (m), and d = Pile diameter (m).
Figure 5 is a graph showing the values of C1, C2, and C3 for various values of the soil shear angle. The formula used for the y50 value is stated in Equation (6).
\[y50 = \frac{Apu}{2KhH} ln \underbrace{\frac{1 + \frac{0.5}{A}}{1 - \frac{0.5}{A}}}_{1 - \frac{0.5}{A}}) \tag{6}\] where, y50: Displacement at half of the ultimate soil resistance, A: Load factor (0.9 for cyclic loads and 3-0.8(H/D) for static loads), H: Depth of soil for each soil element (m), Pu: Ultimate soil resistance (kN/m), Kh:
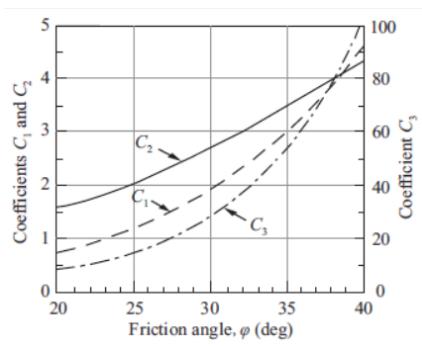
Figure 5. Coefficient C1, C2, and C3 (API,2005)
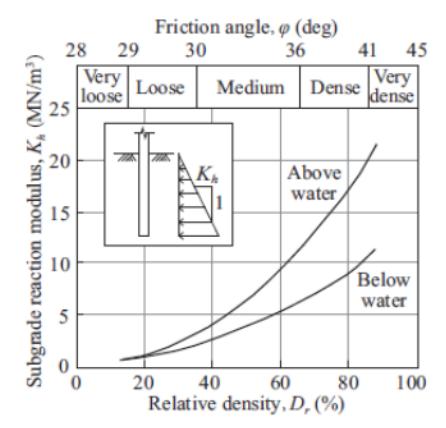
Figure 6. Subgrade modulus reaction (ATC, 1996)
Initial modulus of subgrade reaction (kN/m3). values of the modulus of subgrade reaction for various relative density values shown Figure 6.
Below is Table 2 that is the soil parameter of the model. The soil parameter is then calculated using Eq. (3) – Eq. (6) to calculate the soil capacity in the numerical model. Soil model that is used in the OpenSees numerical model is PySimple1. This soil model can behave as a nonlinear material and it is proven to demonstrate soil behaviour both in monotonic and cyclic loading situation (Boulanger, 2010).
There are two types of loads: axial loads originating from the pile cap load, the self-weight of the pile, and lateral loads, which are pushover loads on the pile body, as illustrated in Figure 4. The load was applied to pile 1, which is 3 m below the pile cap. The load position assumed to be the level of contact between the ship and the pile, precisely at the point between the upper bracing and lower bracing. The pushover load applied is a displacement load with increments of 0.001 m and a maximum displacement value of 0.25 m.
Table 2. Soil model parameters
| Soil Type | Parameter | Unit | |
|---|---|---|---|
| γ' | 6 | kN/m3 | |
| Friction Angle | 38 | mm | |
| C1 | 4 | ||
| Sandy Soil | C2 | 4 | |
| C3 | 80 | ||
| Kh | 8 | MN/m3 |
The model was then validated using capacity calculations for both shear and moment capacities of the cross-section. Utilizing the formula for shear capacity of a concrete spun pile section, a shear capacity of 387,079 kN was obtained. Moment capacity calculations are based on the curvature moment of the section by inputting axial loads for each 2x2 case. In this case, yield moment was obtained as 290 kNm, and the plastic moment is 617.62 kNm. Seeing that the load has its eccentricity which can cause biaxial moment, in this paper only uniaxial bending was analyzed which means only bending along a single axis was considered in analyzing pile group bending moment capacity.
3. Result And Analysis
Force distribution and movement of piles are greatly influenced by the pile positions, hence the determination of row and column numbering for the group pile foundation is important. Figure 3 shows the naming of rows and columns in the 2x2 pile configuration.
Displacement profiles of the piles resulting from lateral loading are examined, as shown in Figures 7 and Figure 8. The analyzed profiles represent displacement during the final stage of loading conditions.
The movement in the x-axis for both conditions show similar results, with all piles moving in the positive xaxis direction. The movement in the y-axis also shows similar results in both conditions, where pile 1 & 2 (column 1) moves in the negative y-axis direction, and pile 3 & 4 (column 2) moves in the positive y-axis direction. The difference in the condition with elastic bracing is that the displacement is smaller compared to the condition without bracing. If illustrated, the movement would be as follows.
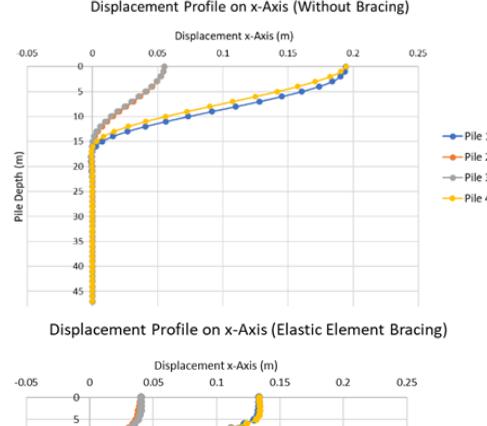
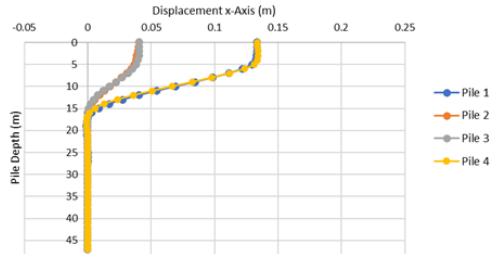
Figure 7. Displacement profile in X-axis direction
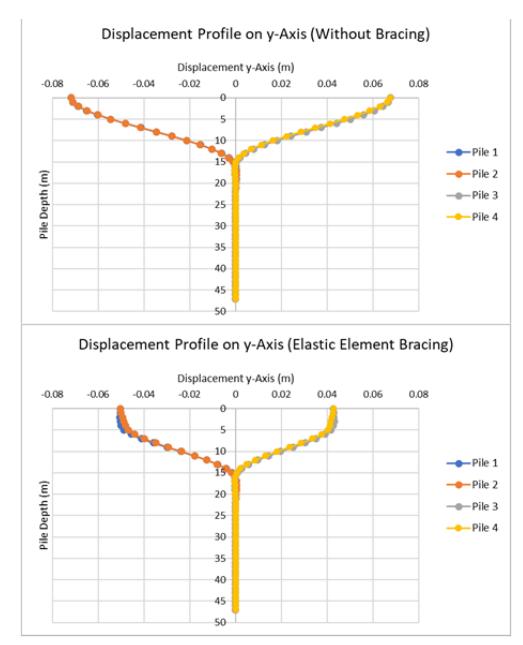
Figure 8. Displacement profile in Y-axis direction
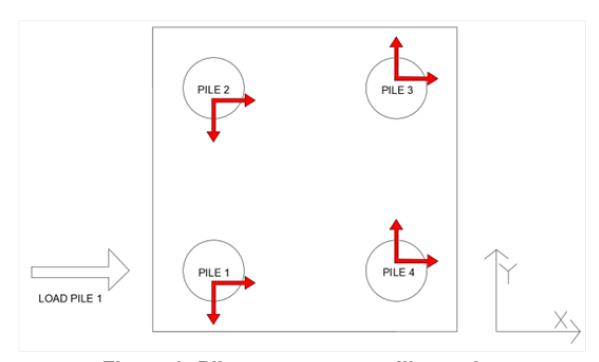
Figure 9. Pile cap movement illustration
Figure 9 illustrates the movement that occurs at the pile head for all modeling conditions. From the movements depicted above, it can be observed that loading will result in movement in two axes, which is the x-axis and y -axis. With the presence of soil that restrains the displacement of the pile and pile cap, rotation will occur at the pile cap. This is the cause of the emergence of torsion in the pile or torque moments on the group foundation piles.
Figure 10 shows the pushover curve for both the condition without bracing and with elastic bracing. Pushover curve represents the shear reaction at the center of pile cap curve applied to the piles against displacement at the center of pile cap. This graph will show the overall response of the pile cap system to the lateral force applied. The non-linear shape of the curve indicates that the system has undergone a transition from elastic to plastic behavior. The peak point of the curve in Figure 10 represents the ultimate shear force of the system. Non-linear behavior shown in Figure 10 means failure happened on the foundation, where this failure can be caused by both shear and moment forces acting on the system. In this case the cause of failure is from moment forces that will be explained later in this paper.
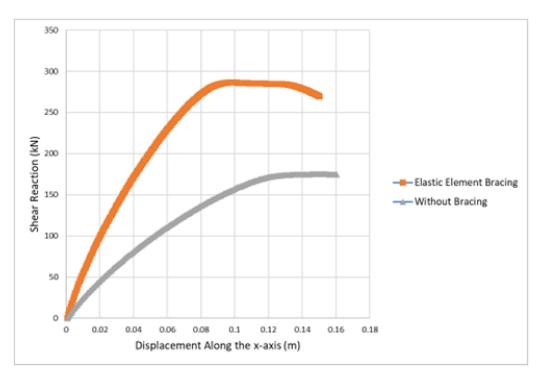
Figure 10. Pushover curve of system
Figure 10 also illustrates that foundation with elastic bracing can withstand greater lateral force than the condition without bracing. This is due to the presence of bracing in the system, which will lower the fixed head position of pile to the location bracing due to the high stiffness that the bracing gives. The bracing position provides stiffness that resists moments, which in condition without bracing should be at the connection point between the pile and the pile cap but is shifted to the bracing level. Therefore, when comparing the two conditions at the same force, a smaller moment occurs in the bracing condition, leading to a larger lateral force capacity. This information will also be shown later in this journal when analyzing the bending moment diagram.
As mentioned before, there are two main possibilities for system failure: shear force and bending moment on the system. To check for shear force, the shear capacity of the section will be compared with the shear force by analyzing the force-displacement curve for each pile in the element that experiences the largest moment. The location of that element will be discussed later in this paper when discussing bending moment diagram of piles. The result shows that the element that has the biggest moment is located at the pile head element in the condition without bracing and at the element 5 meters below the pile cap in the condition with elastic bracing. Shear force throughout loading process will be compared to the shear capacity of the section, that is 387.079 kN.
Figure 11 shows a comparison of the shear force magnitude with the pile shear capacity. It can be observed that the shear force distribution curve does not reach the maximum shear force capacity, indicating that the failure in the foundation is not due to shear forces. Therefore, the examination proceeds to check the moment capacity of the system, starting by identifying the yield point and ultimate point of the system.
In this study, the method to identify the yield and ultimate points is performed graphically according to Park et al. (1988). The procedure involves determining the point at the maximum lateral load (Pu) and drawing a horizontal line. Then, the value of 0.75 Pu is calculated, and a point is marked on the pushover curve. A line is drawn from the coordinate (0,0) passing through the 0.75 Pu point on the pushover curve and stops precisely at the Pu line. Next, from the
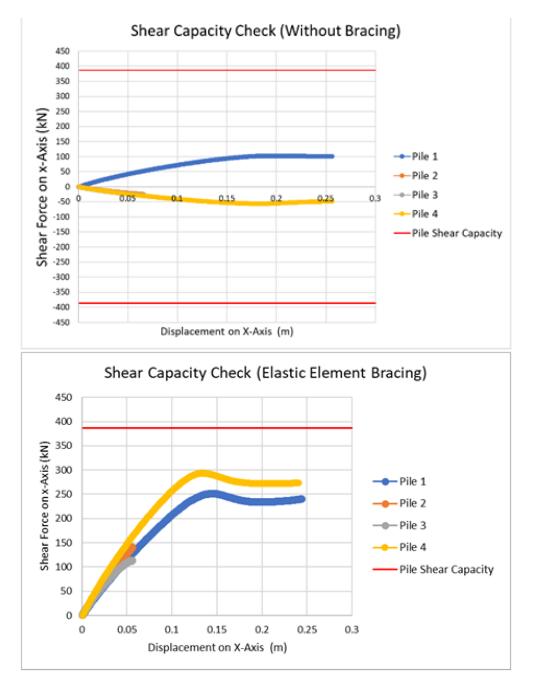
Figure 11. Comparison of shear force with shear capacity
intersection point between the Pu line and the line passing through 0.75 Pu, draw a line downwards until it intersects with the pushover curve. This intersection point represents the yield point of the model on the pushover curve. The displacement at the maximum lateral load point is the ultimate displacement, while the one at the yield point is the yield displacement. Figure 12 and Figure 13 illustrate the graphical method for determining ultimate and yield points in both conditions.
After both points have been determined, the values of yield load, ultimate load, yield strain, and ultimate strain can be identified.
Table 3 shows the yield and ultimate points of the system for both conditions. The results indicate an increase in ultimate lateral load by up to 60% when using elastic element bracing. Furthermore, if an
Table 3. Yield and ultimate point
| Yield | Ultimate | |||
|---|---|---|---|---|
| Type | Load (kN) | Disp (m) | Load (kN) | Disp (m) |
| Without Bracing | 158.58 | 0.101 | 174.97 | 0.149 |
| Elastic Element Bracing | 260.72 | 0.073 | 286.21 | 0.098 |
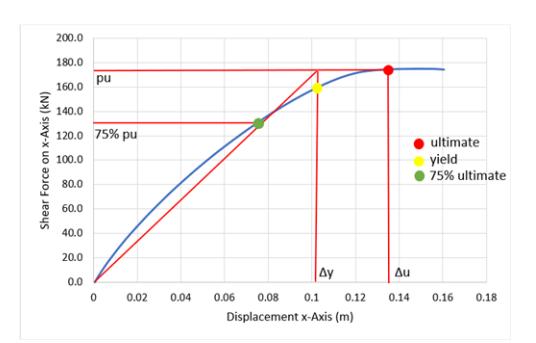
Figure 12. Yield and ultimate point for pile without bracing
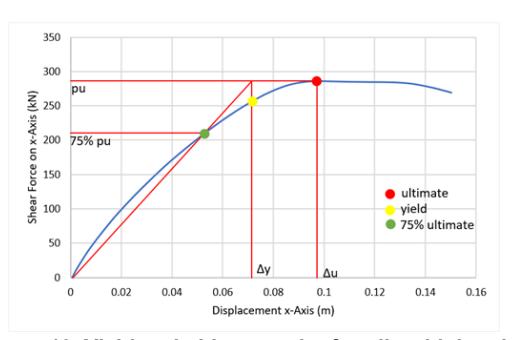
Figure 13. Yield and ultimate point for pile with bracing
analysis of the y-axis moment capacity occurring at piles 1 and 4 in both conditions is conducted and compared with the moment capacity of the pile section, the following results will be obtained. Table 4 shows the comparison of the yield and ultimate conditions at piles 1 and 4 regarding the moment capacity of the pile section.
The analysis reveals a phenomenon where, even though the system has surpassed the ultimate condition, the pile experiencing the largest moment has not reached the ultimate condition but only the yield condition. If compared with the concentric loading condition, the pile should have reached the ultimate condition. This indicates that eccentric loading influences the difference between the ultimate conditions of the system.
An analysis of the distribution of bending moments on each pile was also conducted for both. Due to the eccentric load, bending moments will occur in both the x-axis and y-axis. The analyzed distribution graphs represent the condition of maximum pushover loading to compare the moment distribution that occurs when reaching the maximum pushover force of the system. Figure 14 shows the graph of the distribution of
Table 4. Comparison of maximum moment in yield and plastic condition
| Condition | Maximum Moment (kNm) | Yield Moment | Plastic Moment | ||
|---|---|---|---|---|---|
| at Yield Condition | at Ultimate Condition | (kNm) | (kNm) | ||
| Without | Pile 1 | 484.247 | 601.179 | ||
| Bracing | Pile 4 | 501.948 | 486.125 | ||
| Elastic | Pile 1 | 529.179 | 591.075 | 290 | 617.624 |
| Element Bracing | Pile 4 | 570.561 | 577.257 | ||
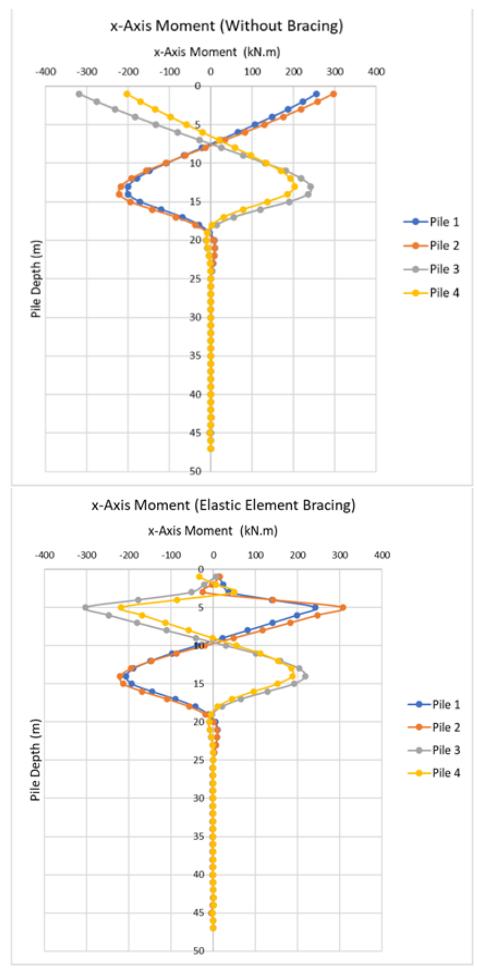
Figure 14. Distribution of moment in X-axis
moments in the x-axis along the piles when subjected to the maximum pushover force.
The moment in the x-axis for the condition without bracing shows that the largest moment occurs at the pile head. In the condition with elastic bracing, the maximum moment occurs 5 meters away from the pile head, which is the lowermost connection point of the bracing. This indicates that the presence of elastic bracing significantly distributes forces, resulting in a large moment at the connection point.
Figure 15 shows a graph illustrating the distribution of y -axis moments along the pile when subjected to the
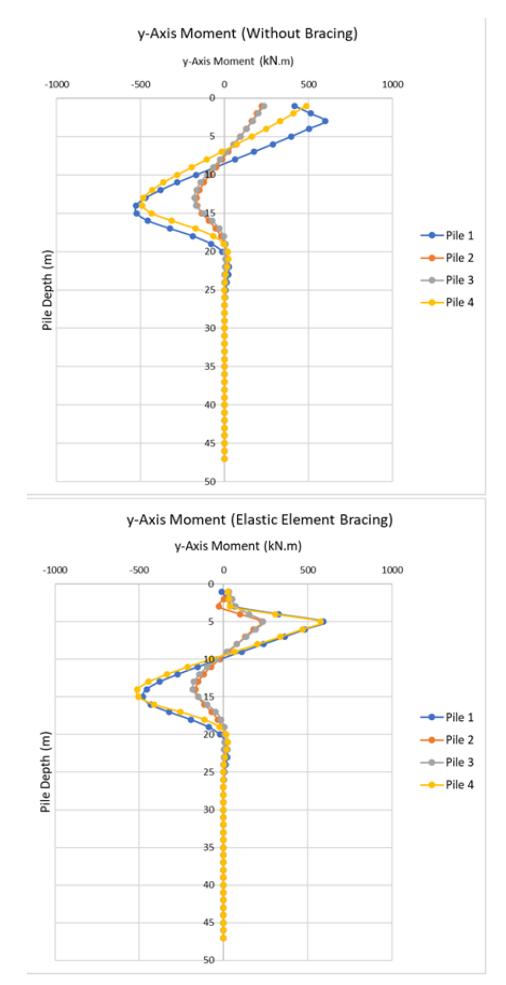
Figure 15. Distribution of moment in Y-axis
maximum pushover force. In the condition without elastic element bracing, the y-axis moment reveals that the largest moment on pile 1 occurs at the loading point, which is 3 meters from the pile head, and for the other piles, it occurs at the pile head. In the condition with elastic element bracing, the maximum moment occurs at 5 meters from the pile head, similar to the x-axis moment. Therefore, the presence of elastic element bracing helps reduce bending moments at the pile head, but attention must be paid to the connection between the bracing and the pile, as it will resist significant moments. Due to the eccentric load, torsion will occur in the pile cap, generating torque on the group foundation piles.
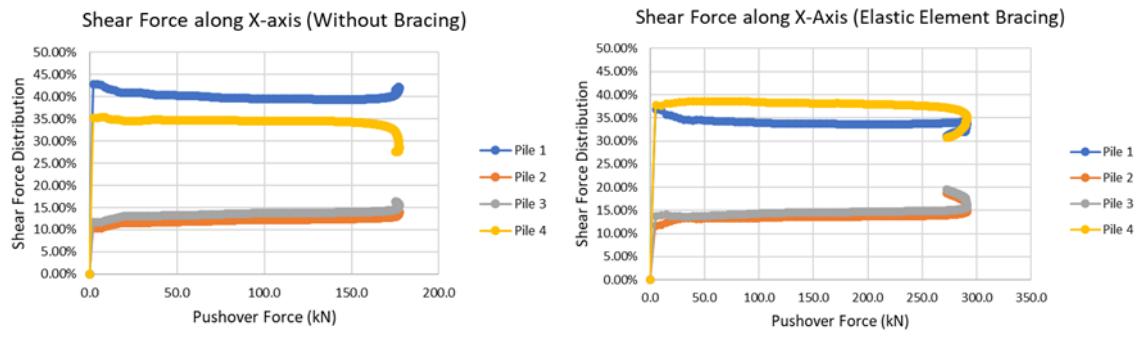
Figure 16. Distribution of shear forces in X-axis
Figure 17. Distribution of shear forces in Y-axis
The analysis process continues by examining the distribution of shear forces on each pile, as the eccentric position of the load with respect to the center of the group foundation induces shear forces in both the x-axis and y-axis. Figure 16 illustrates the distribution of shear forces in the x-axis throughout the loading stages.
From Figure 16, it can be observed that in the initial loading stage, pile 1 and pile 4 (row 1) receive a greater distribution of shear forces in the x-axis compared to pile 3 and pile 4 (row 2). Then, as it reaches the yield point indicated in Table 3, the distribution received by the pile in row 1 decreases, accompanied by an increase in the distribution for the pile in row 2. This indicates a reduction in the performance of the pile in row 1 as the loading increases, while the performance of the pile in row 2 does not decrease. The results without bracing show that row 1 receives the largest distribution. The presence of bracing will distribute the forces more evenly across each row, as shown in the Figure 16, where the difference between shear force percentage between pile 1 and pile 4 is smaller in condition using bracing.
Figure 17 shows the distribution of shear forces in the Y-axis, where it can be observed that the shear force distribution in the Y-axis yields similar results in both conditions. In the initial loading stage, there is a relatively even distribution of forces among all piles. As the loading increases and reaches the yield point, the pile in row 1 experiences a decrease in force distribution, accompanied by an increase in force on the pile in row 2, similar to the distribution of shear forces in the X-axis.
4. Conclusion
- 1. The presence of bracing will distribute forces along the row of piles in the direction of the load.
- 2. The bottom connection point of the bracing with the pile will experience maximum moments, so bracing on the pile has a significant effect in distributing forces.
- 3. Bracing will increase the stiffness of the pile system from the height of the pile cap to the height of the lowest bracing connection, resulting in a smaller moment arm.
- 4. Piles with bracing can withstand 60% larger lateral loads than those without bracing.
- 5. Displacement that occurs in piles with bracing is also smaller than the condition without bracing because of greater stiffness in the system with bracing.
- 6. Displacement pattern indicates that the presence of eccentric loads will induce twisting in the pile cap, which can generate torsions affecting the structural capacity against lateral loading.