
Abstrak
Analisis kinerja ruas jalan biasa dilakukan pada ruas jalan yang memiliki potensi terjadinya kemacetan tinggi, yang kemudian dilakukan perhitungan kinerja dan mendapatkan rekomendasi untuk masalah pada ruas jalan tersebut. Akan tetapi, saat ini masih sulit dalam melakukan perhitungan kinerja jalan karena harus dilakukan secara manual dalam perhitungan dan mencari faktor-faktor yang diperlukannya. Penelitian ini bertujuan untuk membuat aplikasi guna membantu dalam melakukan perhitungan kinerja ruas jalan berbasis android dengan lebih mudah dan fleksibel, aplikasi ini dinamai RAKJa (Rancang Analisis Kinerja Jalan) yang akan dipublikasi secara umum pada google play store untuk dapat digunakan oleh siapa saja yang membutuhkan. Aplikasi RAKJa ini akan dikembangkan berdasarkan Pedoman Kapasitas Jalan Indonesia (PKJI 2014). Aplikasi ini mendapatkan hasil berupa derajat kejenuhan, tingkat pelayanan, kecepatan rata-rata, tundaan, dan panjang antrian secara otomatis tanpa perlu mencari faktor yang dibutuhkan pada tabel PKJI 2014. Aplikasi RAKJa ini dibuat menggunakan bahasa pemrograman Game Maker Language dari pengembang Game Maker Studio 2. Perhitungan kinerja ruas jalan dengan menggunakan aplikasi RAKJa mendapatkan hasil yang sama dengan perhitungan yang dilakukan secara manual. Validasi keakuratan aplikasi dari data kinerja ruas jalan perkotaan penelitian terdahulu dengan menggunakan metode PKJI 2014 dan data primer didapatkan hasil akurat sebesar 90%.
Kata-kata Kunci: Aplikasi, RAKJa, kinerja ruas jalan, PKJI 2014.
1. Introduction
Population expansion is proportionate to an increase in the movement of products and people, therefore it has a substantial impact on vehicle growth (Bethary et al., 2016), which can lead to congestion on current roadways. Traffic jams arise as a result of an imbalance between the population and the number of vehicles, which grows year after year in proportion to the amount of roadways available at a certain place
(Wini Mustikarani and Suherdiyanto, 2016). Traffic management is a strategy for reducing congestion without adding or developing new infrastructure. Maulana and Nugraha (2019). Reducing side impediments allows for the selection of recommendations to overcome congestion. High side barriers produce congestion on the road in front of Mayong market during rush hour (Hidayat, 2020). Activities on the road or side obstacles have a large impact on the level of traffic performance (Sondakh & Elisabeth, 2015). Side barriers are the primary cause of traffic bottlenecks on Jalan Sam Ratulangi, with parked and stopped vehicles having the greatest impact. These side barriers can have an impact on road performance, including slowing down existing cars. cars entering and exiting roadside areas, particularly those moving on the roadside, limit the speed of passing cars (Doni et al., 2018). To improve efficiency, side impediments should be reduced. On congested highways, the level of side resistance has a significant impact on vehicle speed (Wahyudi A, 2022). This application can be used to help analyze road performance using the PTV Vissim program, this program can simulate traffic patterns that resemble real conditions (Mubarak & Maulana, 2021). Analysis calculations will be very easy to do if they are automatic because the application is considered easy to repair and will respond if an error occurs based on software coding. Another advantage is that the application can calculate appropriate speed and accuracy (Putra Prima Arhandi et al., 2020). The use of technology can help humans perform tasks more efficiently, such as calculations and analysis (Arifin & Veza, 2019). To obtain accurate findings, many simulations must be performed to ensure that each computation yields the correct value (Purwoko & Tama, 2022). This testing can be accomplished by validating the data or administering a questionnaire to application users. The counter application's correctness was determined through research (Rozy, 2020). The application can deliver good accuracy when the modeling results on PTV Vissim are near to actual road conditions (Nindita, 2020). In order to undertake road segment performance analysis, a road segment performance calculation application will be developed, which will automate the analysis calculation process in compliance with the Indonesian Road Capacity Guidelines (PKJI).
2. Literatur Review
2.1 Road section performance
Road performance is a quantitative measurement that describes specific circumstances on a road stretch. A study of road segment performance can reveal information about capacity, degree of saturation (DS), average speed, travel time, delays, and queuing. The level of road service represents a qualitative indicator that explains operational conditions in traffic flow as well as drivers' impressions of driving quality. In general, road performance refers to the ability of a road section to serve the traffic flow that passes across it (PKJI, 2014).
According to the Indonesian Road Capacity Guidelines (PKJI 2014) the geometric conditions of road sections must be built in such a way that they improve the performance of road section. The following considerations must be made when designing the geometric design of road sections :
- a. Road type: influences performance under specific traffic loads, such as divided roads, undivided roads, and one-way roads.
- b. Traffic lane width: As the traffic lane width increases, so does the free flow speed and capacity.
- c. Kereb: is the barrier between the traffic lane and the sidewalk that affects side resistance, capacity, and speed.
- d. Road shoulders influence capacity and speed increases.
- e. Median: A well planned median will boost capacity.
- f. Road alignment: Because free flow speeds in metropolitan areas are often low, this factor has little
2.2 Traffic flow and composition
The Indonesian Road Capacity Guidelines (PKJI 2014) indicate that traffic flow (Q) reflects traffic composition by expressing it in passenger car units (PCU). All traffic flow values (per direction or overall) are transformed into passenger car units (Pu) by applying experimentally obtained passenger car equivalents (Emp) to vehicle categories. There are the following vehicle types:
- a. Light Vehicles (KR): motorized vehicles with two axles and four wheels, with a length of no more than 5.5m and a width of no more than 2.1m, such as cars, minibuses (including angkot), microbuses (including microbuses, oplet, metromini), pick-up trucks, and compact trucks.
- b. Heavy Vehicles (KB): Motorized vehicles having two or more axles, six or more wheels, a length of 12.0 meters or more, and a width of up to 2.5 meters, such as large buses, huge trucks with two or three axles (tandem), connected trucks, and trailer trucks.
- c. Motorcycle (SM): A two-wheeled motor vehicle.
- d. Non-Motorized Vehicles (KTB): vehicles that do not utilize motors and are pulled by people or animals, such as bicycles, pedicabs, pushcarts, and horse carts.
2.3 Game marker studio 2
The Game Maker Language programming language from Game Maker Studio 2 is used to construct a computation application for analyzing road performance. After the application design phase is completed, the next step is to build an application for Android devices using the Android Studio application. This procedure is simple. Because the Android Studio program serves solely as a middleman, it runs
automatically. Game Maker Studio 2 is a game creation system created by Mark Overmars of YoYo Games with the Delphi programming language. Game Maker Studio 2 enables users to design and develop games and applications. There are various free versions of this application that can be used indefinitely, but they cannot be built or converted into an Android, computer, or other application. The fundamental requirements for this application are 2 GB RAM, 3 GB free storage space, a DX11 compliant graphics card, and Microsoft Windows 7 64 bit, as indicated in Figure 1. Display of Game Marker Studio 2.
Figure 1 Appearance user interface game maker studio 2
3. Methods
The method used is by conducting a direct survey on the road to obtain traffic data located on the Serang-Jakarta road along the Ciruas market, the data analysis method uses PKJI 2014 and by using an application program that will be created to help analyze the performance of the road section. The application is called RAKJa (Road Performance Analysis Design). To test the accuracy of the RAKJa application, a validity test was carried out using 14 data taken from previous urban road performance research and 1 primary data from direct
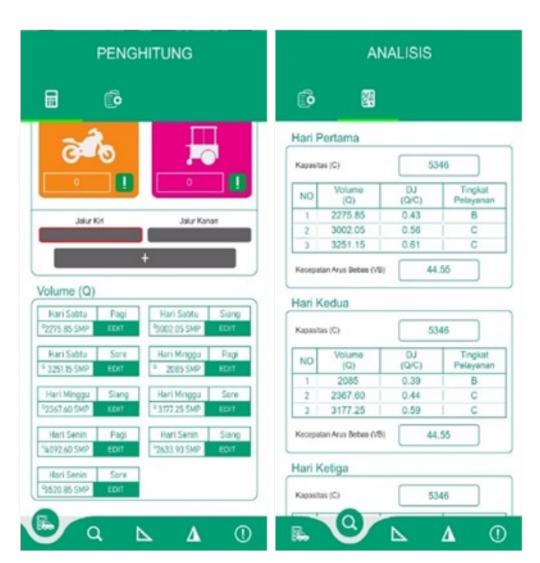
Figure 2. Android device application display
research on the Serang-Jakarta road section along the Ciruas market.
3.1 Aplikasi RAKJa
The RAKJa application will be built with the Game Maker Language programming language from an application developer called Game Maker Studio 2. Before publishing, the application will be developed in four stages: layout and interface design, programming, and run and run. Bug fixes, as well as accuracy confirmation. The Indonesian Road Capacity Guidelines (PKJI 2014) will be used to aid with calculations and all of the components required in this application. The accuracy of the RAKJa application will be evaluated using both primary and secondary data from previous researchers. Figure 2 is an example of how the RAKJa application.
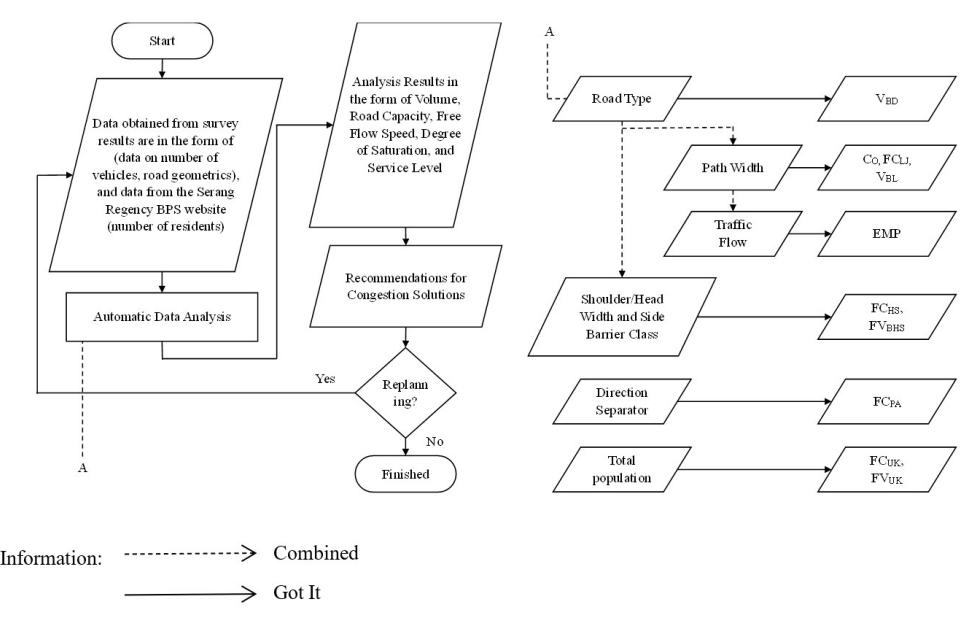
Figure 3. Application and automation program flowchart
3.2 Metode analisis data
The data analysis method was developed to help with the analysis process, as shown in the flow diagram in Figure 3.
Figure 3 shows that the calculation process for the RAKJa application will begin after entering the relevant data in the form of vehicle volume, road geometry, and population. After inputting all of the essential data, the application will automatically perform the analysis or calculation procedure, managing all of the necessary factors received from the PKJI 2014 table.
4. Results And Discussion
4.1 Application design
The RAKJa application was developed using the Game Maker Studiuo developer application and the Game Maker Language programming language. The application design procedure involved entering all of the application layout images saved in the sprites folder, constructing objects to arrange buttons and
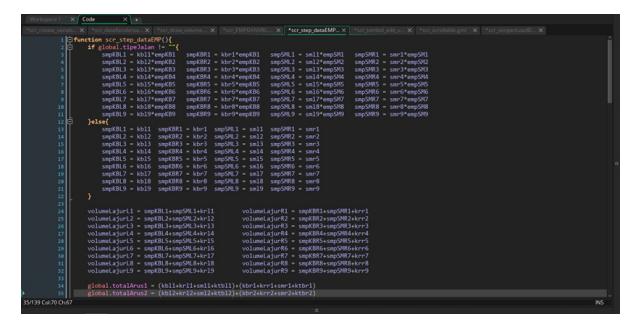
Figure 5. Program for obtaining FCUK and FVUK values
programming, adding scripts, and establishing a room to house all of the objects and scripts that would be displayed in the application. Figure 4 illustrates this.
Figure 4 shows a picture of the application display made with Corel Draw X7, which was then imported into the Game Maker Studio 2 application for programming. Programming is added to each event in an object or to a previously added script. For example, find factor values for the population (FCUK) and (FVUK). This strategy involves creating a presumption process using data that is already available in the form of demographic statistics. This data is entered into the software with a presupposition command, and the data is later decided automatically by the program using guidelines from the 2014 PKJI table, as shown in Figure 5.
The aforementioned program is entered into the event step of the control object for the application's data analysis page. This program states that if the population is fewer than 100,000, FCUK is equivalent to 0.86 and FVUK is equal to 0.90, as well as the program listed below as seen in Figure 6.
After all of the objects and scripts have been produced, the next step is to prepare the room by setting the
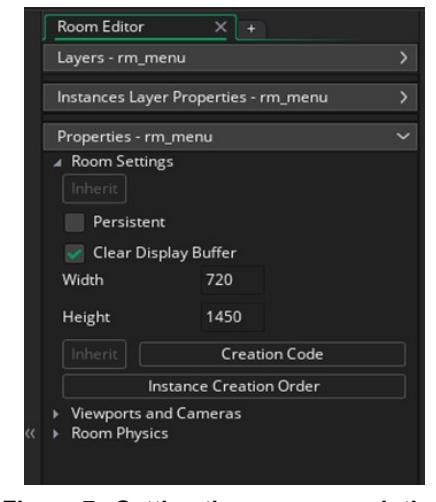
Figure 6. SMP data variable program Figure 7. Setting the screen resolution
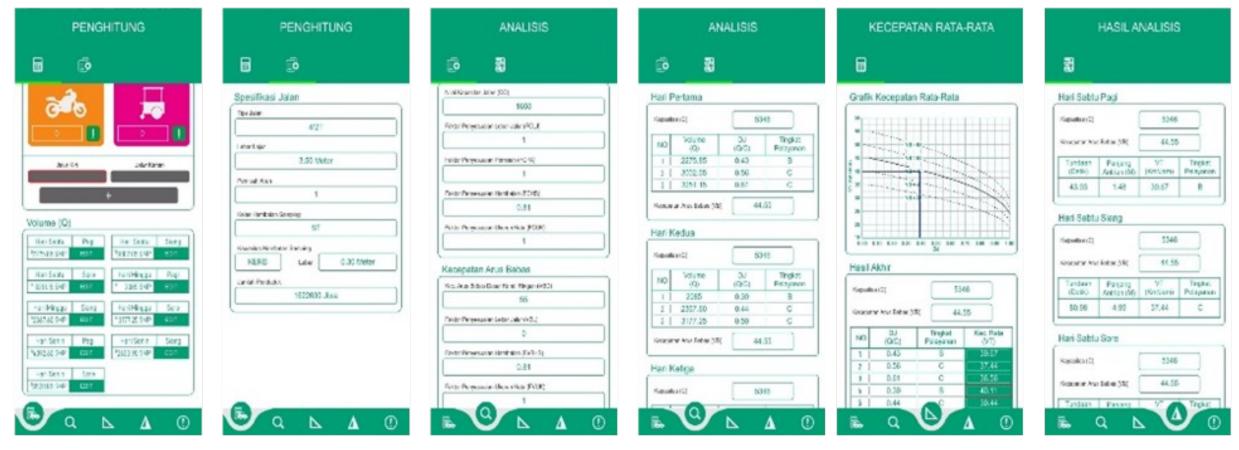
Figure 4. RAKJa application layout display
screen resolution size presented in the room settings, which is 720 px X 1450 px as seen in Figure 7.
After all stages have been completed, the application will be executed to perform the error search. If there are any problems, they will be fixed until the application is complete, after which the validation procedure will begin.
4.2 Secondary data validation
Validity testing is a method of determining the efficacy of a tool or data (Janna and Herianto 2021). The data validation process was carried out by comparing it using 14 data points from prior urban road performance research and 1 primary data. This is seen in Table 1 below.
From these 15 data points, manual computations using the RAKJa program yielded 90% accurate results.The data shown above is an example of 15 data points used to validate application accuracy. The table above shows that the values acquired from manual calculations yield the same results as those produced using the RAKJa application, as shown in Figure 8.
4.3 Primary data analysis
Data analysis was conducted using PKJI 2014 as a reference for the formula and other relevant components; the data and results of the analysis are presented below. It can be shown in Table 2.
According to the table above, the largest volume occurred on Monday morning with a degree of saturation of 0.39, resulting in a service level of D with an average speed of 33 km/hour, a wait of 170 seconds, and a line length of 38 meters. Following the validation phase, the primary data analysis is carried out utilizing the RAKJa program. This analysis is performed by entering all traffic volume data from the survey findings into the Rakja application, which will generate results in the form
| Information | value | Picture |
|---|---|---|
| Researcher Name | Rizki Ari Prabowo | HASIL ANALISIS KECEPATAN RATA-RATA |
| City name | South Jakarta | 88 |
| Road Type | 4/2 T | Hari Selasa Pagi Grafik Kecepatan Rata-Rata |
| Side Obstacles | Rendah | | | | | | | | | | | | | | | | | | | | |
| Side Barrier Width | Kerb (1 meter) | | Period | Period | Period | Period | Period | Period | Period | Period | Period | Period | Period | Period | Period | Period | Period | Period | Period | Period | Period | Period | Period | Period | Period | Period | Period | Period | Period | Period | Period | Period | Period | Period | Period | Period | Period | Period | Period | Period | Period | Period | Period | Period | Period | Period | Period | Period | Period | Period | Period | Period | Period | Period | Period | Period | Period | Period | Period | Period | Period | Period | Period | Period | Period | Period | Period | Period | Period | Period | Period | Period | Period | Period | Period | Period | Period | Period | Period | Period | Period | Period | Period | Period | Period | Period | Period | Period | Period | Period | Period | Period | Period | Period | Period | Period | Period | Period | Period | Period | Period | Period | Period | Period | Period | Period | Period | Period | Period | Period | Period | Period | Period | Period | Period | Period | Period | Period | Period | Period | Period | Period | Period | Period | Period | Period | Period | Period | Period | Period | Period | Period | Period | Period | Period | Period | Period | Period | Period | Period | Period | Period | Period | Period | Period | Period | Period | Period | Period | Period | Period | Period | Period | Period | Period | Period | Period | Period | Period | Period | Period | Period | Period | Period | Period | Period | Period | Period | Period | Period | Period | Period | Period | Period | Period | Period | Period | Period | Period | Period | Period | Period | Period | Period | Period | Period | Period | Period | Period | Period | Period | Period | Period | Period | Period | Period | Period | Period | Period | Period | Period | Period | Period | Period | Period | Period | Period | Period | Period | Period | Period | Period | Period | Period | Period | Period | Period | Period | Period | Period | Period | Period | Period | Period | Period | Period | Period | Period | Period | P |
| Total population | 2,3 Juta | | | | | | | | | | | | | | | | | | | | |
| С | 6336 | DJ Trobal Kec Rate |
| VB | 54 | | 1 0.56 C | 45 |
| DJ | 0,56 | 2 9 A 0 3 9 A 0 A 0 A 0 A 0 A 0 A 0 A 0 A 0 A 0 A |
| Service Level | C | Tundash Pariero VT Trigles 5 0 A 0 |
| VT | 45 |
Figure 8 Example of data accuracy validation table
Table 2. Validation of primary data accuracy
| NO | Roads | Analysis | RAJa Results | |||||||
|---|---|---|---|---|---|---|---|---|---|---|
| DJ | LOS | VT | DJ | LOS | VT | |||||
| 1 | Serang (Ciruas Market) | 0,77 | D | 40 | | NO | Volume (Q) | 1 | 2005 | 2 | 2307 60 | 3 | 3177 25 | Kacoptan Arus Betes (VB) | Hari Ketiga | Kopentas (C) | NO | Volume (Q) | 1 | 4002 60 | 2 | 2633 50 | 3 | 3500 85 | | | Tright | CC | Petryrotin | CC | Petryrotin | CC | Petryrotin | CC | Petryrotin | CC | Petryrotin | CC | Petryrotin | CC | CC | CC | CC | CC | CC | CC | | | 1 | |||
of factor values, degree of saturation, level of service, average speed, queue length, and delays automatically. This is seen in Figure 9.
It can be seen in the image above that after entering all vehicle volume data and road geometric data, you will automatically get factor values from the 2014 PKJI table, as shown in Figure 10.
The results obtained from analysis using the RAKJa application are in accordance with those obtained from manual analysis results.
Table 1. Validation of secondary data accuracy
| No | Analysis | RaKJA Result | ||||||
|---|---|---|---|---|---|---|---|---|
| Roads | DJ | LOS | VT | DJ / TUNDAAN | LOS | VT | ||
| 1 | South Jakarta | 0,56 | C | 45 | 80,81 | C | 45 | |
| 2 | South Tangerang | 0,73 | C | 53 | 175,11 | C | 53,44 | |
| 3 | Palembang | 0,78 | D | 35 | 0,79 | D | 35 | |
| 4 | R.Sukamto Palembang | 0,78 | D | 35 | 0,79 | D | 35 | |
| 5 | Godean Yogyakarta | 0,60 | C | 37 | 0,60 | C | 37,22 | |
| 6 | Rajawali Section | 0,19 | A | 45 | 0,19 | A | 45,83 | |
| 7 | Untirta Front Pakupatan | 0,39 | B | 49 | 34,76 | B | 49 | |
| 8 | Master Tailor | 0,54 | C | 37 | 39,00 | C | 36,67 | |
| 9 | M-Icon | 0,58 | C | 38 | 49,19 | C | 37,78 | |
| 10 | Sam Ratulangi | 0,69 | C | 35 | 71,50 | C | 35 | |
| 11 | Parameswara | 0,84 | D | 33 | 100,21 | D | 33,06 | |
| 12 | Menganti | 0,38 | B | 46 | 33,87 | B | 46,11 | |
| 13 | RE Martadinata | 0,55 | C | 53 | 68,31 | C | 52,56 | |
| 14 | Tangkuban Perahu | 0,98 | E | 27 | 157,22 | E | 26,94 | |
Figure 9. Traffic volume, geometrics, and factor values Figure 10. Analysis results using the RAKJa application
Table 3 Comparison of degree of saturation and level of service
| Before HS Reduction | After HS Reduction | ||||||||
|---|---|---|---|---|---|---|---|---|---|
| Date | Time | Volume skr/Hour | Road Capacity | Degree of Saturation | Service Level | Volume skr/Hour | Road Capacity | Degree of Saturation | Service Level |
| ay 27 | Morning | 2276 | 5346 | 0,43 | В | 2276 | 6006 | 0,38 | В |
| Saturday, May 27 2023 | Day | 3002 | 5346 | 0,56 | C | 3002 | 6006 | 0,50 | C |
| Satur | Affernoon | 3251 | 5346 | 0,61 | C | 3251 | 6006 | 0,54 | С |
| зу 28, | Morning | 2085 | 5346 | 0,39 | В | 2085 | 6006 | 0,35 | В |
| Sunday, May 28, 2024 | Day | 2368 | 5346 | 0,44 | C | 2368 | 6006 | 0,39 | В |
| Sund | Affernoon | 3177 | 5346 | 0,59 | C | 3177 | 6006 | 0,53 | C |
| , May | Morning | 4093 | 5346 | 0,77 | D | 4093 | 6006 | 0,68 | С |
| Monday 29, 2025 | Day | 2634 | 5346 | 0,49 | С | 2634 | 6006 | 0,44 | В |
| Affernoon | 3521 | 5346 | 0,66 | С | 3521 | 6006 | 0,59 | С | |
4.4 Recommendations for reducing side obstacles
The high side barriers on the road section studied result in traffic jams, especially on Monday mornings, therefore it is necessary to reduce side barriers on this road section. This is seen in Table 3.
5. Conclusion
- 1. The RAKJa application produced accurate results when compared to results acquired by human computations. This application trial included 14 urban road performance data from earlier researchers, as well as one primary data set that yielded accurate results.
- 2. The RAKJa program is highly accurate and simple to use as a tool for assessing road performance because it is mobile and can be used anywhere with an Android device. This application is also visually appealing and simple to use, with a user-friendly interface that allows even new users to immediately
comprehend how it works. This tool can be used to determine the performance of road segments at any intersection. However, this program cannot execute calculations for more than three research days and the three busiest volume times, limiting road performance analysis calculations to three research days and three peak hours on the road.
Acknowledgement
This article is based on the results of research on modeling and mobile apps for urban road sections in Banten Province which was funded by the Institute for Research and Community Service at Sultan Ageng Tirtayasa University through the Research and Community Service Grant Program in 2024..