
Abstrak
Kecelakaan lalu lintas transportasi darat di Indonesia terdampak oleh pandemi covid 19. Pada masa pandemi covid telah diterapkan beberapa kebijakkan transportasi. Suatu keharusan yang mutlak untuk penerapan keselamatan transportasi. Pada masa pandemi covid tahun 2019 dan tahun 2020 memiliki besaran rata – rata untuk jumlah kecelakaan lalu lintas sebesar 25%, jumlah korban meninggal dunia sebesar 24%, jumlah korban luka – luka sebesar 21% dan angka kecelakaan sebesar 25 %. Pada tahun 2021, masyarakat Indonesia mulai menghadapi kondisi new normal, dimana seluruh aktivitas berjalan normal seiring dengan adanya virus Covid 19. Sehingga pada tahun 2021 dan 2022 terjadi peningkatan lagi pada jumlah kecelakaan lalu lintas, korban meninggal dunia, korban luka dan angka kecelakaan. Adapun besaran rata pada tahun 2021 dan 2022 tersebut untuk jumlah kecelakaan lalu lintas adalah sebesar 26%, jumlah korban meninggal dunia sebesar 26%, jumlah korban luka – luka sebesar 23% dan angka kecelakaan 28%. Dengan hadirnya Peraturan Nomor 21 Tahun 2020 tentang PSBB dapat menurunkan angka kecelakaan di Indonesia, namun besarnya penurunan Tingkat kecelakaan tidak terjadi secara signifikan. Pada tahun 2019 nilai accident rate sebanyak 31% dan pada tahun kebijakkan PSBB diterapkan nilai accident rate yang terjadi adalah 23%, penurunan Tingkat kecelakaan yang terjadi hanya sebanyak 8%.
Kata-kata Kunci : Angka kecelakaan, pandemi covid 19, analisis deskriptif, kecelakaan lalu lintas jalan
* Penulis Korespondensi: roselina.rahmawati@polines.ac.id
1. Introduction
Covid -19 was first discovered in patients in Wuhan in December 2019 as a new Corona virus (Na Zhu, 2020). Further more, the World Health Organization (WHO) announced that March 2020 was a pandemic and urged the community, countries and authorities to reduce the number of new cases and deaths caused by the corona virus (Arellana & , Luis Márquez, 2020) and (World Health Organization, n.d.). This Covid pandemic has had an impact for more than a year on all living conditions. Some governments have implemented a lockdown system to limit the spread of the virus and the increase in fatalities. Lockdown is implemented because public places such as stations, public transport and cars have a high risk of transmission of the Covid virus (Charles Musselwhite, 2020). Restrictions on personal mobility are also implemented as one of the restrictions on the spread of the Covid virus, this is because road traffic and air travel are the main aspect of movement that can spread the Covid virus (Joseph T Wu, 2020). The number of traffic on roads and movement behavior on roads has decreased because all community is in a lockdown condition (Sean Clarke, 2020). Traffic that occurs in urban areas has decreased throughout the world but not evenly in the moda system, the one with the biggest impact on the decline is public transportation (Joseph Molloy, 2021). The most tangible results of the strategy implemented to prevent the spread of the covid virus is reduction the number of traffic collisions on urban and inter-city highways on urban and intercity highways, so there was a significant reduction in the number of traffic accident and deaths (Òscar Saladié, 2020). Deaths resulting from traffic accidents have been considered a global pandemic since before the Covid pandemic occurred. Around 1.35 million people die every year throughout the world and 20 – 50 million suffer injuries with a death rate of 27.5 per 100,000 people (Dicky Masrul, 2021). One of the bad impacts of mobility is accidents that occur on roads which result in property damage and economic losses (IRU, 2021). The decline in traffic accidents after the Covid pandemic can be reduced by controlling mobility (Erik Jenelius, 2020). In 2021, restrictions on the mobility of Indonesian people has been laxness. Workers have resumed their activities, educational institutions such as schools and universities have also given permission for students to take part in direct learning at school. This has the impact of increasing the number of traffic on the highway following the movement patterns that occur. With the traffic volume enhancement, so the possibility of traffic accident is back to increase. Increasing population is directly proportional to the increase in vehicle volume (Dicky Masrul, 2021).
Previous research with the title "Analysis of Road Safety Based on Road Type on National Roads in Bali Province" shows the results of data accident rate or the highest accident rate is 160 incidents per 1 million vehicles per year on the Kosamba – Angentelu Bali road section. For data analysis of fatality rate or death rate, the highest is 245 per 1 million vehicles per year on Jalan A.Yani (Amlapura) Bali. And the type of road that has the highest accident rate and fatality rate number is the 2/2 UD road type (Fairuz Sasqia Maulidya, 2024). Next research with the title "Analysis of traffic accident rates during the Covid-19 pandemic in Gorontalo City", the results of the analysis of the traffic accident rate show that the number of accidents in 2018 was 108 events with a percentage of 27%, in 2019 there were 158 events with a percentage of 39%, in 2020 there were 87 events with a percentage of 21% and in 2021 there were 55 events with a percentage of 13%. The most traffic accidents occurred in 2019 with the number of victims who died were 19 victims with a percentage of 11%, victims who suffered serious injuries as many as 1 with a percentage of the situation was 5% and victims who suffered minor injuries were 157 victims with a percentage of 88%. Whereas in 2020 the number of traffic accidents decreased with a total of 121 victims with the percentage of FK victims being 13%, SI victims being 3% and MI victims being 84% (Edwin Isa Mahendra, 2021). Research conducted in Poland and Slovakia under title "Impact of the COVID-19 pandemic on road traffic accident forecasting in Poland and Slovakia" shows that the pandemic led to a decrease in the number of traffic accidents in Poland by 31% and in Slovakia by 33% (Martin Jurkovic, Piotr Gorzelanczyk, Tomas Kalina, 2022). Research conducted in Bangladesh under title "Impact of COVID‑19 on Public Transportation and Road Safety in Bangladesh" Stating that the government has stopped all public transport operations during the 67-day lockout imposed to combat the risk of coronavirus. Furthermore, public transport vehicles may only run at 50% of their full capacity. These strategies will be detrimental to the finances of the transport sector, increasing the economic crisis faced by trans public port operators and airlines in Bangladesh. Since private cars are widely driven due to the potential inability to use public transportation, the number of traffic accidents has increased steadily compared to the same time period in 2017 previous years (Md. Ebrahim Shaik, Quazi Sazzad Hossain, 2021). This research aims to analyze the level of transportation accidents in Indonesia during the Covid-19 pandemic using the accident rate method. This research not only analyzes accident rates in certain regions or provinces but in the country of Indonesia. Apart from that, research was carried out to calculate the level of accidents that occurred regarding a pandemic phenomenon that occurred, namely the Covid 19 pandemic. This is interesting to analyze as preliminary research, which shows the effect of the Covid 19 pandemic that occurred in Indonesia in general on the level of accidents that occurred, whether the PSBB policy implemented by the Indonesian Government has been able to reduce the accident rate significantly. The results obtained from this analysis can be used as recommendations for stakeholders in Indonesia to significantly reduce the level of traffic accidents during the pandemic. If another pandemic phenomenon occurs again, it is hoped that there will be no traffic accidents (zero accidents).
2. Research Methods
The Covid 19 pandemic situation limited data collection in this research, so this research was carried out through retrospective library research, secondary data from road traffic accident reports collected by National Transportation Safety Committee (KNKT), during the period 2019 - 2022 and the results were analyzed using descriptive methods. The way to get data is by Administrative process, Researchers from POLINES will send a letter regarding the request for traffic accident reports to KNKT Office in Jakarta. The aim of this descriptive research is to create systematic, factual and accurate descriptions, images or paintings regarding the facts, characteristics and relationships between the phenomena being investigated.
This study defines road traffic accident data as accidents that meet the investigation limits as stated in the Regulation of the Chairman of the National Transportation Safety Committee regarding Standard Operational Procedures for the Investigation of Traffic and Road Transportation Accidents.
Furthermore, to calculate and determine trends in total road traffic accident rates, an analysis was conducted by comparing the number of investigated accidents with the length of the road (km) in the area under review, according to (Cremona ayu novita sari, 2021) approach.
\[RL = \frac{AC}{L} \tag{1}\]
Description:
RL = Average accident rate per Km for one year
AC = Total number of accidents for one year
L = Road length in Km
2.1 Problem identification
According to (Sudaryono, 2021), the background of the problem explains that the problem being studied is important from various aspects, namely the research profession, scientific development and development benefit.
This research is critical to research and discuss considering that the pandemic phenomenon that has occurred has changed many aspects of the economic order and life, including aspects of transportation safety. Almost all countries have issued new policies in the transportation sector, so a more in-depth analysis of this is needed.
This research aims to determine the level of accidents using accident rate method that occurred during the Covid-19 pandemic as a basis for determining recommendations for transportation safety solution during the pandemic.
2.2 Library research
In the library research, (PenelitianIlmiah.Com, 2023) suggests using the following methods:
a. Keyword search
- b. Subject search
- c. Search for the latest scientific books and articles
- d. Search for citations in scientific sources
- e. Search through published bibliographies (including sets of footnotes in relevant subject documents)
- f. Systematic browsing, especially of full-text sources organized into predictable subject groupings
2.3 Administrative process to the national transportation safety committee (KNKT)
According to (thpanorama, 2023) a series of processes that flow continuously and dynamically is the definition of an administrative process. Determining forms of efficiency, consistency, responsibility and accountability must occur in the administrative process. In this research, the administrative process was carried out for the purposes of collecting secondary data held by the KNKT office. Researchers from POLINES will send a letter regarding the request for data needed for this research. This administrative process is carried out with efficiency, consistency, responsibility and accountability.
2.4 Data analysis
According to (Basri bodo, 2021) Data Analysis explains the steps in the secondary data analysis process, including,
- a. determine the data sources used such as medical records, data from BPS, etc In this research, the secondary data used is data sourced from the National Transportation Safety Committee (KNKT) regarding traffic accident reports for 2015 – 2022 and data from BPS.
- b. collecting this data into a document or certain format. The data submitted by KNKT is in the form of hardcopy or soft files containing figures on the number of traffic accidents, number of traffic accident victims and data on the length of Indonesian roads from BPS.
- c. normalize data to equalize data into the same form so that data from different sources can be compatible with each other. Data normalization in research is the linkage of traffic accident data that occurs so that the data will be compatible with each other.
- d. carry out data analysis by carrying out calculations, tabulating data sources, mapping data and comparing data and reviewing it. The data calculated is the number of accidents and traffic accident victims with statistical calculations and then calculations are carried out using Accident Rate analysis (total accidents).
2.5 Conclusion process
The resulting conclusion is the accident rate that occurred in the year under review
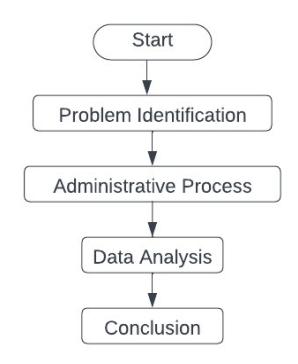
Figure 1. Research flow concept
Table 1. Data on total number of accidents
| Years | Number of Traffic Accidents1 | |
|---|---|---|
| 2019 | 20 | 31 % |
| 2020 | 12 | 18 % |
| 2021 | 18 | 28 % |
| 2022 | 15 | 23 % |
| Total | 65 | 100% |
Source : Secondary data from the National Transport Safety Committee of Indonesia (KNKT). May 20231 Analysis Data2
3. Result and Discussion
3.1. Result of accident investigation
Accidents that occurred in Indonesia from 2019 to 2022 increased in 2019 and decreased in 2020. The increase in accidents could be caused by the increase in the number of vehicle owners (Chalid, 2018). In 2019 – 2022 as many as 65 cases of traffic accidents occurred. The following are details of the total accidents that occur each year.
Based on Table 1, it can be seen that the results of the investigation into the number of land transportation accidents in 2019, the number of accidents was 20. In 2020, the number of accidents was 12. In 2021, the number of accidents was 18. In 2022, the number of accidents was 15. The following data is depicted in graphical form.
3.2. Result of total death victims and injuried victims
The results of the investigation into the number of land transportation accidents in 2019, the number of fatalities was 116 people and the number of injured
Table 2. Death victims and injured victims
| Years | Number and percent of Death Victims | Number and percent of Injured Victims | ||
|---|---|---|---|---|
| 2019 | 116 (34%) | 179 (25%) | ||
| 2020 | 47 (14%) | 124 (17%) | ||
| 2021 | 76 (22%) | 163 (23%) | ||
| 2022 | 104 (30%) | 256 (35%) | ||
| Total | 343 | 722 | ||
Source : Secondary data from the National Transport Safety Committee of Indonesia (KNKT). May 2023
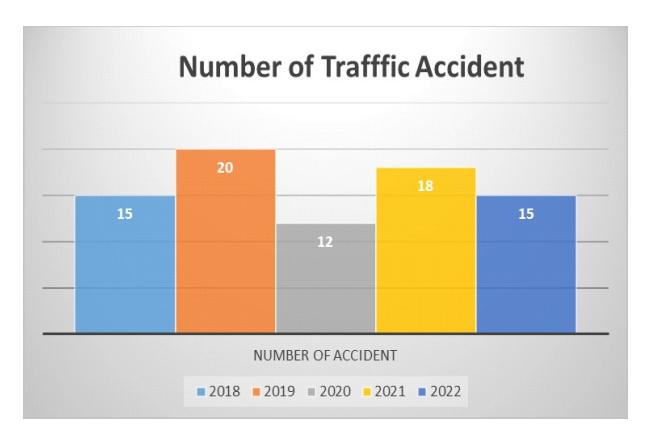
Figure 2. Graph of number of traffic accident
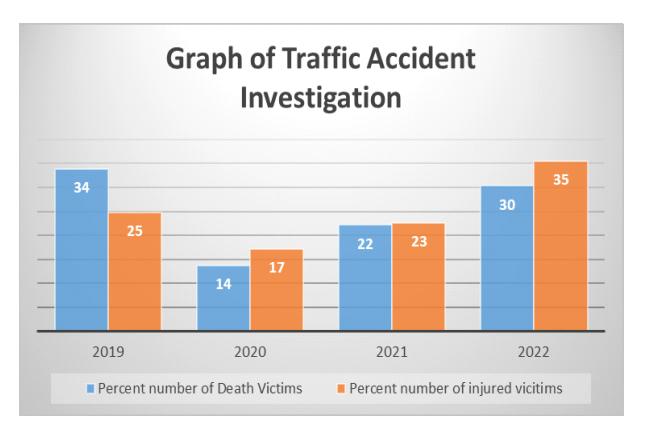
Figure 3. Graph of Land transportation accident investigation
traffic victims was 179 people. In 2020, the number of fatalities was 47 people and the number of injured traffic victims was 124 people. In 2021, the number of fatalities was 76 people and the number of injured traffic traffic victims was 163 people. In 2022, the number of fatalities was 104 people and the number of injured traffic victims was 256 people.
From the results of above data, it can be analyzed that the average number of land transportation accidents in 2019 was the highest, namely 31%. In 2020 there has been a decrease in the number of accidents. In 2020 the Indonesian government implemented Large-Scale Social Restrictions (PSBB) regulations. This PSBB policy is based on Regulation Number 21 of 2020 concerning PSBB in the context of Accelerating Handlin In Paragraph 1 of- Chapter 2 of PP Number 21 of 2020, it is stated that PSBB has the authority to restrict the movement of people and goods entering or leaving a province, district or certain cities (Kompas.com, 2020). The PSBB regulations are implemented to control the movement of people and decrease the number of COVID-19 cases, as seen in the city of Gorontalo (Edwin Isa Mahendra, 2021). As of 2021, the Government has encouraged all members of society to adopt a "new normal" lifestyle by changing their behavior and adapting to the COVID-19 pandemic (Indonesiabaik.id, 2021). However, despite these efforts, the number of COVID-19 cases has continued to rise.
Table 3. Lenght of roads in Indonesia
| No | Years | Length of Roads (KM) | |
|---|---|---|---|
| 1 | 2019 | 548.310 | |
| 2 | 2020 | 554.410 | |
| 3 | 2021 | 556.674 | |
| 4 | 2022 | 562.774 | |
Source : BPS Website
Table 4. Land transportation accident rates 2015 - 2020
| Years | Number of accidents1 | Length of road (KM)2 | Accident Rate3 | Percent of Accident Rate |
|---|---|---|---|---|
| 2019 | 20 | 548.310 | 0,0000365 | 31 % |
| 2020 | 12 | 554.410 | 0,0000218 | 19 % |
| 2021 | 18 | 556.674 | 0,0000323 | 28 % |
| 2022 | 15 | 562.774 | 0.0000267 | 23 % |
| Total | 65 | 2.214.496 | 0,0001175 | 100 % |
Description
3.3. Accident Rates
From the road traffic accident data investigated by the KNKT above and the existing formula, we will analyze accidents based on the accident rate. By measuring the accident rate, the general level of road traffic safety will be known. The higher the accident rate, the lower the level of safety.
The land transportation accident rate can be expressed in a certain quantity which is also called normalization. For the normalization process, road traffic accidents can be calculated using the length of the road expressed in km. The calculated road length includes the length of paved and unpaved roads. The total road length for all archipelagic regions in Indonesia is obtained from BPS as a state institution that provides national data.
From the Table 3 it can be seen that the length of roads (km) increases every year, because every year regions in Indonesia experience development. The development of a region requires the development of road transportation infrastructure to support population movement and economic movement. By knowing the growth in road length each year, land transportation accident rates can be determined. The Land Transportation Accident Rate is data on accidents that occurred in a particular year divided by the length of the road (km) in the accident review area in question. The formula used to calculate the accident rate is as follows.
\[RL = \frac{AC}{L} \tag{2}\]
Description:
RL = Average accident rate per Km for one year
AC = Total number of accidents for one year
= Road length in Km
For more complete information on road transport accident rates in 2015-2021, see the following Table 4.
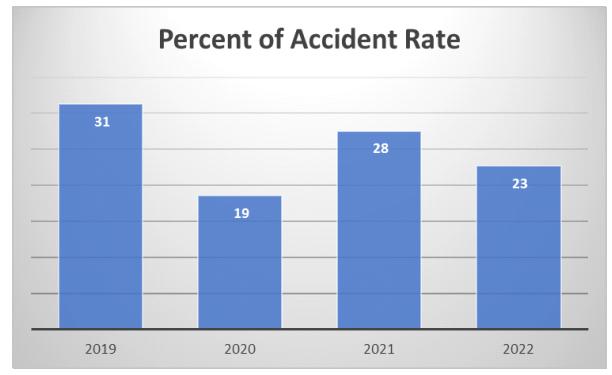
Figure 4. Decrease in the average accident rate in 2015 - 2018 and in 2019 - 2022
From the results of above data, it can be analyzed that the highest average number of accidents rate in 2019 was 31%. In 2020 it was 19%. In 2021 it will be 28% and in 2022 it will be 23%. A graphic depiction can be seen in Figure 4.
From the two tables and graphs above, it can be seen that the highest accident rate occurred in 2019 and decreased in 2020 when the government implemented the PSBB policy. The accient rate value has increased. Back in the new normal period where people carried out normal activities side by side with the Covid 19 virus.
4. Conclusion
The definition of a traffic accident is an event that is unpredictable, unplanned and expected to occur on the road or due to human error on the road which results in victims with injuries, illness and loss to people, goods and the environment (Cahaya Eka Putri, 2014). From the results of the analysis that has been obtained it can be concluded as follows:
- 1. In 2019 it was the highest position for number of traffic accidents (31%), number of death traffic victims (34%), number of injured traffic victims (25%), and accident rate (31%). 2020 is a year with the lowest position for the number of traffic accidents (18%), number of death traffic victims (14%), number of injured traffic victims (17%), and accident rate (19%).
- 2. In 2020, the PSBB policy began to be implemented to restrict community movement. In 2021, Indonesian society is starting to face new normal conditions, where all activities are running normally side by side with the Covid 19 virus. So in 2021 and 2022, there will be another increase in the number of traffic accidents, death traffic victims, injured traffic victims and accident rate. In 2021, the number of traffic accidents (28%), the number of death traffic victims (22%), the number of injured traffic victims (23%), and the accident rate (28%).
- 3. In 2022, the number of traffic accidents (23%), the number of death traffic victims (30%), the number of injured traffic victims (23%), and accident rate (28%).
<sup>1</sup>KNKT (Database 2023) <sup>2</sup>BPS (2022) <sup>3</sup>Analysis Data of Accident Rate (jumlah kecelakaan/ KM Jalan)
4. With the presence of Regulation Number 21 of 2020 concerning PSBB, the number of accidents in Indonesia can be reduced, but the reduction in the accident rate has not occurred significantly. In 2019 the accident rate was 31% and in 2020 when the PSBB policy was implemented the accident rate was 23%, the reduction in the accident rate was only 8%. This occurs due to a lack of control in implementing the PSBB, there are still many offices that do not implement this policy so that people are still required to carry out work activities as usual. The implemented PSBB policy causes road conditions to become deserted, with this condition people carrying out work activities (uncontrolled conditions) move vehicles at speed without paying attention to driving safety. Control activities in offices and worker activities during the pandemic need to be carefully considered, checking offices that have not fully implemented WFH. Strict action has been taken for those who have not been able to fully implement the PSBB policy.