
Abstrak
Pembangunan struktur bawah tanah di Pembangkit Listrik Tenaga Gas dan Uap Muara Tawar, yang terletak di daerah pesisir dengan tanah lempung yang sangat lunak, menghadirkan tantangan geoteknik yang signifikan. Studi ini menyelidiki efektivitas dinding penahan sementara berupa sheetpile dan strutting selama penggalian ruang bawah tanah Steam Turbine Generator (STG) 4, yang berdekatan dengan struktur eksisting. Dengan menggunakan PLAXIS 2D, perangkat lunak Metode Elemen Hingga (FEM) yang canggih, kami memodelkan dan menganalisis interaksi tanah-struktur untuk mengoptimalkan pendekatan desain dan konstruksi dengan membandingkan beberapa model konstitutif tanah, termasuk Mohr-Coulomb, Soft Soil, dan Hardening Soil. Analisis numerik, yang divalidasi dengan data pemantauan lapangan, menunjukkan bahwa sistem sheetpile dan strutting yang diusulkan secara efektif mencegah keruntuhan tanah selama konstruksi, menghasilkan faktor keamanan yang memadai dan nilai defleksi yang dapat diterima. Dengan membandingkan hasil numerik dengan data pemantauan aktual, kami menentukan model mana yang secara akurat memprediksi perilaku tanah untuk skenario konstruksi spesifik ini. Hasil penelitian menunjukkan bahwa model konstitutif tanah yang kompleks, seperti Soft Soil dan Hardening Soil, memberikan prediksi yang lebih unggul dibandingkan model Mohr-Coulomb.
Kata Kunci: Komparasi model tanah, metode elemen hingga, tanah lunak, galian dalam, sheetpile
* Penulis Korespondensi: esusila@itb.ac.id
1. Introduction
The Muara Tawar Combined Cycle Power Plant (CCPP) 650 MW, is part of the National Strategic Project built in the Bekasi Coastal Area, West Java for bolstering national energy security and supporting Indonesia's economic growth. However, constructing CCPP in coastal areas often presents significant geotechnical challenges. The Muara Tawar CCPP site, for instance, sits on a geological formation dominated by very soft clay. This type of soil, characterized by low shear strength, high compressibility, and high water content(Hausmann, 1990; Bjerrum, 1967), is highly susceptible to deformation and can potentially lead to stability issues in construction (Holtz et al., 2011). This necessitates specialized handling and poses a considerable challenge for geotechnical engineers in designing foundations and substructures (Leroueil et al., 1985; Mitchell & Soga, 2005). The presence of very soft clay at the Muara Tawar site necessitates careful consideration and innovative solutions to ensure the stability and safety of the power plant's bottom structures, particularly for the Main Building, during the construction stage, especially given the need for deep excavation.
One common method to address the challenges of soft soil is using sheetpiles as retaining walls. Sheetpiles function as temporary retaining structures during the construction period, especially in excavation works. To enhance their strength and stability, sheetpiles are often combined with strutting as support (Sabatini et al, 1999). These retaining wall system preferably utilize elastoplastic modelling, as elastoplastic support systems provide a more realistic estimation of excavation stability compared to elastic systems (Do et al, 2016). The bottommost one or two installed struts and wall are critical components that can trigger progressive collapse if they fail (Cheng et al, 2024). Proper design and installation of sheetpile walls are essential to prevent excessive deformation and maintain the integrity of the excavation, especially in challenging soil conditions like those found at the Muara Tawar site.
This research focuses on analyzing the performance of steel sheetpile walls with multi-strut configurations
used as earth retaining structures using Finite Element Method (FEM). FEM is chosen because FEM can reproduce the measurements since arching effect is allowed within the soil (Cheng et al, 2024). The study aims to evaluate the effectiveness of these walls in mitigating lateral earth pressure and ensuring the stability of excavation slopes, while also safeguarding the safety of nearby structures. The analysis will employ three soil models—Mohr- Coulomb (MC), Soft Soil (SS), and Hardening Soil (HS)—to simulate soil behavior. From the past study, it founds that Advanced Soil Model is probably more accurate than Mohr-Coloumb soil model (Hamonangan & Syahputra, 2023; Nawir et al, 2017; Schiena et al, 2024). By comparing the results obtained from these models with field monitoring data, the research seeks to determine which model offers the most realistic prediction of the wall's performance. This finding will contribute valuable insights for optimizing the design and implementation of sheetpile walls in similar geotechnical conditions. material based on a singledimension approach
2. Methodology
This research analyzes the stability of deep excavations in soft soil at the Muara Tawar coastal area using the finite element method. The focus is on evaluating the performance of sheetpile retaining walls with bracing reinforcement in the Steam Turbine Building (STB) #4 area. The analysis utilizes Plaxis 2D software and compares safety factors, bending moments, and deflections against field monitoring data using three different soil models: Mohr-Coulomb, Soft Soil, and Hardening Soil.
This study analyzed deep excavation in soft soil through a comprehensive literature review and extensive data collection (including soil investigation, field tests, and monitoring data). Plaxis 2D was used to evaluate temporary retaining wall design strength and compare safety factors for different sheetpile types and soil models, ultimately providing recommendations for addressing deep excavation challenges. The sheetpile design for the excavation area in the Muara Tawar CCPP Block 2,
Figure 1. Study location
Figure 2. Temporary support during construction Figure 3. Geometry data input of the FE analysis
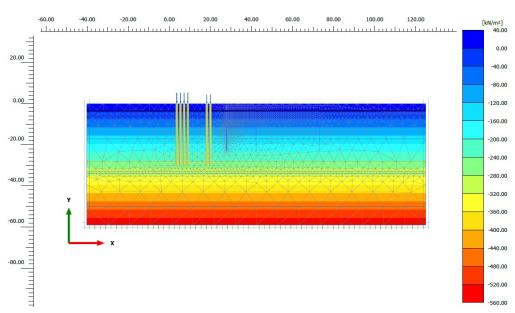
Figure 4. Input data flow condition of the FE analysis
3, and 4 Add-on 650 MW project is based on soil investigation data from Borehole (BH)-05 and Cone Penetration Test (CPT)-05 (Figure 1), considered closest to the analysis location.
2.1 Location
The study areas for this research are located within Muara Tawar CCPP Project 650 MW, Jalan Muara Tawar No 1, Kab. Bekasi, West Java, Indonesia.
2.2 Numerical model
The analysis conducted using the FEM software Plaxis 24.1 focuses on the deepest excavation area directly adjacent to the Central Control Building (CCB), with a detailed cross-section shown in Figure 2.
The planned excavation procedure is as follows:
- a. Lower the ground level from +3.00 to +2.00.
- b. Install sheetpiles to a depth of 22 m (12 m + 10 m) reaching elevation -20.00. Use a double layer of sheetpiles on the side facing the Central Control Building (CCB) and a single layer on the opposite side.
- c. Excavate 1 m of soil to reach elevation +1.00 and install a double layer of H-beam 300 struts (blue).
- d. Repeat step 3 for every subsequent excavation depth of +/- 2 m, installing struts at elevations -1.00, -3.00, and -5.50.
- e. Excavate to elevation -7.00 and install additional sheetpiles to reach a depth of -20.00.
- f. Continue excavation to elevation -7.20 m and install a 2-layer H-beam 300 strutting system.
- g. Excavate to the final planned elevation of -8.80 m.
The finite element analysis of this paper employs three soil models—Mohr-Coulomb, Soft Soil, and Hardening
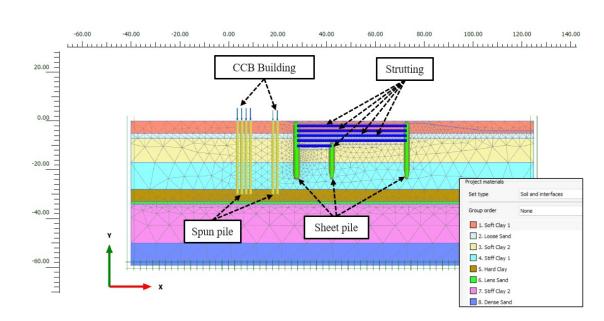
Table 1. Plaxis modelling notes
| No | Items | Model |
|---|---|---|
| 1 | Soil Model 1 | Soft Soil (SS) |
| 2 | Soil Model 2 | Hardening Soil (HS) |
| 3 | Soil Model 3 | Mohr – Columb (MS) |
| 4 | Sheetpile | Plate |
| 5 | Spun Pile CCB | Embeded Beam |
| 6 | Bangunan CCB | Point Load |
| 7 | Strutting | Node to Node Anchor |
Soil—to compare safety factors for two common Ushaped sheet pile types (Type 2 and Type 3, conforming to BS EN 10249 for cold-formed non-alloy steel) available in Indonesia, which exhibit key differences in dimensions and yield strength. Displacement output for each soil model is also analyzed. Subsequently, safety factor and displacement analysis data are compared with actual field monitoring results. Based on the described sheet pile installation plan, the excavation process was modeled using the finite element software Plaxis 2D 24, as shown in Figures 3 and Figure 4.
2.3 Model parameter
The modeling steps for Mohr-Coulomb, Hardening Soil, and Soft Soil are identical. The primary difference lies in the soil parameters used. The Soft Soil model utilizes modified compression index (λ) and modified swelling index (κ) parameters that could be substituted using Compression Index (Cc) dan Swelling Index (Cs). In contrast, the Mohr-Coulomb model uses modulus (E) and Poisson's ratio (υ) values. The Hardening Soil model employs modulus values obtained from triaxial and consolidation tests (Eur, E50, and Eoed).
To simulate the sheetpile wall itself, two types were considered : Type II and Type III U shape sheetpile walls (with distinct material properties), H-beam 300 struts for lateral support, and 600 mm diameter spun piles to represent the existing Central Control Building foundation. Soil and material properties shown in Tables 2 - Tables 7).
To accurately represent the existing Central Control Building (CCB) on the east side of the excavation, we incorporated the ultimate loads transferred to each pile (CCB building load + pile cap load). These loads were then evenly distributed across all piles. Building load data was applied as detailed in Table 8:
Table 2. Inputted Soil Properties of the Mohr Coloumb Model
| Depth (m) | Soil Model | Drainage | Soil | SPT | Yd (kN/m3) | Ysat (kN/m3) | E (kN/m3 | C' (kN/m2) | φ' degree | е | U | k (m/day) |
|---|---|---|---|---|---|---|---|---|---|---|---|---|
| 0 – 5 | MC | Undrained A | Clay | 1 | 11 | 16 | 2500 | 1 | 17 | 1.29 | 0,3 | 10-10 |
| 5 – 7 | MC | Drained | Sand | 11 | 12 | 17 | 11000 | 1 | 20 | 1.25 | 0,2 | 10-4 |
| 7 – 18 | MC | Undrained A | Clay | 1 | 8 | 15 | 3300 | 1 | 17 | 1.99 | 0,3 | 10-10 |
| 18 – 27 | МС | Undrained A | Clay | 11 | 12 | 18 | 9000 | 20 | 25 | 1.28 | 0,3 | 10-10 |
| 27 – 32 | MC | Undrained A | Clay | 41 | 20 | 20 | 20000 | 25 | 36 | 0.69 | 0,3 | 10-9 |
| 32 – 33 | МС | Drained | Sand | 60 | 21 | 23 | 75000 | 2 | 37 | 0.85 | 0,3 | 10-4 |
| 33 – 50 | MC | Undrained A | Clay | 14 | 9 | 15 | 9000 | 20 | 25 | 1.78 | 0,3 | 10-10 |
| 50 - 59 | MC | Drained | Sand | 35 | 19 | 21 | 50000 | 2 | 37 | 1.00 | 0,3 | 10-7 |
Table 3. Inputted Soil Properties of the Soft Soil Model
| Depth (m) | Soil Model | Drain. | Soil | SPT | Yd (kN/m3) | Ysat(kN/ m3) | E50 (kN/m3) | Eur | C' (kN/m2) | ф' degree | е | U | k (m/day) | Cc | Cs |
|---|---|---|---|---|---|---|---|---|---|---|---|---|---|---|---|
| 0 – 5 | SS | Undr. A | Clay | 1 | 11 | 16 | - | - | 1 | 17 | 1.29 | 0,3 | 10-10 | 0, 21 | 0,05 |
| 5 – 7 | HS | Drained | Sand | 11 | 12 | 17 | 11000 | 33000 | 1 | 20 | 1.25 | 0,2 | 10-4 | - | - |
| 7 – 18 | SS | Undr. A | Clay | 1 | 8 | 15 | - | - | 1 | 17 | 1.99 | 0,3 | 10-10 | 0,22 | 0,05 |
| 18 – 27 | HS | Undr. A | Clay | 11 | 12 | 18 | 9000 | 27000 | 20 | 25 | 1.28 | 0,3 | 10-10 | - | - |
| 27 – 32 | HS | Undr. A | Clay | 41 | 20 | 20 | 20000 | 60000 | 25 | 36 | 0.69 | 0,3 | 10-9 | - | - |
| 32 - 33 | HS | Drained | Sand | 60 | 21 | 23 | 75000 | 225000 | 2 | 37 | 0.85 | 0,3 | 10-4 | - | - |
| 33 – 50 | HS | Undr. A | Clay | 14 | 9 | 15 | 9000 | 27000 | 20 | 25 | 1.78 | 0,3 | 10-10 | - | - |
| 50 - 59 | HS | Drained | Sand | 35 | 19 | 21 | 50000 | 150000 | 2 | 37 | 1.00 | 0,3 | 10-7 | - | - |
Table 3. Inputted Soil Properties of the Soft Soil Model
| Depth (m) | Soil Model | Drainage | Soil | SPT | Yd (kN/m3) | Ysat (kN/m3) | E50 (kN/m3 | Eur | C' (kN/m2) | ф' degree | е | U | k (m/day) |
|---|---|---|---|---|---|---|---|---|---|---|---|---|---|
| 0 – 5 | HS | Undrained A | Clay | 1 | 11 | 16 | 2500 | 7500 | 1 | 17 | 1.29 | 0,3 | 10-10 |
| 5 – 7 | HS | Drained | Sand | 11 | 12 | 17 | 11000 | 33000 | 1 | 20 | 1.25 | 0,2 | 10-4 |
| 7 – 18 | HS | Undrained A | Clay | 1 | 8 | 15 | 3300 | 9900 | 1 | 17 | 1.99 | 0,3 | 10-10 |
| 18 – 27 | HS | Undrained A | Clay | 11 | 12 | 18 | 9000 | 27000 | 20 | 25 | 1.28 | 0,3 | 10-10 |
| 27 – 32 | HS | Undrained A | Clay | 41 | 20 | 20 | 20000 | 60000 | 25 | 36 | 0.69 | 0,3 | 10-9 |
| 32 – 33 | HS | Drained | Sand | 60 | 21 | 23 | 75000 | 225000 | 2 | 37 | 0.85 | 0,3 | 10-4 |
| 33 – 50 | HS | Undrained A | Clay | 14 | 9 | 15 | 9000 | 27000 | 20 | 25 | 1.78 | 0,3 | 10-10 |
| 50 - 59 | HS | Drained | Sand | 35 | 19 | 21 | 50000 | 150000 | 2 | 37 | 1 | 0,3 | 10-7 |
Table 5. Inputted properties of U - sheetpile
| Parameter | Type III | Type 2 |
|---|---|---|
| Cross Sectional Area, A (mm²/m) | 19000 | 15250 |
| Inertia Moment, I (mm4/m) | 168000000 | 87400000 |
| Modulus, E (mPa) | 200000 | 200000 |
| Section Modulus (mm3/m) | 134000 | 874000 |
| w (kN/m/m) | 1.50 | 1.20 |
| EA (kN/m) | 3820000 | 3060000 |
| EI (kNm²/m) | 33600 | 17480 |
| U | 0.30 | 0.30 |
Table 6. Properties of strutting beam
| Parameter | H-300 |
|---|---|
| Model | Elastoplastic |
| EA (kN) | 2396000 |
| L (m) | 3.6 |
Table 7. Properties of spun pile
| Parameter | Spunpile D-600 |
|---|---|
| Material Type | Elastoplastic |
| Gamma (kN/m3) | 24 |
| L spacing (m) | 1.5 |
| Diameter (m) | 0.6 |
| Thickness (m) | 0.1 |
Table 8. Inputted properties of spun piles
| Pile Cap | Resultant I | Pile Qty | Load each Pile |
|---|---|---|---|
| F2 | 214.2 kN | 4 | 53.55 kN |
| FC2 | 508.5 kN | 8 | 63.56 kN |
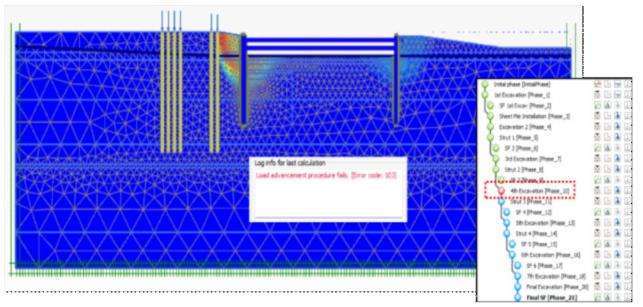
Figure 5. Mohr-Coulomb soil modeling using type 2 sheetpile Figure 6. Soft soil modeling using type 2 sheetpile
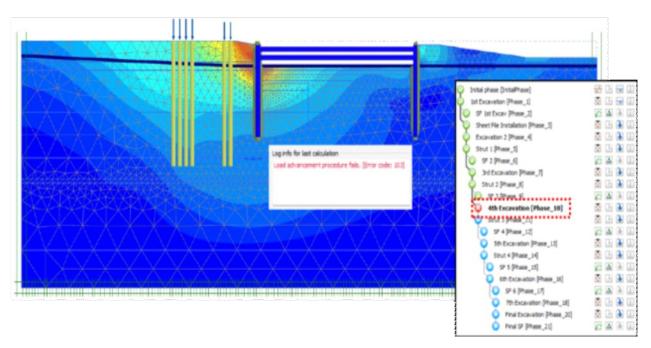
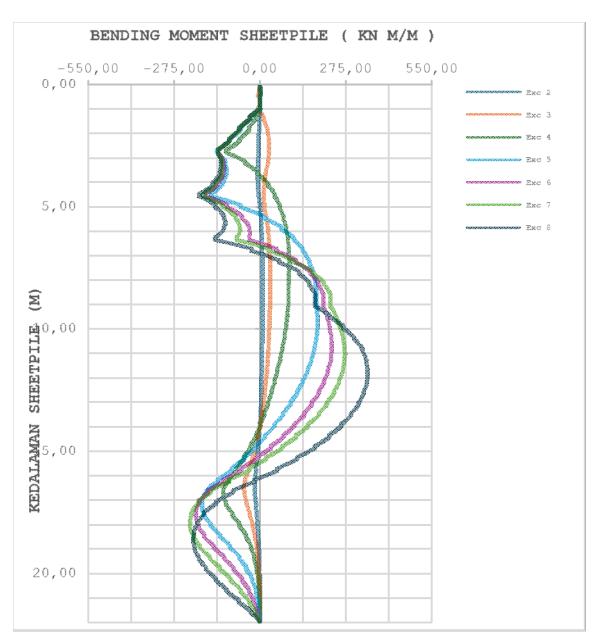
Figure 9. Calculated bending moments for sheetpile
3. Result and Discussion
The analysis conducted using a professional FE software called Plaxis2D 24.1 focuses on the deepest excavation area directly adjacent to the Central Control Building (CCB), with a result as shown:
3.1 Sheetpile type 2
In the finite element simulations using Type 2 sheetpiles, numerical analysis employing three different soil models consistently showed slope failure during the excavation process, particularly at the 4th excavation stage (Figures 5 to Figures 7). This indicates that implementing Type 2
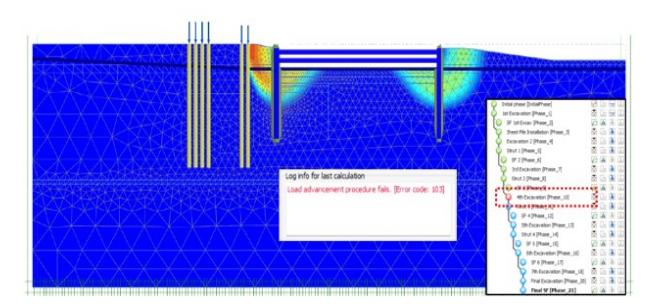

Figure 7. Hardening soil modeling using type 2 sheetpile Figure 8. Mohr-Coulomb soil modeling using type 3 sheetpile
3 - Mohr-Coulomb Figure 9. Calculated bending moments for sheetpile 3 - Mohr-Coulomb
sheetpiles is not technically feasible. Therefore, the research focus shifted to utilizing Type 3 sheetpiles.
3.2 Sheetpile type 3 Mohr-Coulomb model
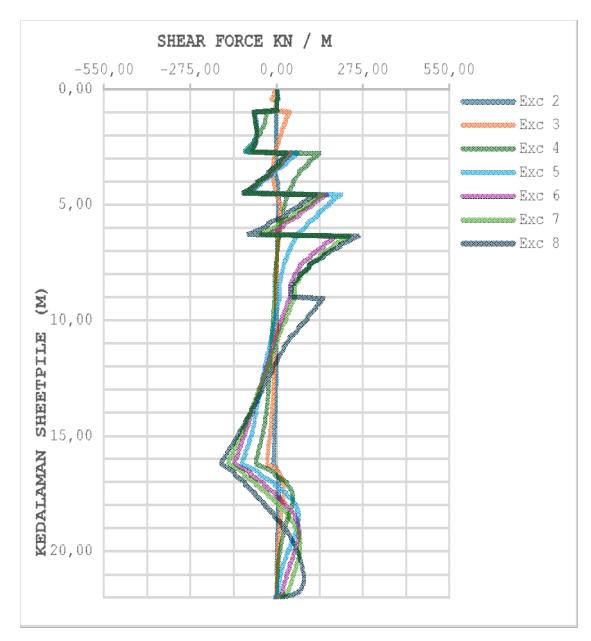
The analysis results show that excavation using Type 3 sheetpiles with H-Beam 300 strutting and the Mohr-Coulomb soil model yields a safety factor (SF) of 1.69 and total displacement of 0.255 m (Figure 8). The maximum bending moment is 345.4 kN m/m, while the minimum bending moment is -213.1 kN m/m (Figure 11). The maximum shear force is 261.8 kN/m, and the minimum shear force is -176.7 kN/m (Figure 11).
Figure 11. Ultimate values for bending moment, shear force, and displacement sheetpile 3 - Mohr-Coulomb
Based on the analysis of the bending moment and shear force envelopes (Figures 9 and Figures 10), it was identified that the maximum values occur at the final excavation stage (8th excavation). Therefore, the ultimate bending moment and shear force values used in the design are those that occur at the 8th excavation stage
3.3 Sheetpile type 3 soft soil model
The analysis results indicate that excavation using Type 3 sheetpiles with H-Beam 300 strutting and the Soft Soil model yields a safety factor (SF) of 1.64 and
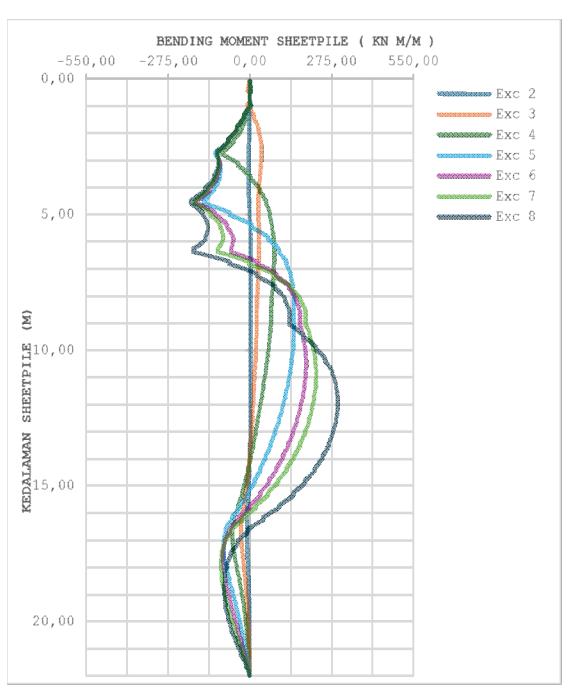
Figure 13. Calculated bending moments for sheetpile 3 – soft soil
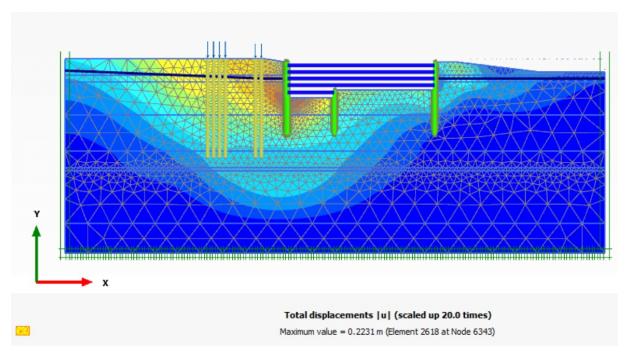
Figure 12. Soft soil modeling using type 3 sheetpile
a maximum displacement of 0.223 m (Figure 12). The maximum bending moment is 295.5 kN m/m, while the minimum bending moment is -197.7 kN m/m (Figure 15). The maximum shear force is 273.4 kN/ m, and the minimum shear force is -134.1 kN/m (Figure 15).
Based on the analysis of the bending moment and shear force envelopes (Figures 13 and 14), it was determined that the maximum values occur at the final excavation stage (8th excavation). Therefore, the ultimate bending moment and shear force values used in the design are those corresponding to the 8th excavation stage.
3.4 Sheetpile type 3 hardening soil model
The analysis using Type 3 sheetpiles, H-Beam 300 strutting, and the Hardening Soil model shows a safety factor (SF) of 1.95 and a maximum displacement of 0.22 (Figure 16) m. The maximum and minimum bending moments are 271.3 kN m/m and -216.5 kN m/ m (Figure 19). Respectively, the maximum shear force is 282.0 kN/m, while the minimum is -118.1 kN/m (Figure 19).
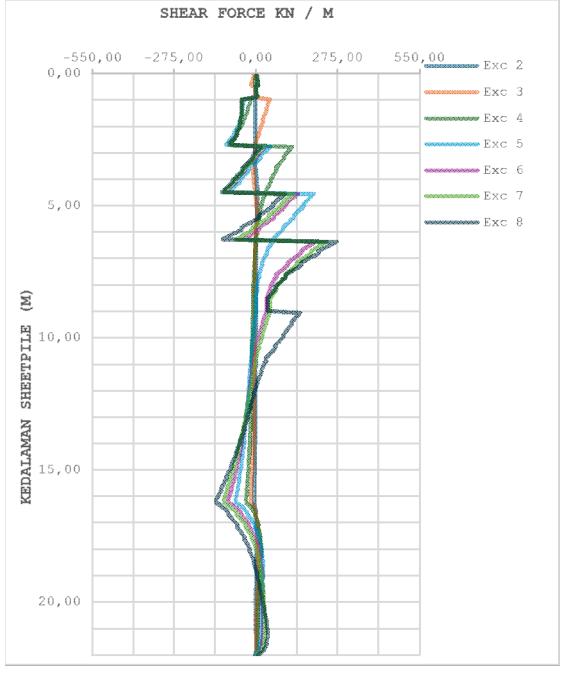
Figure 14. Calculated shear forces for sheetpile 3 – soft soil
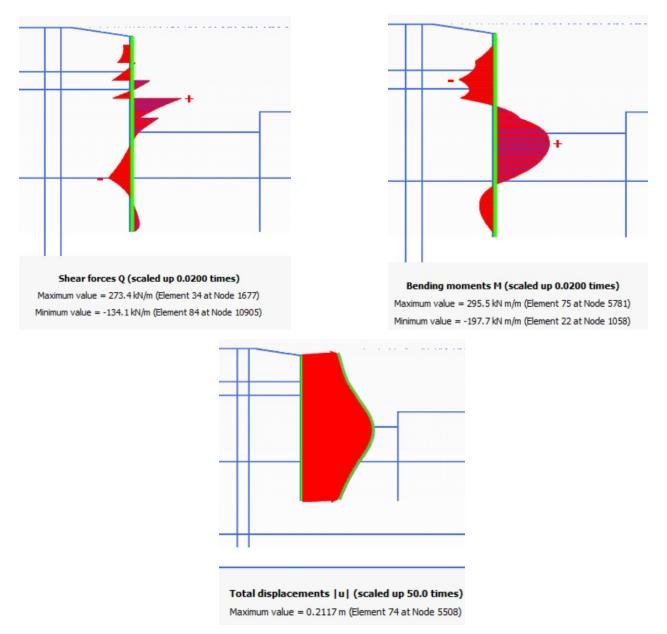
Figure 15. Ultimate values for bending moment, shear force, and displacement sheetpile 3 – soft soil
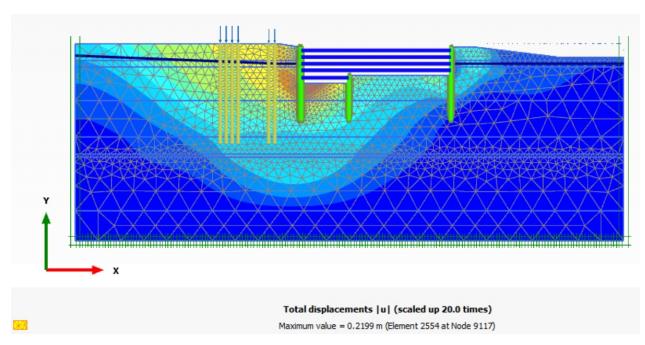
Figure 16. Hardening soil modeling using type 3 sheetpile
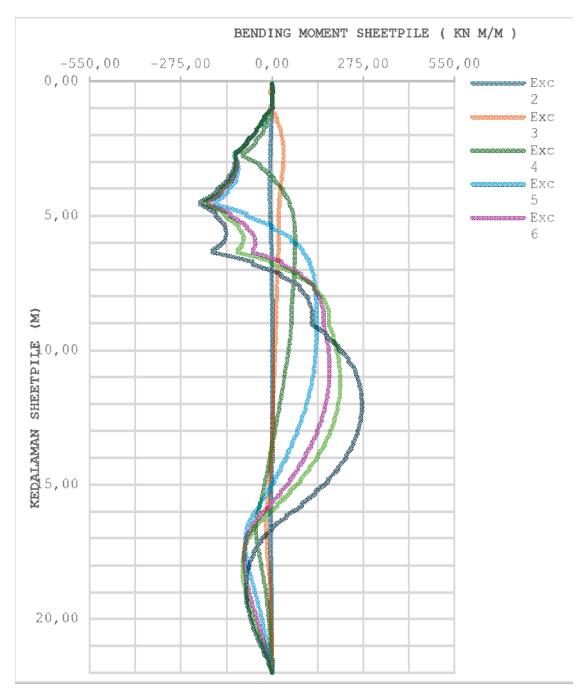
Figure 17. Calculated bending moments for sheetpile 3 – hardening soil
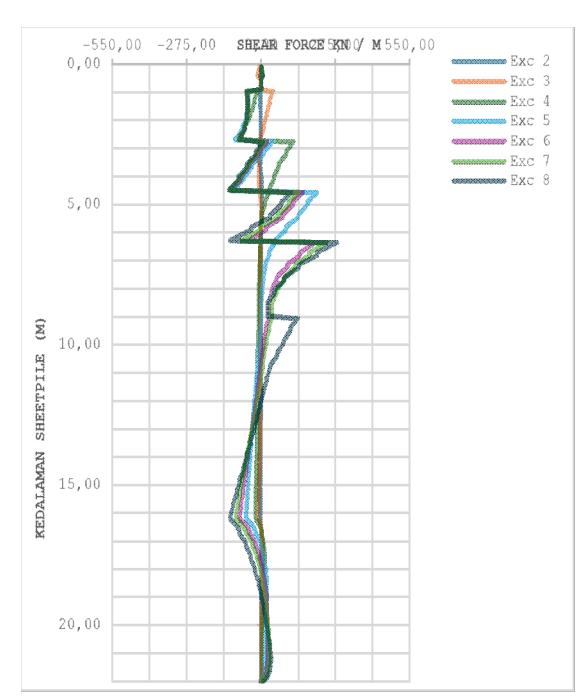
Figure 18. Calculated shear forces for sheetpile 3 – soft soil
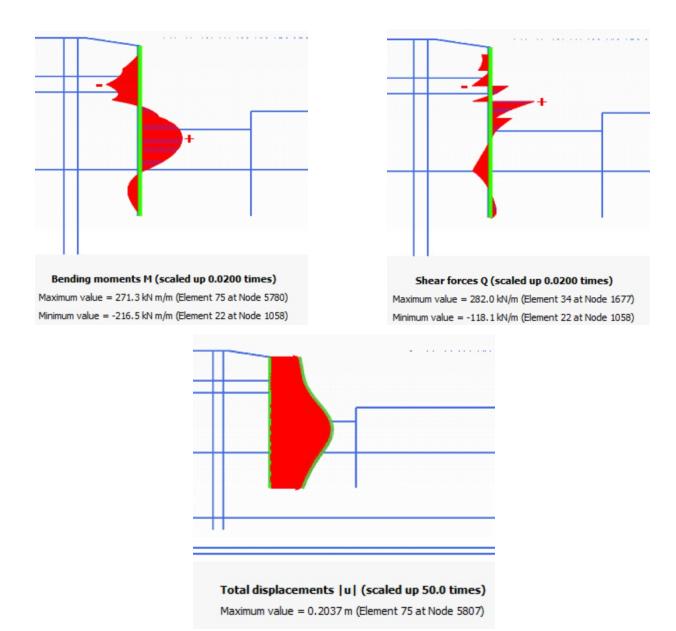
Figure 19. Ultimate values for bending moment, shear force, and displacement sheetpile 3 – hardening soil
Analysis of the bending moment and shear force envelopes (Figure 17 and Figure 18) indicates that maximum values occur at the final (8th) excavation stage. Therefore, design calculations utilize the ultimate bending moment and shear force values corresponding to this stage.
3.5 Discussion
In this study, monitoring was conducted at three monitoring points: point A, point B, and point C (Figure 20). However, due to implementation limitations, data was only collected at the top of the
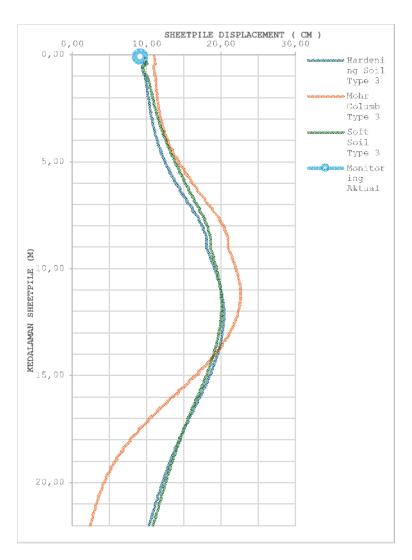
Figure 20. Sheetpile displacement
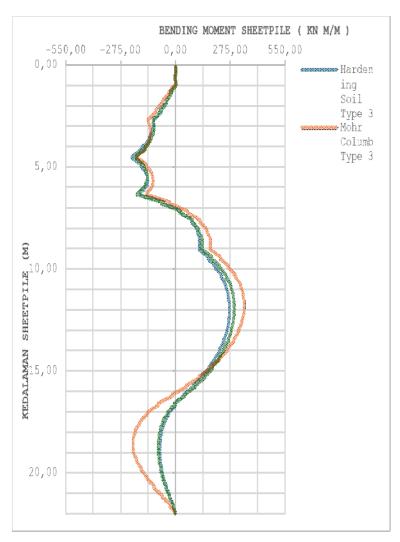
Figure 22. Calculated bending moments of Hardening Soil vs Mohr Coulomb for type 3
Remark :
- 1. In the analysis using sheetpile type 2, a collapse occurred resulting in the bending moment not being formed.
- 2. The red dashed line represents the moment capacity of sheetpile type 3, which is 528 kN m/m.
Table 9. Properties of strutting beam
| SP Type | Soil Model | Displ. | Tip Displ. | Remark |
|---|---|---|---|---|
| (mm) | (mm) | |||
| SS | 211 | 97 | - | |
| Type 3 | HS | 203 | 95 | - |
| MC | 226 | 110 | - | |
| SS | - | - | Failure | |
| Type 2 | HS | - | - | Failure |
| MC | Failure | |||
| Monitoring | - | 91 | - | |
Table 11. Resume bending moment
| SP Type | Soil | Maximum | Minimum | Remark |
|---|---|---|---|---|
| Model | (kN m/m) | (kN m/m) | ||
| SS | 295.5 | -197.7 | - | |
| Type 3 | HS | 271.3 | -216.5 | - |
| MC | 345.4 | -213.1 | - | |
| SS | - | - | Failure | |
| Type 2 | HS | - | - | Failure |
| MC | - | - | Failure |
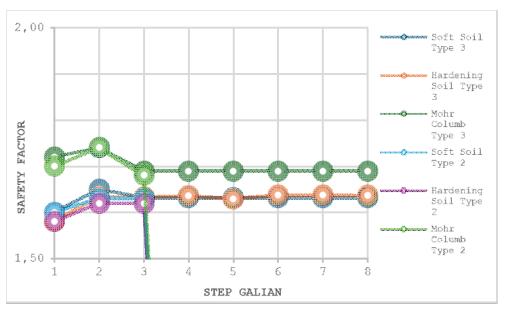
Figure 21. Calculated safety factor values
Note: When using sheetpile type 2, collapse occurred at the 4th excavation step, resulting in a safety factor of 0 after reaching that depth.
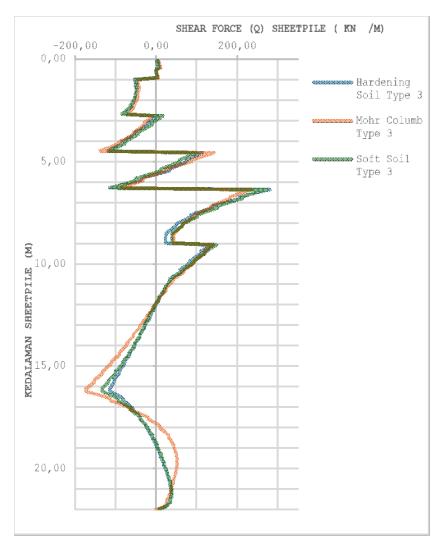
Figure 23. Calculated shear forces of Hardening Soils vs Mohr Coulomb vs Soft Soils for Type 3
Remark :
1. In the analysis using sheetpile type 2, a collapse occurred resulting in the shear strength not being formed.
Table 10. Resume safety factor Plaxis 2D
| No | Exc. Step | SS Type 3 | HS Type 3 | MC Type 3 | SS Type 2 | HS Type 2 | MC Type 2 |
|---|---|---|---|---|---|---|---|
| 1 | 1 | 1.60 | 1.58 | 1.72 | 1.60 | 1.58 | 1.70 |
| 2 | 2 | 1.65 | 1.63 | 1.74 | 1.63 | 1.62 | 1.74 |
| 3 | 3 | 1.63 | 1.63 | 1.69 | 1.63 | 1.62 | 1.68 |
| 4 | 4 | 1.63 | 1.64 | 1.69 | - | - | - |
| 5 | 5 | 1.63 | 1.63 | 1.69 | - | - | - |
| 6 | 6 | 1.63 | 1.64 | 1.69 | - | - | - |
| 7 | 7 | 1.63 | 1.64 | 1.69 | - | - | - |
| 8 | 8 | 1.63 | 1.64 | 1.69 | - | - | - |
Table 12. Resume shear strength
| SP Type | Soil Model | Maximum (kN /m) | Minimum (kN/m) | Remark |
|---|---|---|---|---|
| SS | 273.4 | -134.1 | ||
| Type 3 | HS | 282.0 | -118.1 | |
| MC | 261.8 | -176.7 | ||
| SS | - | - | Failure | |
| Type 2 | HS | - | - | Failure |
| MC | Failure |
sheetpile, specifically at elevation -1.00 (shown in Table 9, based on Figure 20).
The envelope safety factor data for each soil model is shown in Figure 21 based on Table 10.
Bending Moment Data shown in Table 11 and Figure 22 (based on Figure 9; Figure 13; and Figure 17).
Shear Strength Result Data shown in Table 12 and Figure 23 (based on Figure 10; Figure 14; and Figure 18).
4. Conclusion
The key findings of this research are as follows:
- 1. The 2D finite element analysis results show that the type 2 sheetpile system with double layer strutting failed at the 4th excavation stage. However, the type 3 sheetpile system with double layer strutting remained stable, with the Mohr-Coulomb soil model yielding the highest Safety Factor (SF) of 1.78, followed by the Hardening Soil and Soft Soil models both at 1.64.
- 2. Analysis results show that the maximum bending moment, deformation, and shear force occur at the excavation base, consistent with Song et al. (2024), stated that the last one or two struts are the most vulnerable components and can trigger progressive collapse if they fail.
- 3. The vertical deformation analysis using the finite element method demonstrated the high accuracy of the Hardening Soil model, which predicted deformation within +4 mm of the field monitoring data. The Soft Soil and Mohr-Coulomb models showed deviations of +6 mm and +19 mm, respectively. These results support the findings of Bozkurt et al. (2023), who emphasized the reliability of finite element methods in predicting realistic deformations in deep excavation scenarios. When detailed soil data are available, the use of advanced soil models such as Soft Soil and Hardening Soil is recommended over the Mohr-Coulomb model to achieve greater predictive accuracy.
- 4. The finite element analysis using the Hardening Soil model predicted a vertical deformation of 95 mm, which is close to the field monitoring data of 91 mm. Although this value slightly exceeds the limit specified in the Indonesian National Standard (SNI 8460:2017), which is 80 mm (or 0.5% of the 16 m sheet pile height), various anticipatory measures implemented during excavation proved effective. These included routine visual monitoring (which revealed no cracks or signs of landslides), effective groundwater drawdown control, restrictions on heavy equipment loads, and thorough inspections of the sheet pile, particularly at the joints. As a result, no signs of excavation failure were observed, and the structure was successfully constructed.
- 5. A comparison of soil models revealed that advanced models, such as Hardening Soil and Soft Soil, provided superior predictions of sheetpile deflection compared to the Mohr-Coulomb model. This
Acknowledgement
The authors gratefully acknowledge the following contributions to PT. Hutama Karya (Persero) for providing funding and essential data support during this research.