
Abstrak
Di dalam analisis dinamis, periode getar struktur diketahui menjadi faktor penting yang menentukan perilaku struktur terhadap gempa. Nilai periode getar struktur erat kaitannya dengan kekakuan dan massa bangunan, dimana keduanya berhubungan dengan tinggi dan jumlah lantai bangunan. Penelitian ini bertujuan mencari hubungan antara periode getar struktur dengan tinggi dan jumlah lantai bangunan di Indonesia. Penelitian ini menggunakan perhitungan nilai eigen untuk mendapatkan periode getar struktur. Sebanyak 27 bangunan gedung dengan ketinggian dan jumlah lantai yang bervariasi dihitung periode getarnya. Selanjutnya dilakukan analisis statistik untuk mendapatkan rumus empirik periode getar struktur. Hasil penelitian menunjukan bahwa data nilai periode getar dan persamaan yang dihasilkan berada dalam rentang data penelitian sebelumnya yang menggunakan metode pengukuran langsung. Selain itu, penelitian ini mengusulkan rumus empirik periode getar struktur yang dikembangkan berdasarkan batas bawah dari data penelitian ini untuk memberikan perkiraan gaya gempa desain yang konservatif.
Kata-kata kunci: Periode getar, tinggi bangunan, jumlah lantai, rangka pemikul momen, beton.
1. Introduction
The structural response to earthquake acceleration has been a primary concern in efforts to enhance building
resilience against seismic threats. The influence of earthquake acceleration at a specific location on the structural response is determined by the dynamic properties of the structure, often simplified into the
* Penulis Korespondensi: ilham@lecturer.undip.ac.id
structural vibration period parameter. The structural vibration period governs the maximum acceleration in the response spectrum, which, in turn, determines the seismic design forces.
Buildings with multiple degrees of freedom have various structural vibration periods that correlate with specific vibrational modes. Nonetheless, the fundamental structural vibration period plays a crucial role in structural analysis because structures with regular forms typically deform in accordance with the fundamental structural vibration mode. Hence, building design codes that use the equivalent static method require the fundamental structural vibration period to determine seismic loads on the structure.
The values of structural vibration periods are typically obtained through direct measurements on buildings. Measurement results show a correlation between building height and the fundamental structural vibration period (Goel & Chopra, 1997). This relationship has been utilized in earthquake-resistant building design codes in various countries to quickly estimate the structural vibration period for buildings of specific heights (CEN, 2004; Gedam et al., 2016).
Nowadays, the method of dynamic analysis of structures has developed rapidly, supported by advances in computer technology. Modern computing technology allows for more realistic structural modeling and more precise calculations (Crowley & Pinho, 2004; Smith & Crowe, 1986). Results from the structural analysis, including the natural period of the structures calculated using eigenvalue analysis, have been widely used in structural design.
Recent studies have identified building properties that affect the vibration period of structures and their implications for earthquake-resistant design (Oliveira & Navarro, 2010). Basic structural dynamics shows that the vibration period of a building structure is influenced by its stiffness and mass. The mass and stiffness of buildings are closely related to building design regulations and codes. As a result, the vibration period of building structures varies between countries.
This study aims to obtain an empirical formula for the fundamental vibration period of building structures in Indonesia calculated using eigenvalue analysis. The analysis results are then compared with existing empirical formulas in building codes and previous studies.
This study focuses on a region in Indonesia, assuming that all buildings are designed in accordance with the country's prevailing regulations. In general, the geographic location of a building influences the earthquake acceleration response spectrum, which, in turn, affects the design of seismic-resistant structural elements at that location. However, there has yet to be a comprehensive study on the variations in the dimensions and stiffness of building structures across different regions in Indonesia. This research limits its scope to data from the island of Java, which has a significant number of high-rise buildings and offers
easy access to building design data. Java itself is divided into several regions, each with different levels of earthquake vulnerability, with PGA values ranging from about 0.3g to roughly 0.6g. With this variation in mind, this research aims to provide an overview of buildings in Indonesia, particularly in regions with similar earthquake vulnerability.
2. Current Empirical Formulas for Structural Vibration Period
The empirical formula for the fundamental vibration period of a building structure is prescribed in several earthquake loading regulations, including UBC 97, Eurocode 8, and ASCE 7-16 (ASCE, 2016; CEN, 2004; UBC, 1997). The empirical formulas for calculating the vibration period of a structure given in UBC 97 (UBC, 1997) and Eurocode 8 (CEN, 2004) are almost identical. Both codes express the fundamental vibration period of the structure (T) as a function of the building height (H), as shown in Equation (1) (UBC 97) and Equation (2) (Eurocode 8). The building height (H) is measured in meters.
As outlined in the introduction, empirical formulas are employed to quickly and efficiently determine the fundamental vibration period of a building. Once the vibration period is calculated, it can be used to estimate the earthquake load acting on the structure, with the aid of a design response spectrum graph in accordance with relevant regulations. This approach allows building designers to estimate the earthquake load on the building without the need for dynamic structural analysis. Such a method is particularly useful for building designers who are implementing the equivalent static method in their designs or who lack access to advanced structural analysis software. Additionally, the vibration period derived from these empirical calculations can serve as a general reference for buildings of a specific height.
ASCE 7-16 (ASCE, 2016) provides two empirical formulas for calculating the fundamental vibration period of reinforced concrete moment-resisting frames. The first formula employs building height (H) as shown in Equation (3), while the second uses the number of floors (N) as presented in Equation (4). Equations (3) and (4) were adopted in the Indonesia's earthquake-resistant building design codes, SNI 1726- 2019.
\[T = 0.0731 H^{3/4} \tag{1}\]
\[T = 0.075 H^{3/4} (2)\]
\[T = 0.0466 H^{0.9} (3)\]
\[T = 0.1 N \tag{4}\]
The adoption of empirical formulas from the regulations of other countries can be an instant and good solution for countries that do not yet have related research. However, considering the importance of understanding the vibration period of building structures for building safety, it is better if research on this matter is also conducted in each country according to its geographic location and soil conditions.
The empirical formulas for the fundamental vibration period of structures have been widely studied. Goel & Chopra (1997) studied the vibration period of buildings in the US from 1971 to 1994. The results of the measurements from 27 reinforced concrete momentresisting frame structures are presented in Equation (5) with the height in meters. In Turkey, 24 new buildings of reinforced concrete moment-resisting frame structures were studied to measure their fundamental vibration period (Kaplan et al., 2021). The results are expressed as a linear relationship between the natural period of the structures and building height (H) in meters, as shown in Equation (6).
\[T = 0.0524 H^{0.9} (5)\]
\[T = 0.0195 H (6)\]
A linear relationship between the structural vibration period and building height was also reported by Gallipoli et al. (2010) for buildings in Europe, as shown in Equation (7). Gallipoli et al.(2010) analyzed 244 buildings across Europe, including 65 in Italy, 47 in Slovenia, 62 in Croatia, and 70 in the Republic of Macedonia.
\[T = 0.016 H\] (7)
Michel et al. (2010) analyzed the vibration periods of 26 buildings in Grenoble and 28 buildings in Nice, France. Their analysis yielded empirical formulas for the fundamental structural vibration period in France, as presented in Equations (8) and (9).
\[T = 0.013 H\] (8)
\[T = 0,039 H (9)\]
Oliveira & Navarro (2010) conducted research on 197 reinforced concrete buildings in Portugal, stating that numerical structural analysis provided highly accurate results that closely matched field measurements, provided the structural modeling was performed realistically. Oliveira & Navarro (2010) proposed relationships for the fundamental structural vibration period as indicated in Equations (10) and (11). It is evident that the structural vibration period on soft soil (Equation 11) is higher than that on stiff soil (Equation 10).
\[T = 0.1 N\] for buildings on stiff soil (10)
\[T = 0.126\] for building onf stiff soil (11)
Research on empirical formulas for the vibration period of building structures in Asia can be found in several publications (Hong & Hwang, 2000; Kewate & Murudi, 2019; Pan et al., 2014; Salameh et al., 2016). Hong & Hwang (2000) studied the vibration periods of 21 reinforced concrete moment-resisting frame structures in Taiwan. The results showed that buildings in Taiwan were stiffer with smaller natural periods for buildings of the same height compared to the empirical formula in UBC 97. Hong & Hwang (2000) proposed Equation (12) to estimate the vibration period of structures in Taiwan.
In India, Kewate & Murudi (2019) conducted modeling and numerical analysis on 21 reinforced concrete moment-resisting frame structures. Their results
indicated that the fundamental vibration period of buildings in India can be estimated empirically using Equation (13).
\[T = 0.0294 \ H^{0.804} \tag{12}\]
\[T = 0.132 H^{0.795} (13)\]
The influence of soil condition on the vibration period of structures was also investigated by Salameh et al. (2016) and Pan et al. (2014). Salameh et al. (2016) conducted an investigation on building structures in Lebanon. Their study resulted in two equations for the vibration period of structures, expressed as a function of the number of floors (N) and soil condition. The fundamental period of structures on rock soil is expressed in Equation (14), and for soft soil in Equation (15).
\[T = N/23\] for buildings on stiff soil (14)
\[T = N / 18\] for building onf stiff soil (15)
Pan et al. (2014) conducted vibration measurements on 116 buildings in Singapore. The number of floors of the buildings ranged from 4 to 30 floors. They proposed empirical formulas for the fundamental vibration period of structures for two soil conditions, hard soil and soft soil, as shown in Equations (16) and (17).
\[T = 0.0244 H^{0.884}\] for building onf stiff soil (16)
\[T = 0.0372 H^{0.832} mtext{ for building onf stiff soil} mtext{(17)}\]
Sharma et al. (2020) examined the effect of seismic soil -structure interaction (SSI) on the natural period of reinforced concrete (RC) building frames supported by pile foundations. Using finite element modeling (OpenSEES), they analyzed various structural and soil conditions and found that SSI increases the natural period, especially in tall, narrow buildings and structures built on soft soils. Buildings supported by single piles exhibited greater SSI effects compared to those with pile groups, which provide additional stiffness and reduce rocking behavior. To improve period estimation, the study developed an artificial neural network (ANN)-based model to predict a modification factor (MF) that adjusts the fixed-base natural period to account for SSI effects.
The influence of walls on the fundamental structural vibration period has been widely studied by researchers (Ditommaso et al., 2024; Inqiad et al., 2024; Kose, 2009). Kose (2009) utilized numerical simulations and Artificial Neural Networks (ANN) to develop a generalized empirical formula for estimating the fundamental vibration period of buildings with shear walls or infilled walls. The findings, presented in a multilinear equation (Equation 18), demonstrate that the presence of shear and infill walls significantly increases structural stiffness, thereby reducing the fundamental vibration period.
Ditommaso et al. (2024) investigated the fundamental period of infilled reinforced concrete (RC) framed structures, incorporating the effects of maximum interstory drift at different design limit states. Through a comprehensive analysis of over 330 RC structures, including experimental testing and nonlinear numerical simulations, they developed more accurate periodheight relationships tailored to various limit states. Their study introduces new empirical formulations that more effectively account for the role of infill panels at different damage levels, leading to improved seismic design estimations.
Similarly, Inqiad et al. (2024) explored the natural vibration period of RC frame structures with masonry infill using machine learning techniques. Utilizing data from previous research, they applied sensitivity analyses to identify key predictors of the vibration period. Their findings highlight the number of storeys and the infill opening ratio as the most influential factors, further advancing the accuracy of vibration period predictions in structural engineering.
\[T = 0.1367 + 0.0301 H - 0.1663 S - 0.0305I\] (18)
where H = building height in meters, S = the ratio of shear wall area to floor area in percentage, and I = the ratio of infill wall area to the total wall panel area.
In general, two main parameters are used to empirically calculate the vibration period of a structure: building height (H) and the number of floors (N). Previous studies have revealed variations in the empirical formulas for the vibration period of structures developed by different researchers. These formulas are typically expressed in either power or linear forms. The exponent values in the power form of the empirical formulas range from 0.795 to 0.9, indicating values that approach 1, or are essentially linear.
The presence of shear walls and infill walls significantly affects the vibration period of a structure, as shown in Equation 18. However, this study limits the analysis to structures without structural walls or shear walls in order to reduce model complexity. The vibration period of structures with shear walls is addressed in separate research. This limitation also applies to the building height considered in the analysis, which is capped at a maximum of 60.5 meters. This restriction arises because taller buildings are generally designed with dual systems, such as the inclusion of shear walls.
3. Methodology
The buildings selected for this study are real structures constructed at multiple locations in Indonesia. A total of 27 buildings were analyzed, each with varying numbers of floors and heights, as indicated in Table 1. All analyzed buildings are reinforced concrete structures with moment-resisting frame systems. The structural vibration period was determined through eigenvalue analysis using the Midas Gen software (Midas IT, 2023). Eigenvalue analysis is a widely used method for calculating the vibration period of a structure and is discussed in many structural dynamics textbooks, such as that of Paz & Kim (2019).
The structures were modeled as frame elements without infill walls to represent the moment-resisting
Table 3. Location, height, and number of floors of analyzed buildings
| Building ID | Location | Height (m) | Number of Floors |
|---|---|---|---|
| RPM-1 | Semarang | 7.60 | 3.00 |
| RPM-2 | Semarang | 10.00 | 3.00 |
| RPM-3 | Pekalongan | 12.70 | 3.00 |
| RPM-4 | Yogyakarta | 13.50 | 3.00 |
| RPM-5 | Semarang | 16.00 | 4.00 |
| RPM-6 | Temanggung | 18.00 | 6.00 |
| RPM-7 | Tangerang | 19.40 | 6.00 |
| RPM-8 | Kudus | 20.00 | 5.00 |
| RPM-9 | Semarang | 20.80 | 5.00 |
| RPM-10 | Depok | 22.80 | 6.00 |
| RPM-11 | Sukoharjo | 23.20 | 7.00 |
| RPM-12 | Semarang | 24.50 | 7.00 |
| RPM-13 | Semarang | 24.85 | 6.00 |
| RPM-14 | Solo | 26.00 | 8.00 |
| RPM-15 | Semarang | 26.40 | 8.00 |
| RPM-16 | Salatiga | 27.20 | 8.00 |
| RPM-17 | Surabaya | 28.30 | 7.00 |
| RPM-18 | Magelang | 29.00 | 8.00 |
| RPM-19 | Bandung | 30.30 | 7.00 |
| RPM-20 | Yogyakarta | 31.00 | 8.00 |
| RPM-21 | Solo | 33.60 | 10.00 |
| RPM-22 | Semarang | 35.00 | 7.00 |
| RPM-23 | Semarang | 36.00 | 8.00 |
| RPM-24 | Semarang | 38.50 | 10.00 |
| RPM-25 | Jakarta | 44.00 | 10.00 |
| RPM-26 | Sukoharjo | 45.00 | 10.00 |
| RPM-27 | Jakarta | 60.50 | 15.00 |
frame structures. The considered mass includes 100% of the structure's self-weight, including walls, and 25% of the live load. The structural models were selected as open frames without infill based on a conservative modeling approach, where the connections between the frame structures, facades, and infill walls are assumed to detach during an earthquake. The structures analyzed are based on the design drawings of buildings constructed in Indonesia. The selection of these buildings was not driven by a specific layout or configuration but rather aims to represent the variety of building structures found in Indonesia. However, this study limits the analysis to structures with a dominant vibration mode in the translational direction. The fundamental structural vibration periods obtained from eigenvalue analysis were statistically analyzed to derive empirical formulas for the relationship between the fundamental structural vibration period, the number of building floors, and building height. The empirical formulas from this study were compared with empirical formulas from previous research and building design codes.
4. Results
The relationship between building height and the fundamental structural vibration period is depicted in Figure 1. Previous research has shown that the relationship between building height and the fundamental structural vibration period can be
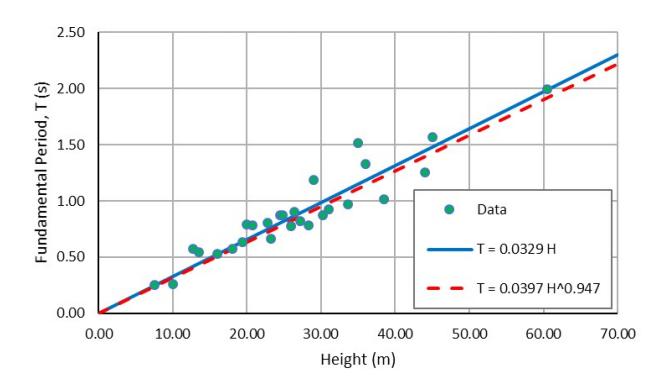
Figure 1. Relationship between building height (H) and fundamental structural vibration period (T).
expressed using linear and power equations. Both equation types were evaluated for their appropriateness in representing the data from this study. The explanation of how regression is performed to derive an equation that represents the data can be found in the reference (Chatterjee & Hadi, 2012).
Regression analysis resulted in Equations (19) and (20), which were deemed most suitable for representing the data from this research. The coefficients of determination (R²) for both equations are R² = 0.881 for Equation (19) and R² = 0.878 for Equation (20). It is evident that the R² values for both equations are nearly identical, with equation 19, which utilizes a power function, slightly better at representing the data from this study. However, the exponent value in Equation (19) approaches 1, indicating that the equation approximates a linear form.
\[T = 0.0397 H^{0.947} (19)\]
\[T = 0.0329 \tag{20}\]
The relationship between the number of building floors and the fundamental structural vibration period is presented in Figure 2. Linear and power equations were evaluated for their suitability in representing the data. Both equations closely align, indicating a similar level of suitability. In the relationship between the number of floors and the structural vibration period, the power equation represented by equation 21 has a slightly higher coefficient of determination (R²) at R² = 0.708 compared to the linear equation represented by Equation (22) with R² = 0.707. However, it should be noted that the difference in R² values between the two equations is very small, and the exponent value in Equation (21), nearing 1, suggests a linear-like nature of the equation.
\[T = 0.138 N^{0.96} (21)\]
\[T = 0.127 N (22)\]
Comparing the suitability of building height and the number of floors in estimating the fundamental structural vibration period, this analysis indicates that using building height provides a better fit compared to using the number of floors.
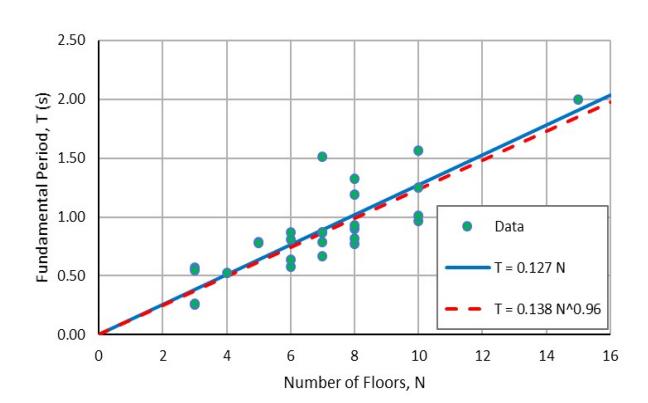
Figure 2. Relationship between the number of floors (N) and the fundamental structural vibration period (T).
5. Discussion
The results of this study indicate that both linear and power equations can be employed to represent the relationship between building height and the fundamental structural vibration period, with relatively similar coefficient of determination (R²) values. For the sake of simplicity in formula usage, the empirical formula for the structural vibration period in this study adopts linear equations.
5.1 Comparison with previous research
A comparison of the structural vibration periods between Equation (20) of this study and equations from previous research is presented in Figure 3. The research by Goel & Chopra (1997) involved direct measurements on buildings, but data were collected during seismic events from the San Fernando earthquake in 1971 to the Northridge earthquake in 1994 in the United States. This situation implies that the infill walls may not have been fully effective, resulting in the structures behaving more like moment-resisting frames.
It is noteworthy that the graph from Equation 20 closely resembles the one in the research by Goel & Chopra (1997), despite differences in the buildings studied and the research methods used. It is important to highlight that Goel & Chopra's research (1997) involved direct measurements on buildings, with data collected during seismic events ranging from the 1971 San Fernando earthquake to the 1994 Northridge earthquake in the United States. This context suggests that the infill walls may not have been fully effective, leading the structures to behave more like moment-resisting frames.
Conversely, the results from Kaplan et al. (2021) in Turkey, Gallipoli et al. (2010) in Europe, Michel et al. (2010) in France, Hong & Hwang (2000) in Taiwan, and Pan et al. (2014) in Singapore yield lower values for the vibration period compared to the findings of this study. These lower period values can be attributed to the influence of infill walls, which stiffen the building when subjected to direct structural vibration measurements (Kose, 2009). The study by Kewate & Murudi (2019) in India involved numerical modeling using the finite element method, with structures represented as moment-resisting frames. The findings
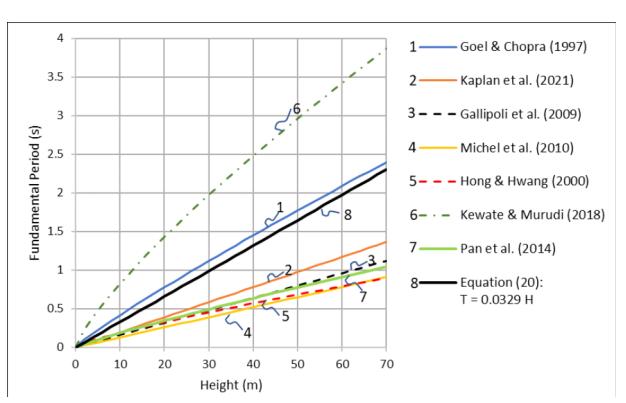
Figure 3. Relationship between building height (H) and period (T) from several studies
indicate that the structural vibration period in India is greater compared to structures in other regions summarized from references. In general, it can be stated that the data and equations for the vibration period obtained in this research fall within the range of previous research data.
5.2 Statistical analysis of the structural vibration period
The empirical formula for the fundamental structural vibration period can be expressed in a general equation, as shown in Equation (23), and in natural logarithmic form, as shown in Equation (24). The difference between the logarithm of the vibration period data from eigenvalues \((T_e)\) and the logarithm of the vibration period calculated using empirical formula Equation (20) is referred to as residual errors \((\delta)\), expressed in Equation (25). Furthermore, the standard deviation (SD) for a dataset of n residual errors can be calculated using Equation (26). The lower bound is determined by subtracting the standard deviation (SD) from Equation (24), as expressed in Equation (27), allowing the lower bound of the vibration period \((T_L)\) to be expressed using Equation (28). The procedure outlined above yields a new empirical formula in the form of Equation (29), representing the lower bound of the data from this research. Similarly, the upper bound of the fundamental structural vibration period \((T_U)\) can be expressed as shown in Equation (30).
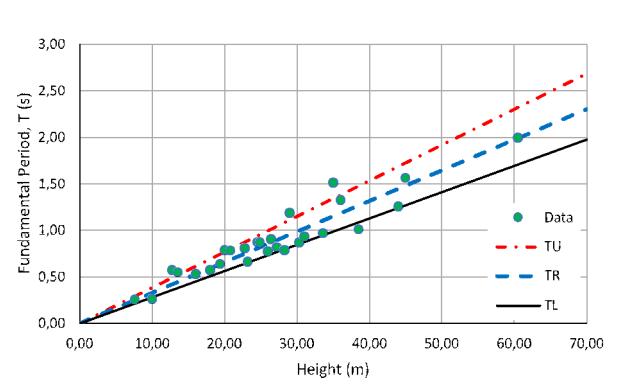
Figure 4. The placement of the best-fit curve \((T_R)\), upper bound \((T_U)\), and lower bound \((T_L)\) in relation to height H vs T data
\[T = \alpha H \tag{23}\]
\[Ln T = Ln \alpha + Ln H \tag{24}\]
\[S = Ln T_e - LnT (25)\]
\[SD = \sqrt{\frac{\sum_{i=1}^{n} (\ln T_{ei} - \ln T_{i})^{2}}{n-2}}\] (26)
\[Ln T_L = Ln \alpha + Ln H - SD\] (27)
\[T_L = \alpha \cdot e^{-SD} \cdot H \tag{28}\]
\[T_L = 0.028 H (29)\]
\[T_U = 0.038 H (30)\]
The data from this research, along with the values of the best-fit equation \((T_R)\), lower bound \((T_L)\), and upper bound \((T_U)\), are presented in Figure 4. The upper bound of the structural vibration period indicates values within the standard deviation limits. Mathematically, the upper bound value can be correlated with the lower bound value through a multiplying constant Cu, as shown in Equation (31). The calculations in this study yield a Cu value of 1.36.
The relationship between the number of floors and the structural vibration period is incorporated into seismic codes to enable a quick estimation of T values. As depicted in Figure 2, this analysis reveals that the correlation between the number of floors and the structural vibration period is weaker compared to the correlation between building height and the structural vibration period. However, using the same statistical analysis procedure, the lower and upper bounds of Equation (22) can be calculated, as shown in Figure 5. The lower bound equation for the empirical formula relating the number of floors and the structural vibration period is presented as Equation (32). The obtained lower bound values (Equation 32) align with the specifications outlined in ASCE7-16 and SNI 1726 -2019.
\[T_L = 0.1 N\] (32)
The lower bound \((T_L)\) and upper bound \((T_U)\) equations for the structure's vibration period provide a range of vibration periods for buildings at a specific height or number of floors. This range can serve as a reference for building designers, ensuring that the vibration period of the designed building falls within it.
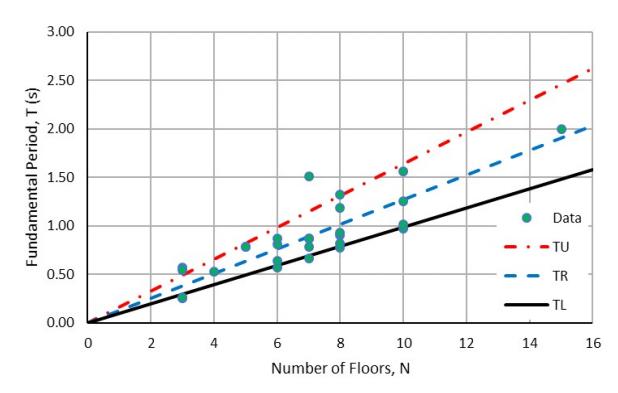
Figure 5. The placement of the best-fit curve \((T_R)\), upper bound \((T_U)\), and lower bound \((T_L)\) in relation to number of floors N vs T data
Additionally, when determining earthquake loads, selecting the vibration period based on the lower bound equation (TL) will result in a more conservative estimate, as explained in greater detail in section 5.3.
5.3 Proposed Empirical Formula for the Structural Vibration Period
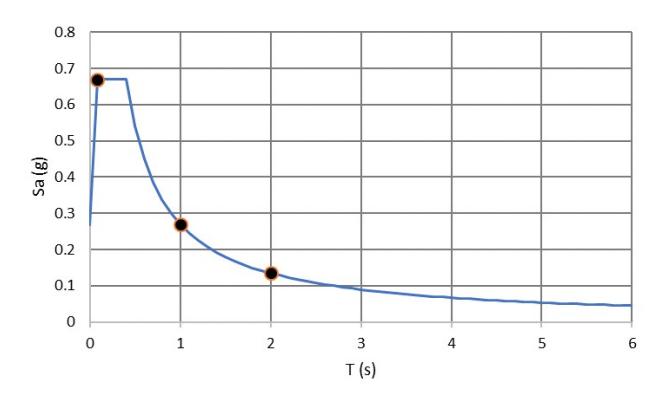
In seismic force-based structural analysis, the design acceleration magnitude depends on the structural vibration period, as represented in the response spectrum graph shown in Figure 6. It illustrates in Figure 6 that structures with shorter vibration periods result in higher seismic design acceleration (Sa) compared to structures with longer vibration periods. An exception occurs when the natural period T values are less than Ts, which typically range from 0.1 to 0.2 seconds. However, T values within this range can be calculated using the lower bound equation (TL) and the best-fit equation (TR) with values closely approximating each other, as seen in Figure 4 for T values approaching 0.
The magnitude of the seismic force specified in the regulations (ASCE, 2016; CEN, 2004) is generally calculated in proportion to the design seismic acceleration from the response spectrum (Sa). In structural design, the design load is considered equal to or greater than the possible loads. This is done to ensure that the structure can withstand at least until the designed building's lifespan. For this reason, the empirical formula for the structural vibration period should ideally be taken at the lower bound (TL) of Equation (29) to provide a smaller value for the structural vibration period, thus resulting in conservative seismic design force calculations.
5.4 Comparison with Empirical Formulas in Seismic Codes
A comparison of Equation (29) with the empirical formulas in ASCE7-16/SNI 1726-2019 and Eurocode 8 is presented in Figure 7. The comparison with ASCE7- 16/SNI 1726-2019 indicates that up to a height of 60 meters, the curve of the vibration period from Equation (29) lies below that of ASCE7-16, indicating that for the same building height (H), Equation (29) yields smaller vibration period (T). This aligns with the lower bound principle used in selecting this empirical formula.
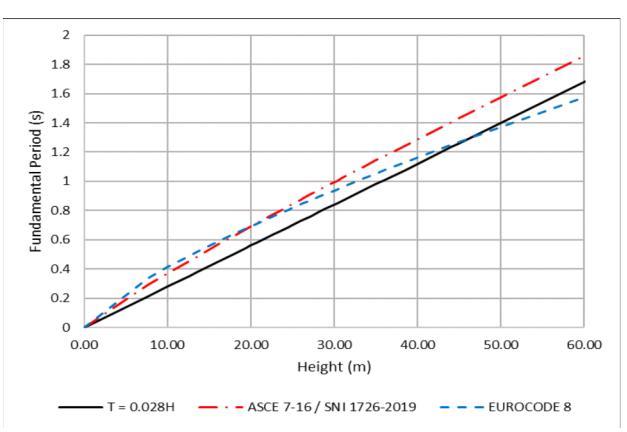
Figure 6. Acceleration response spectrum due to earthquake Figure 7. Comparison of the proposed empirical formula with the empirical formulas in seismic codes
The comparison of Equation (29) with the empirical formula for the structural vibration period in Eurocode 8 shows that Equation (29) yields smaller T values than Eurocode 8 for buildings with low heights up to approximately 47 meters. However, it should be noted that high-rise reinforced concrete buildings exceeding 50 meters generally employ dual systems with shear walls or other lateral force-resisting systems.
6. Conclusion
- 1. This study demonstrates that a linear equation can effectively approximate the empirical formula linking building height (H) or the number of floors (N) to the fundamental structural vibration period (T) with a good correlation. The equations developed in this study are valuable for quickly estimating the vibration period of building structures in Indonesia, particularly in areas with a PGA range of 0.3g to 0.6g.
- 2. The empirical formulas for the structural vibration period (T) derived from this study, as shown in Equations (29) and (32), provide the lower bound of the structural vibration periods for design purposes. Using the lower bound of the structure's vibration period results in a higher estimate of the earthquake load in the design, leading to a more conservative approach.
- 3. Comparison of the proposed empirical equation for the structural vibration period (T) from Equation (29) with ASCE7-16/SNI 1726-2019 and Eurocode 8 generally indicates that the curve of T values from Equation (29) lies below the curves of the empirical formulas in both codes. This result can serve as valuable input for the improvement of Indonesia's seismic design standard, helping to establish safer and more reliable design guidelines.
Acknowledgments
The authors express their sincere gratitude to MIDAS Information Technology Co., Ltd and PT. Midasindo Teknik Utama for providing the Midas Gen software license used in this research. Their support is deeply appreciated.