
Abstrak
Energi pasang surut merupakan salah satu sumber energi terbarukan yang dapat digunakan untuk mengurangi emisi karbon dari sektor energi di Indonesia. Banyak selat yang telah diteliti untuk energi arus pasang surut, namun beberapa selat di Perairan Indonesia bagian Barat belum pernah diteliti. Dalam penelitian ini dilakukan pemodelan numerik rata-rata kedalaman arus pasang surut yang bertujuan untuk menilai sumber daya energi arus pasang surut di Aroih Raya, Perairan Aceh, Pulau Sumatera. Pemodelan ini menggunakan perangkat lunak Delft3D-FLOW, yang ditentukan dengan batimetri GEBCO dan kondisi batas TPXO. Model mencapai validasi yang baik terhadap pengukuran elevasi pasang surut dan menghasilkan kemiripan kualitatif dengan deskripsi arus dalam buku navigasi. Hasil pemodelan menunjukkan bahwa aliran yang paling energik terletak di bagian bottleneck selat yang mengarah ke barat dan timur, dengan kecepatan aliran mencapai 2 m/detik pada kondisi pasang surut. Terdapat lima sel yang diidentifikasi sebagai lokasi potensial, turbin Sabelle D10 dipilih karena sesuai dengan kedalaman air dan karakteristik kecepatan arus. Proyeksi awal menunjukkan bahwa dengan 25 turbin di setiap sel, sumber daya teknis yang diproyeksikan adalah 4.993 MWh untuk periode tiga bulan. Secara keseluruhan, arus pasang surut ini mampu mengakomodasi 2,58% kebutuhan listrik di Aceh Besar pada tahun 2044.
Kata Kunci: Aroih raya, arus pasang surut, Delft3D, energi terbarukan laut, pemodelan hidrodinamika.
1. Introduction
The seventh goal of the Sustainable Development Goals (SDGs) is to ensure access to affordable, reliable, sustainable, and modern energy. Some of the ways to achieve this goal are by increasing people's access to clean and affordable energy while also decreasing their dependence on fossil fuels that produce high
* Penulis Korespondensi: mfthlchosyi@gmail.com
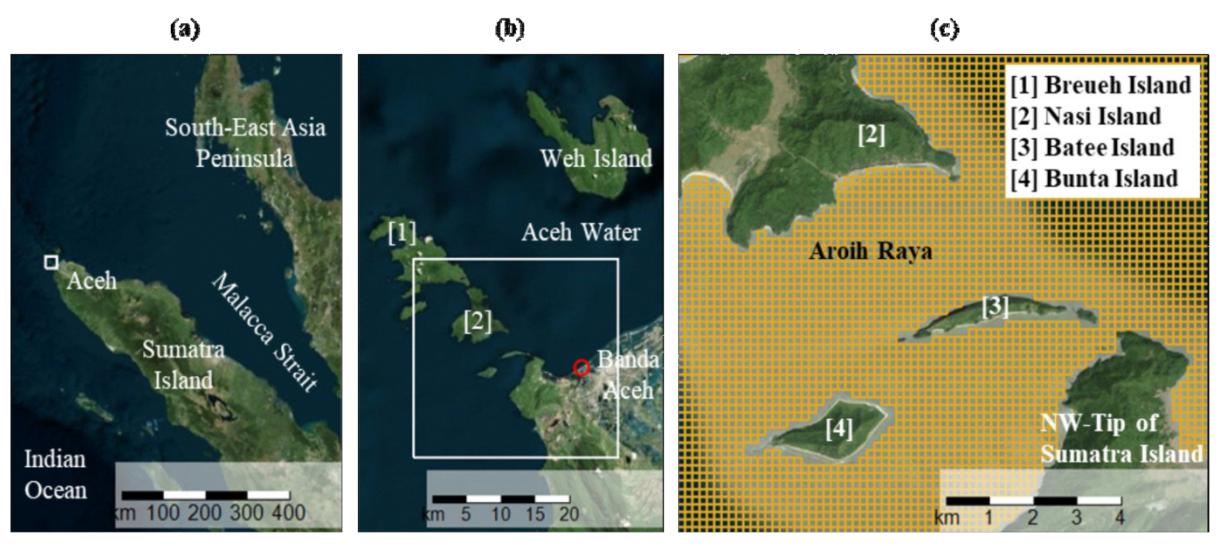
Figure 1. Overview of the study location: (a) position of Aceh, (b) domain of numerical modelling, and (c) Aroih Raya and surrounding islands. Basemap: Bing Aerial Map
carbon emissions. Therefore, the transition from nonrenewable to renewable energy is crucial. The demand for electrical energy increased significantly from 1990 to 2017, with electrical energy accounting for about 40% of the total energy used in 1990 and is expected to grow to 50% by 2030 (Chowdhury et al., 2021). Currently, fuels generated about 61.3% of total electricity generation worldwide (Kabeyi and Olanrewaju, 2022). In 2023, the highest percentage of the energy mix in Indonesia was still dominated by coal at 40.46%, petroleum at 30.18%, natural gas at 16.28%, and the remaining is from renewable energy at 13.09% (Kementerian Energi dan Sumber Daya Mineral, 2024). The use of renewable energy is only half the target, as by 2025, the contribution of renewable energy is planned to be as high as 23% (IRENA, 2017).
One of the alternatives for generating renewable energy is the tidal current. In tidal current energy, harvesting devices, i.e. tidal turbines or kites, are used to capture the kinetic energy of the moving water masses due to tidal propagation and later convert it to electricity. The advantages of this tidal stream energy are that it is predictable and less impacted by weather at the surface, compared to wave, wind, or solar energy. In Indonesian Waters, several straits have undergone detailed investigation on their tidal stream energy resource, such as Larantuka (Firdaus et al., 2020; Ajiwibowo and Pratama, 2017), Alas (Blunden et al., 2013), and Sunda Strait (Pratama et al., 2020). In addition, several straits also have been assessed, such as Bali, Lombok, Sape, Molo, Pantar, Capalulu, and Patinti Straits (ASELI, 2014; Kurniawan et al., 2024; Novico et al., 2021). These sites are located in the middle and eastern parts of Indonesia. Meanwhile, significantly fewer studies have investigated the western Indonesian Waters, such as the Malacca Strait and Aceh Waters (Lim and Koh, 2010).
This research aims to provide an initial assessment of the available power in the tidal stream at Aroih Raya, a strait located within Aceh Water, Indonesia. The particular objectives are to understand flow hydrodynamics and estimate the theoretical and technical powers at the selected potential sites. The assessment is carried out using depth-averaged tidal hydrodynamics modelling using Delft3D-FLOW. Similar studies have been conducted across a number of potential sites in Indonesian Waters (Firdaus et al., 2017; Pratama, 2020). However, the potential at Aceh Waters, including Aroih Raya, is still unknown. This investigation into Aroih Raya is motivated by the energetic flow speed reported in the navigation book (National Geospatial - Intelligence Agency, 2024), which is up to 5 knots or 2.57 m/s and features eddy flow.
2. Site Description: Aroih Raya
2.1 Study Location
The study area, Aroih Raya, is shown in Figure 1. It is situated at the Northwestern Tip of Sumatra Island and surrounded by three islands: Nasi Island from the north side, Batee and Bunta Islands from the south side. Aroih is a word in Acehnese that means channel/strait, and it is then used across this paper. The length and width of Aroih Raya are approximately 5-6 km and 3.4 km, respectively. This channel facilitates tidal propagation between the Indian Ocean and Malacca Strait, which later enters Karimata Strait and Natuna Sea. According to a navigation book (National Geospatial - Intelligence Agency, 2024), tidal currents in Aroih Raya are very strong, exceeding 2.5 m/s during spring tide conditions. At Aroih Raya, the current formed to its peak condition along the north coast of Batee Island. The documentation also includes an eddy and tidal whirlpool inside the strait, forming near the island (National Geospatial - Intelligence Agency, 2024). Aroih Raya is part of the Aceh Besar District; thus, in this study, electrical energy sourced from the tidal currents is planned to fulfil electricity needs in Aceh Besar District. Therefore, the estimated amount of energy generated by the tidal currents will
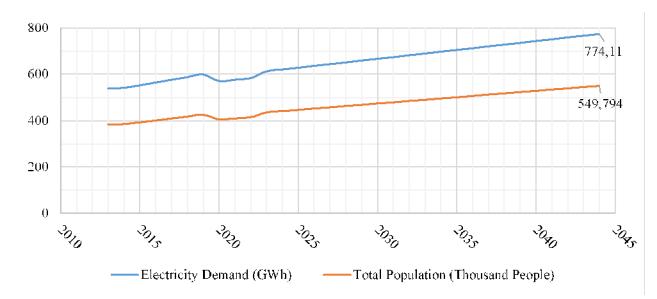
Figure 2. Projection of population and electricity demand for Aceh Besar District from 2013 to 2044
be compared against the electrical energy demands at Aceh Besar District.
2.2 Data sources
As this work was an initial assessment, this research fully depended on secondary data. Two types of data were collected that are electrical demand and hydrodynamic model supporting data. For estimating electrical demand, population data was obtained from BPS Kabupaten Aceh Besar (2024). For the construction of the model, various data were compiled, such as shoreline polygons, bathymetry, boundary conditions, and tidal observation. The shorelines were manually digitised from Google Maps. The bathymetry and boundary conditions were obtained using the Delft Dashboard (van Ormondt et al., 2020). The bathymetry was generated by interpolating GEBCO_2023 with a 15 arc-second resolution to the constructed grid (GEBCO Bathymetry Compilation Group, 2023). The boundary conditions were extracted from TPXO (Egbert and Erofeeva, 2002). Tidal observation at Ulee Lheue Station at Banda Aceh in June 2024 was used for model verification, which was measured by Badan Informasi Geospasial (BIG).
2.3 Population projection and electricity demand
Population projections are based on population censuses and include predictions of growth in the coming decades, taking into account births, deaths, and migration as the main components. There are three calculation methods used in this research, including arithmetic, geometric, and exponential methods. Then the method with the smallest standard deviation value is taken, which in this study is the arithmetic method. The arithmetic method is calculated by the Equation (1):
\[P_n = P_0 + [k_a (T_n - T_0)]\] (1)
where,
Pn = population in year n (people);
P0 = base year population (people);
Tn = year n (year);
T0 = base year (year); and ka= average population growth (people).
Furthermore, the projection of electrical energy demand in this study uses quantitative methods with a focus on historical data analysis and predictive. The research
process began with the collection of secondary data on per capita electricity consumption based on Kementerian Energi dan Sumber Daya Mineral (2024), which estimates per capita electricity demand of 1,408 kWh each year. The data is based on information on annual electricity consumption, population growth, and economic factors that affect energy demand. Thus, it is possible to analyse electricity consumption in Aceh Besar District by multiplying the population by the electricity demand per capita.
Population projections in Aceh Besar for the next 20 years are crucial in planning future electricity demand. Based on data from the Badan Pusat Statistik (BPS) the population has increased significantly from 2022. Using the arithmetic population projection method, it is estimated that by 2044 the population will increase to around 549,794 people. This growth indicates an increased demand for various services and energy resources. Based on an estimated per capita electricity consumption of 1,408 kWh, it can be estimated that by 2044 electricity demand will reach approximately 774.11 GWh. Figure 2 provides an overview of the increasing population and electricity demand of Aceh Besar District until 2044.
3. Methods
This study comprises of five stages. The first stage is data collection, where the relevant oceanographic, geospatial, electrical, and tidal turbine technology information are compiled. The second stage is analysis on electrical demand based on the population growth at Aceh Besar Regency. The third stage is the hydrodynamics modelling using the Delft3D-FLOW, this includes model meshing, parameterization, and validation. In the fourth stage, the output of the modelling is then used to identify potential sites and to select the suitable tidal turbine. In the final stages, the technical and practical powers are estimated for each potential sites.
3.1 Hydrodynamics modelling
The hydrodynamics modelling in this research was conducted using Delft3D-FLOW of the Delft3D-4 suite, an open-source tool developed by Deltares (Lesser et al., 2004). The Delft3D-FLOW is the core module for modelling hydrodynamics standalone or coupled with other features, such as waves, morphology, particle tracking, mixing, water quality, and other processes (Deltares, 2023).
The constructed model is depth-averaged and solely driven by tidal forcing, noting that meteorological forcing and flow three-dimensionality are still neglected. This approach is justified as it has shown a reliable result in a study with a similar purpose (Pratama et al., 2020). The model accuracy was validated by comparing the tidal data of the model and observation data by Badan Informasi Geospasial (BIG). The model's error was calculated using Pearson's correlation coefficients (r) and Root Mean Square Error
(RMSE) method, using the formula in Ajiwibowo and Pratama (2022).
The hydrodynamic simulation was run for three months, from June 2024 to August 2024, and this covered the period of tidal observation data. This simulation period excludes five days of spin-up time from a cold start condition. A rectangular grid in a spherical coordinate system was employed, as shown in Figure 1(c), with a resolution of 0.0015 degrees or about 167 m. The grid coverage is indicated by the white box in Figure 1(b), where the number of cells in the longitude and latitude axes are 197 and 167, respectively. Cells covering the land area were removed using the shoreline polygons. The bathymetry was then built by interpolating GEBCO_2023 dataset, which has a resolution of 15-arc second or around 450 m, coarser compared to the grid. The xyz samples are then interpolated into the grid using the triangular averaging method. The boundary conditions at all sides were prescribed with thirteen tidal elevation harmonics extracted from TPXO. The computational time step used was 30 seconds, with a maximum courant number of 33. A uniform 0.02 manning bottom roughness was used across the domain, except for the very rough bed near the open boundaries, to dampen any unstable jet that may be formed. The map output was in 30-minute intervals. The remaining parameters used the default setting in the Delft3D-FLOW (Deltares, 2023).
3.2 Instrument criteria and power analysis
Characteristics of the potential sites, i.e. water depth and flow speed, were used in the instrument selection and power calculation. The power is calculated using the methodology in Sustainable Energy Ireland (2004). Two categories of power calculations were used, namely the theoretical and technical powers. Theoretical power represents the gross mechanical energy contained throughout the water column. Meanwhile, technical power represents the power output that accounts for turbine specification (i.e., swept area, efficiency, and the number of turbines). The theoretical power was calculated using Equation (2), while the technical power that considers turbine limitation was estimated using Equation (3). Sustainable Energy Ireland (2004) provided a list of tidal turbine technologies, each of which was designed with distinct specifications, such as type, height, diameter, structure, cut-in speed, and rated speed. The selection of these turbines will be based on the characteristics of the potential sites, particularly their depth and current speed.
\[P_{Theo} = 0.5 \cdot \rho \cdot A \cdot v^3 \tag{2}\]
\[P_{Tec-Unit} = 0.5 \cdot \eta \cdot \rho \cdot A_{Swept} \cdot v^{3}\] (3)
\[P_{Tec\text{-}Tot} = 0.5 \cdot C \cdot \eta \cdot \rho \cdot A_{Swept} \cdot v^{3}\] (4)
where,
PTheo = theoretical Power (kW); ρ = seawater density (ton/m3);
A = cross-sectional area of water column (m2);
ν = depth-averaged current velocity (m/s);
PTec-Unit = technical power per unit turbine (kW);
η = turbine efficiency;
ASwept = turbine swept area (m2);
PTec-Tot = technical power per grid cell (kW); and
= amount of turbine.
4. Result and Discussion
4.1 Model validation
The model needs to be verified against field observation data to ensure the validity of the model output. In this study, the model was validated using tidal observation data measured by a BIG station (indicated by the red circle in Figure 1(b). The modelled data, observed data, and bathymetry are tied to the mean sea level, defined at an elevation of 0. The comparison of the modelled water level and the observed data shown in Figure 3 resulted in a correlation coefficient of 0.977 and an RMSE of 0.084 m, indicating a low error rate of this model. Normalised to the spring tidal range, the normalised RMSE is at 7%, satisfactory according to Evans, (1993). The time-series plot in Figure 3 shows that the model slightly underestimates the amplitude of high and low tides. Provided with more field data, this underestimation may be improved in further study by employing a larger domain and calibrating the bed roughness. These could enhance model reliability in water level and also in current velocity validation as demonstrated in Pratama et al. (2020).
4.2 Tidal characteristics
Characteristics of water level and current velocity during spring tide conditions at a point within Aroih Raya are described in Figure 4, each indicated with the blue and red lines, respectively. The tidal range at spring tide is 1.2 m, while at neap tide, it is around 0.5 m. Based on the time-series graph, the tidal is dominantly semi-diurnal, with two high and low tides daily. Consequently, the point also saw two cycles of eastward and westward velocity. The generated tidal current, which peaked at almost 2.0 m/s, is substantially high compared to other locations with similar tidal ranges, such as Sunda (Pratama et al., 2020) and Lepar Straits (Ajiwibowo and Pratama, 2022). These energetic flows are attributed to the positioning and geometry of Aroih Raya, which acts as a narrow and shallow conduit for tidal propagation between the Indian Ocean and Malacca Strait.
In Figure 4, four time points are marked with dashed lines A, B, C, and D, each indicating the timing for snapshots in Figure 5. The flow pattern is visualised in Figure 5, displaying the spatial flow speed distribution around Aroih Raya at maximum eastward (A and C) and westward currents (B and D) during spring tide. At these events, Aroih Raya acts similarly as a nozzle or inlet where water from larger basins (Indian Ocean and Malacca Strait) rushed into the strait, forming a jet-like flow pattern. The region with flow speed > 1.5 m/s spans across the strait, particularly at westward current conditions.
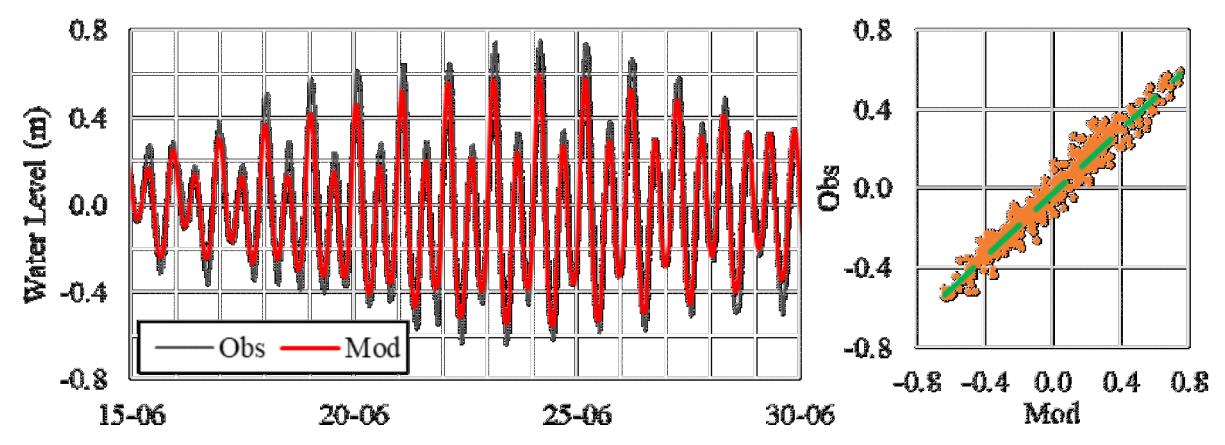
Figure 3. Comparison between the modelled (Mod in Red) and observed (Obs in Black) tidal elevation at Ulee Lheue Station, at Banda Aceh in (a) time-series and (b) scatter plot
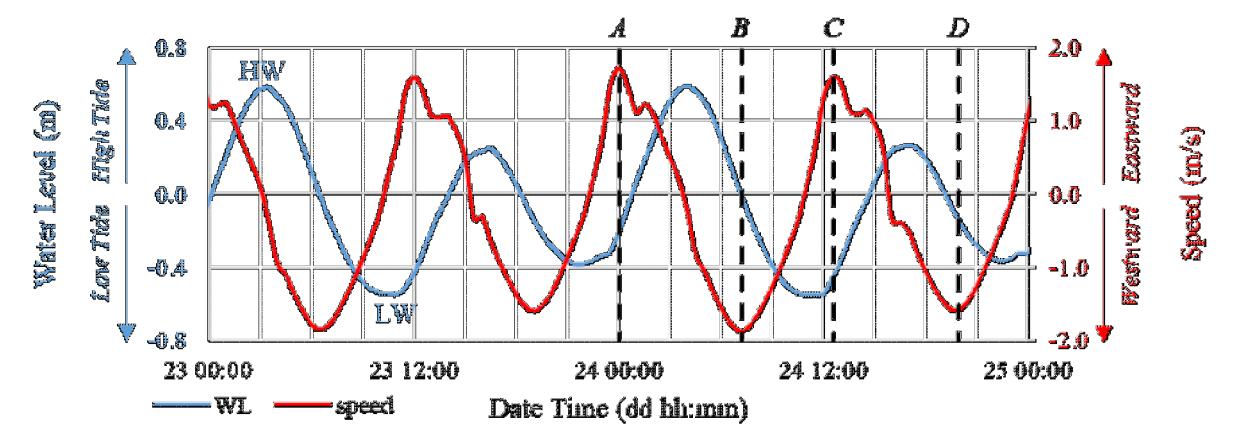
Figure 4. Water level and current velocity curves during two-days of spring tide at Aroih Raya. Four time points (A, B, C, D) are marked where the maximum flow field formed
Meanwhile, in eastward current conditions, the region with flow > 1.5 m/s is localised around the centreline of the strait. On the timing, the max eastward and westward currents occur two-three hours after the Low and High Water, respectively. Interestingly, two sites also show energetic flow, which are Aroih Lampuyang and Aroih Cut, with each located between Breueh and Nasi Islands and Batee and Sumatra Islands, respectively. However, the current model resolution needs to be refined to accurately capture the flow formation, which is not pursued here.
4.3 Potential sites analysis
The maximum (VMax) and average flow speed (VMean) were used to locate the most potential sites at Aroih Raya. Figures 6(a) and 6(b) show the spatial distribution of VMax and VMean within Aroih Raya. Further, Figure 7 provides a closer look at the location of the potential sites. Based on the VMax and VMean, five potential sites were identified, with details provided in Table 1. While the constructed model has 2D simplification and data scarcity, the value of maximum velocity (exceeding 2 m/s) and the region with the strongest flow (North of Batee Island) well align with records in the navigational information (National Geospatial - Intelligence Agency, 2024).
4.4 Power estimation
Based on the analysis of the modelling outputs, five potential sites were identified, as listed in Table 1. The theoretical resource (PTheo), which also means the total amount of kinetic energy contained in the moving water, is calculated using Equation (2) for each potential site. Table 2 displays the results of the theoretical resource calculation.
Further, the technical resources (PTec) is estimated using Equation (3) and (4). The technical resource is the power potential after considering the turbine specifications (i.e. swept area and efficiency) and the number of instruments.The characteristics of the five potential sites were used to define the selection criteria for the instruments. There are two criteria for the instrument to be suitable. The first is a minimum depth of 25 meters, considering a safe distance of 5 meters from the Mean Sea Level (MSL), the maximum height of the instrument is 20 meters. Further, based on the median current velocity value, the selected instrument has a cut-in-speed lower than 0.8 m/s. Four instruments were found to satisfy the desired device height and cutin-speed criteria, which are the Gorlov Helical Turbine (GHT), Open Hydro Turbine, Verdant KHPS, and
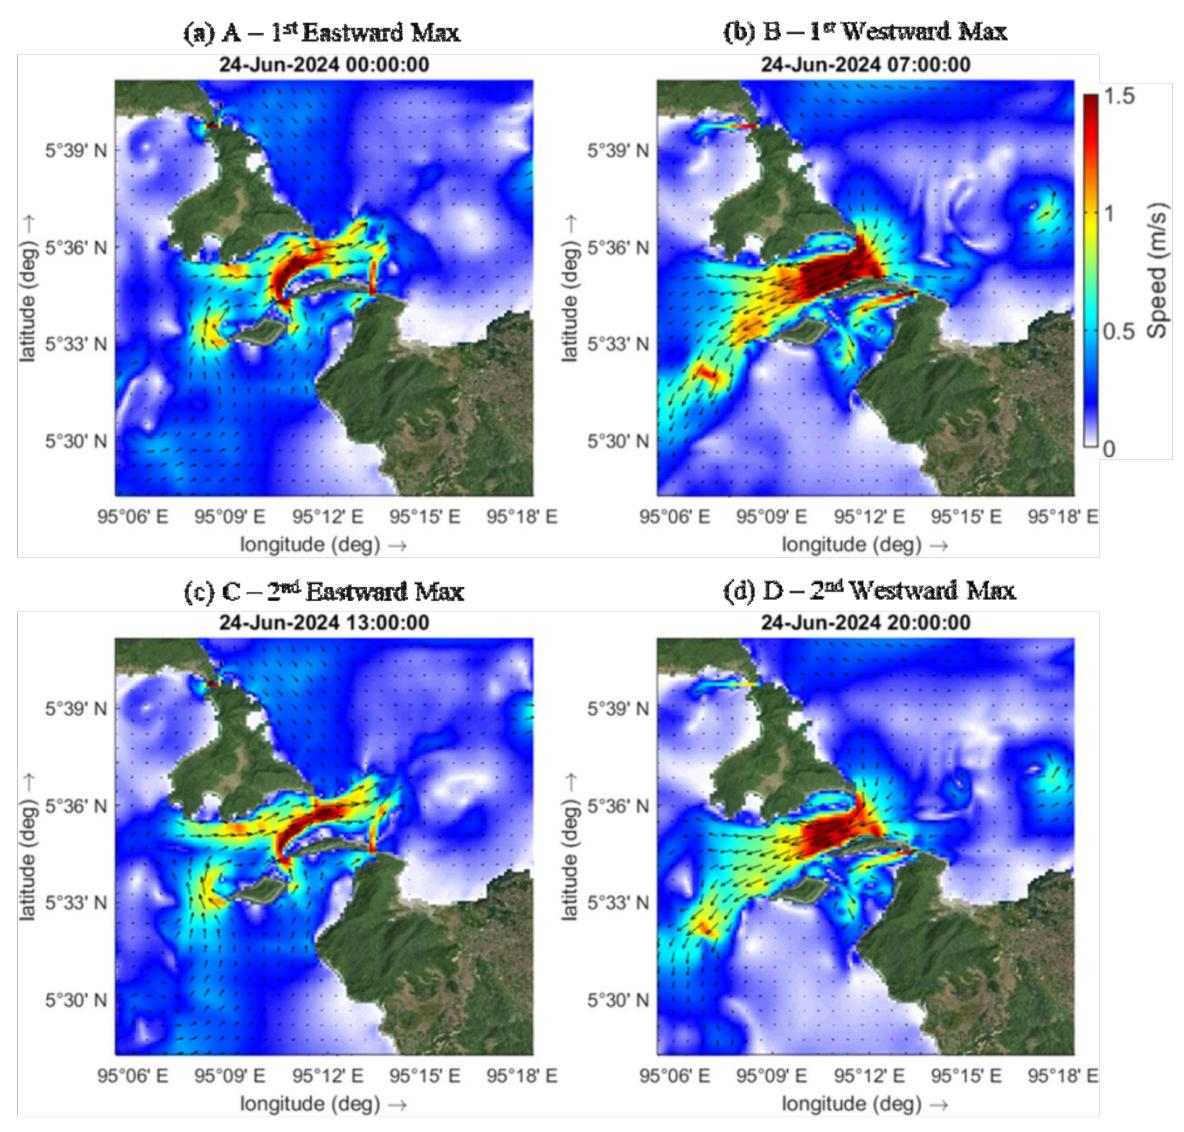
Figure 5. Snapshots of flow hydrodynamics at Aroih Raya during spring tide June 24th, 2024. Time points of A, B, C, D are indicated in Figure 4.
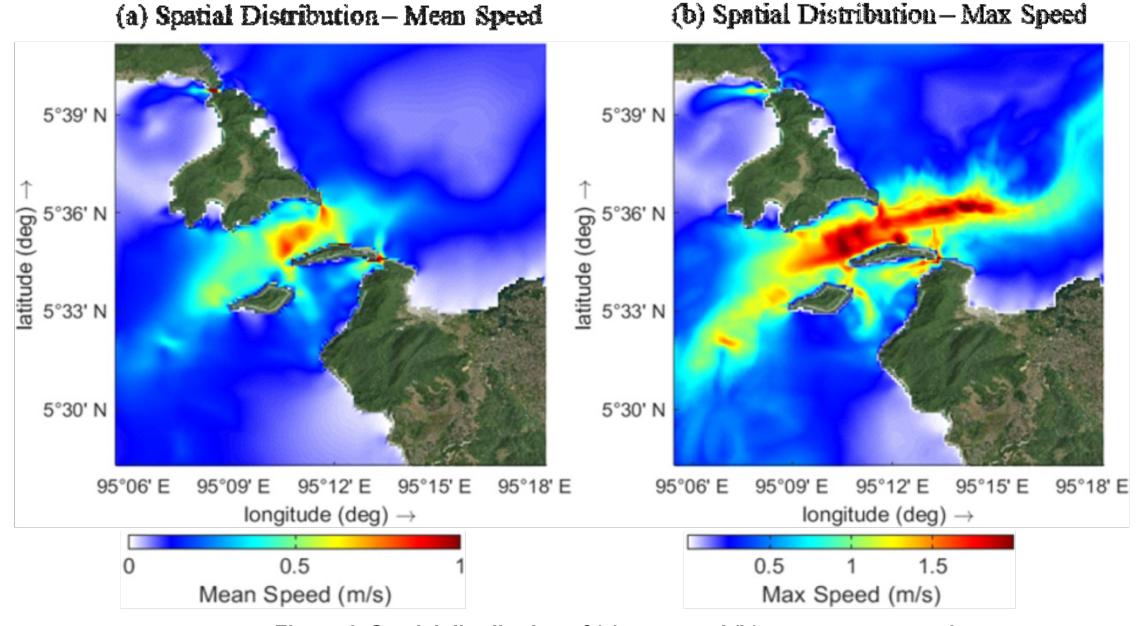
Figure 6. Spatial distribution of (a) mean and (b) max current speed
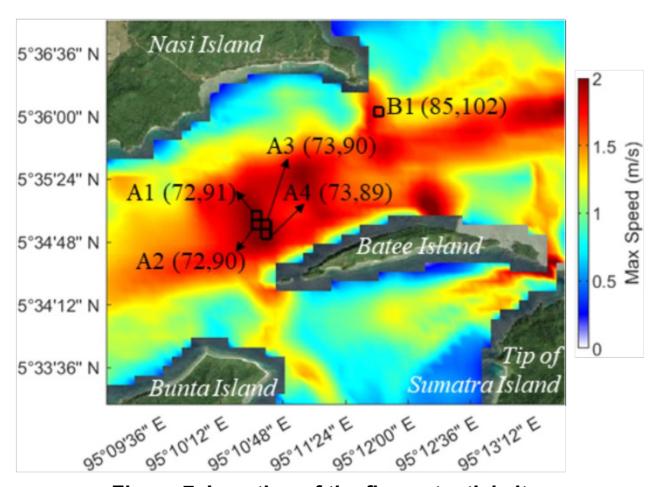
Figure 7. Location of the five potential sites
Table 1. Data summary for each observation point
| Code Depth (m) | Average velocity (m/s) | Maximum flow speed (m/s) | Median flow speed (m/s) | |
|---|---|---|---|---|
| A1 | 26.46 | 0.80 | 2,00 | 0.770 |
| A2 | 27.28 | 0.81 | 2.01 | 0.794 |
| A3 | 29.39 | 0.83 | 2.03 | 0.784 |
| A4 | 29.70 | 0.82 | 2.02 | 0.788 |
| B1 | 25.08 | 0.79 | 1.76 | 0.791 |
Table 2. Theoretical resource (PTheo) calculation for each potential site during June, July, and August 2024
| Sites | Median current speed (m/s) | Theoretical resources (MWh) |
|---|---|---|
| A1 | 0.770 | 5170.82 |
| A2 | 0.794 | 5712.69 |
| A3 | 0.784 | 5907.19 |
| A4 | 0.788 | 6111.85 |
| B1 | 0.791 | 3731.51 |
Table 3. Technical specifications of instruments for technical power calculation
| Parameter | Symbol | GHT | Open Hydro | Verdant KHPS | Sabelle Turbine | |
|---|---|---|---|---|---|---|
| Efficiency | ɳ | 0.315 | 0.394 | 0.361 | 0.447 | |
| Diameter | D | 1 m | 15 m | 5 m | 10 m | |
| Effective cross sectional area | A | 5 m2 | 176.71 m2 | 19.6 m2 | 78.54 m2 | |
Sabelle Turbine. Specifications of each turbine are provided in Table 3.
The calculated technical resources per unit (PTec-Unit) for each instrument at each site are given in Table 4, noted this value is calculated for June, July, and August 2024. Turbine capacity for each cell is estimated by assuming each turbine occupied a space of 3D (D = diameter/ length). This resulted in 121, 9, 121, and 25 devices per cell for GHT, Open Hydro, Verdant KHPS, and Sabelle Turbine, respectively. For GHT, a vertical axis turbine, the devices were assumed to be placed horizontally, thus having 5 m of length characteristics. As the dimension and swept area of Open Hydro are the largest, therefore it is expected that it produces the highest and followed by Sabelle, Verdant KHPS, and GHT, consecutively. Meanwhile, the order of capacity from low to high also follows the same manner. When considering per Cell, Site A2 with 25 Sabelle D10 devices resulted in 1,090.25 MWh over a three-month period. Overall, Sabelle D10 generate the highest , that is 4,993.75 MWh. However, this estimation is highly likely to be an overestimation since the flow reduction due to momentum loss induced by the energy extraction is still neglected.
Figure 8 shows the time-series graph of current velocity at one of the observation points, along with a red line indicating the cut-in speed for the Sabella D10 turbine, where the turbines will not generate power. The graph shows that the current at the observation point is dominantly above the cut in speed. Furthermore, Figure 9 shows the time-series graph of the technical resource at one of the observation points generated with the Sabella D10 Turbine. The greater the current velocity, the greater the power generated by a cubic.
Based on the total estimation for 3 months, the value is then extrapolated to the potential power that can be generated for 1 year (4,993.75 x 4 = 19,975 MWh). The estimated power generated with 125 units of the Sabelle 10 Turbine instrument reaches 19.97 GWh per year. Meanwhile, the electricity demand in Aceh Besar Regency in 2044 reached 774.11 GWh. This shows that tidal currents have the potential to fulfil 2.58% of the electricity demand in Aceh Besar District in 2044, making them a renewable and environmentally friendly source of energy.
Table 4. Technical resource calculation for four turbines from June to August 2024
| Sites | GHT L = 5 m Capacity = 121/cell | Open Hydro D = 15 m Capacity = 9/cell | Verdant KHPS D = 5 m Capacity = 121/cell | Sabelle D10 D = 10 m Capacity = 25/cell | ||||
|---|---|---|---|---|---|---|---|---|
| PTec-Unit (MWh) | PTec-Tot (MWh) | PTec-Unit (MWh) | PTec-Tot (MWh) | PTec-Unit (MWh) | PTec-Tot (MWh) | PTec-Unit (MWh) | PTec-Tot (MWh) | |
| A1 | 1.82 | 220.69 | 77.94 | 701.46 | 7.92 | 958.40 | 40.65 | 1016.25 |
| A2 | 1.96 | 236.79 | 83.85 | 754.65 | 8.52 | 1031.07 | 43.61 | 1090.25 |
| A3 | 1.88 | 227.11 | 80.37 | 723.33 | 8.17 | 988.29 | 41.83 | 1045.75 |
| A4 | 1.92 | 232.58 | 82.36 | 741.24 | 8.37 | 1012.72 | 42.84 | 1071.00 |
| B1 | 1.38 | 167.35 | 58.27 | 524.43 | 5.92 | 716.53 | 30.82 | 770.50 |
| Total | 605 units | 1084.52 | 45 units | 3445.11 | 605 units | 4707.01 | 125 units | 4993.75 |
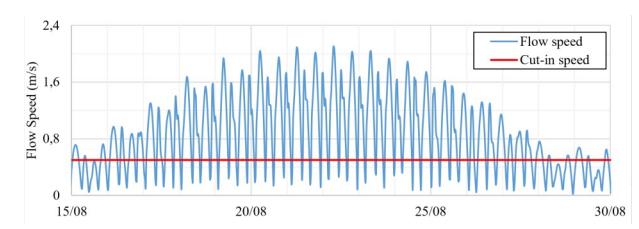
Figure 8. Time-series graph of flow speed at one of the observation points (A2), with a red line indicating the cut-in speed mark at 0.5 m/s for the Sabella D10 turbine
5. Conclusion
- 1. The numerical tidal flow hydrodynamics modelling presented in this study has shown the tidal current energy resources at Aroih Raya of Aceh Waters, Indonesia. Built upon open-source datasets, such as GEBCO_2023, this model resulted in a good validation against a tidal elevation measurement with a correlation coefficient of 0.977, an RMSE of 0.084 m, and an NRMSE of 7%. In addition, the velocity data output from the model agrees with the information in the navigation book.
- 2. The most energetic flow was found at the bottleneck of the strait, the north side of Batee Island. The maximum flow fields are presented in this paper, where at spring tide, the flow is evidently over 2 m/s despite a relatively small tidal range.
- 3. Five potential sites were identified, where, from June to August 2024, the theoretical resources at each site ranged between 3,731 – 6,111 MWh. Further, a preliminary assessment revealed that Sabelle D10 is the most suitable for implementation. Hypothetically, deploying 25 Sabelle turbines for each potential site generated a total of 4,993 MWh for three months.
- 4. This study is still in the preliminary stage, and the model needs a number of improvements, such as enhancing grid resolution and bathymetry quality (e.g. by using field measurement data or BIG's Batimetri Nasional dataset), and adding more forcing components (meteo-forcing and flow three -dimensionality). Furthermore, field measurement will be instrumental in ensuring the model's reliability.
Acknowledgements
The authors present gratitude to Deltares for providing the open-source tool and BIG for the water level data. The authors have no conflict of interest with any of the tidal turbine developers.