
Abstrak
Perusahaan kontraktor kualifikasi kecil dan menengah di Indonesia menghadapi keterbatasan dalam mengukur kinerja, yang umumnya hanya berfokus pada aspek keuangan dan belum memiliki sistem pengukuran yang terstruktur. Penelitian ini bertujuan untuk mengidentifikasi indikator kinerja utama yang relevan bagi kontraktor kecil dan menengah sebagai tahap awal penyusunan sistem pengukuran kinerja berbasis Balanced Scorecard. Data penelitian diperoleh melalui kuesioner yang disebarkan kepada 28 responden dari 20 perusahaan kontraktor di Kota Bandung. Metode analisis yang digunakan meliputi uji komparatif untuk memastikan konsistensi persepsi, analisis statistik untuk menilai relevansi dan kesepakatan responden, serta Relative Importance Index (RII) untuk memeringkat indikator berdasarkan tingkat kepentingannya. Hasil penelitian menunjukkan bahwa terdapat 20 indikator yang dinilai relevan, mencakup keempat perspektif Balanced Scorecard: keuangan, pelanggan, proses bisnis internal, serta pembelajaran dan pertumbuhan. Indikator dengan peringkat tertinggi antara lain kualitas pelayanan, retensi pelanggan, ketepatan waktu penyelesaian proyek, dan citra perusahaan. Temuan ini memberikan dasar awal bagi pengembangan sistem pengukuran kinerja yang lebih komprehensif, sekaligus membuka ruang bagi penelitian lanjutan untuk validasi dengan cakupan responden yang lebih luas serta implementasi praktis di perusahaan kontraktor kecil dan menengah.
Kata-kata Kunci: Balanced scorecard, indikator kinerja utama, kontraktor kualifikasi kecil dan menengah
* Penulis Korespondensi: imafatima.if@gmail.com
1. Introduction
The Government of Indonesia is currently focusing on efforts to increase investment—both public and private—in order to accelerate the country's economic expansion. industry as its main executor. According to the Construction in Figures 2023 report published by Statistics Indonesia (Badan Pusat Statistik/BPS), the construction sector contributed 9.86% to Indonesia's Gross Domestic Product (GDP) in the third quarter of 2023 (Badan Pusat Statistik (BPS), 2023).
The construction industry encompasses all parties involved in the construction process, including professional workers, construction contractors, and suppliers who collectively fulfill the industry's needs (Hillebrandt, 1985). One of the key players in this industry is the contractor company, which acts as the construction executor. In 2022, there were 197,030 contractors operating in Indonesia—an increase of 50.85% over a ten-year span compared to 130,615 contractors in 2012 (BPS, 2023). Contractor companies in Indonesia are categorized into several business qualifications, as defined by Government Regulation No. 5 of 2021. These qualifications are grouped into small, medium, and large based on financial capacity, annual sales, expert workforce, and construction equipment.
According to the Construction in Figures 2023 report, the contractor industry in Indonesia is predominantly composed of small and mediumqualified firms. Out of 197,030 contractors, 75.34% were classified as small-scale enterprises, 13.74% as medium-scale, 1.02% as large-scale, and the remaining 9.9% were non-classified. A similar distribution is also observed in West Java Province and Bandung City. Of the 1,149 contractor companies registered in Bandung City, 98.26% are classified as small and medium enterprises (Badan Pusat Statistik (BPS), 2022).
The high number of contractor companies has led to increasingly intense competition to secure construction projects. This competition requires companies to maintain strong organizational performance. Performance is defined as the outcome of work accomplished by individuals or groups within an organization, in accordance with their respective roles and responsibilities, and aligned with the organization's goals, legal norms, and ethical standards (Prawirosentono, 1999). The performance of a company is one of the key indicators of its effectiveness and efficiency in achieving its objectives.
A contractor company's performance can be assessed through a structured performance measurement system. Large contractor companies generally have established systems in place to monitor their performance. However, small and medium-sized contractors often rely solely on financial metrics, such as revenue within a certain period, to evaluate performance (Pangestu, 2020). This is concerning, considering that the number of small and medium contractors significantly exceeds that of large ones.
Small and medium contractors face several challenges in measuring their performance, stemming from both internal and external factors. First, many lack adequate management systems. Unlike large firms, small and medium contractors often do not have clear goals or strategic plans. Second, these companies struggle to keep pace with the rapid changes occurring within the construction industry. Third, they frequently operate with limited human resources, given their small workforce. As a result, many of these firms measure performance solely based on financial outcomes—or in some cases, do not conduct performance measurement at all. Furthermore, there is no standardized performance measurement framework tailored specifically for small and medium contractors, unlike those available to large firms (D. Kim et al., 2021).
According to Husaini (2013) in Abidin (2023), the market segment dominated by small and medium contractors is not proportional to the number of companies competing within it. This imbalance has resulted in a highly competitive and even distorted market environment, leading many small and medium firms to exit the industry (Ervianto, 2005). Nugraheni et al. (2021) argue that Indonesia's construction industry has the potential to grow further, provided that the sector's performance, comparative advantages, and competitive strengths are better understood. To improve the competitiveness of the sector, a well-designed strategic framework is required.
In light of the above, it is evident that there is a lack of performance measurement systems specifically tailored to small and medium-qualified contractors. Therefore, there is a need to develop such systems in order to provide a structured and comprehensive framework for assessing their performance. This study does not yet propose a complete performance measurement system; rather, it serves as the initial stage of that development. The focus of this research is on identifying the key performance indicators (KPIs) that are most relevant to small and mediumqualified contractor companies. The use of the Balanced Scorecard approach provides a foundation for such a system, and the identification of these indicators represents a necessary first step toward the eventual design and implementation of a comprehensive performance measurement framework.
2. Literature Review
2.1. Construction industry and contractor company
According to Law No. 2 of 2017 on Construction Services in Indonesia, construction services are defined as consultancy services and/or construction works. These services include design consultancy, construction implementation, and construction supervision. The types of construction service businesses, as outlined in the same regulation, comprise construction consultancy services, construction works, and integrated construction works. Construction consultancy involves all or part of the activities such as feasibility studies, planning, design, supervision, and management of a construction project.
Functionally, there are three main parties involved in a construction project: the project owner, the consultant, and the contractor. In general, construction companies in Indonesia are categorized into construction implementers (contractors) and planning or supervision service providers (consultants). A contractor is a person or legal entity that undertakes and executes construction work according to predetermined costs, based on design drawings, regulations, and contractual terms. Meanwhile, consulting firms can be divided into two main categories: design consultants and supervision consultants. Design consultants may further be classified by specialization, such as architecture, civil engineering, mechanical and electrical engineering, among others.
2.2. Small and medium-scale contractor
Issues related to the management of small-scale contractor companies were discussed in a study by Kim D. Kim et al. (2021). Management difficulties faced by small-scale construction companies stem from both internal and external factors. The first issue lies in the absence of adequate management control systems. Large-scale contractor companies generally analyze the characteristics of their internal management, external environment, and internal capabilities using proper management control systems, which allow them to establish strategies and business plans aligned with the nature of the company. Subsequently, company performance is measured to evaluate the achievement of organizational objectives. In contrast, small-scale contractors are often unable to identify the root causes of their internal problems due to the lack of management control systems and the inability to measure management performance effectively.
The second issue is the difficulty faced by smallscale contractors in responding to and coping with changes in their external environment. Due to their limited management control, small-scale contractors struggle to adapt to the fast-paced and highly uncertain construction industry and are generally
unprepared to handle sudden changes. The third issue is the poorly organized structure of small-scale construction companies. Unlike large contractors, small-scale companies often lack proper organizational structure due to limited staffing and inadequate management capabilities.
2.3. Company performance measurement
Companies must carry out performance measurement, and management needs a sustainable performance measurement system to translate the organization's mission and strategy into key objectives and measurable benchmarks. The most commonly used performance assessment method in companies today is the traditional approach. This traditional system focuses on measuring performance based on budgeting and profit, thereby making company strategies heavily reliant on financial figures. The advantage of this approach lies in its simplicity and ease of application, even for small businesses. However, it is not oriented toward long-term goals and is incapable of capturing intangible assets or intellectual capital (Sucahyo & Ardyanfitri, 2021).
The traditional financial-based performance measurement approach is no longer sufficient to meet current performance assessment needs, especially amid the increasing pace of business competition (Arifin & Marwan, 2023). Traditional approaches fail to provide insight into future strategies or actions that could improve company performance. While this method was effective in the industrial era, it is no longer relevant for the skills and competencies that modern organizations aim to develop (Kaplan & Norton, 2007). To address these limitations, performance measurement can be conducted using the Balanced Scorecard approach, which evaluates performance from multiple perspectives, thereby overcoming the weaknesses of the traditional system.
Performance measurement should not rely solely on a single perspective—financial or operational. There needs to be a proportional balance between financial and operational dimensions. The Balanced Scorecard model includes financial performance metrics, which serve as retrospective evaluations of implemented management strategies. Furthermore, financial perspectives are complemented by operational perspectives, which are detailed into customer perspective, internal business process perspective, and learning and growth perspective. The Balanced Scorecard translates organizational objectives and vision into measurable outcomes.
One of the key advantages of the Balanced Scorecard in strategic planning is its ability to produce strategic plans that are comprehensive, coherent, balanced, and measurable. According to Hidayat (2016) in Sucahyo & Ardyanfitri (2021), the Balanced
Scorecard offers several benefits: it facilitates the classification and consensus building around corporate strategies, communicates strategies throughout the organization, enables periodic and systematic strategic review, identifies and aligns strategic initiatives, synchronizes strategic goals with long-term plans and annual budgets, and provides feedback necessary for strategic learning and improvement.
2.4. Performance indicators
Lubis & Kusumanto (2018) define key performance indicators (KPIs) as management tools that allow activities or processes to be monitored, controlled (to detect and correct deviations), and ensured to meet the desired performance outcomes. KPIs compare actual implementation with pre-established plans. Successful implementation depends on the alignment of strategy execution with the predetermined maintenance plans. Effective performance indicators must meet the criteria of being specific, objectively measurable, accurate, relevant, and time-bound (Surat Edaran Sekretaris Kementerian BUMN No. S-08/S.MBU/2013, 2013).
According to the Business Excellence Performance Assessment Criteria (KPKU) outlined in the circular, there are five main perspectives in business performance measurement: product and process effectiveness, customer focus, financial and market performance, workforce focus, and leadership, governance, and social responsibility. Although KPKU does not explicitly adopt the balanced scorecard approach, its performance indicators can be adapted and aligned with the perspectives of the balanced scorecard, i.e., financial perspective, customer perspective, internal business process perspective, and learning and growth perspective.
The Management Performance Evaluation Indicators (MAPEIs) model developed by M. K. Kim (2010), as cited in D. Kim et al. (2021), also employs a modified balanced scorecard approach to evaluate the performance of large-scale contractors in South Korea. The primary difference lies in the initial classification, where performance indicators are first grouped into performance categories before being assigned to the four main perspectives of the balanced scorecard. In Indonesia, a study by Kuncoro (2017) identified performance indicators for contractors, design consultants, and supervision consultants in the Malang Raya area. Additionally, a study by Irmansyah & Deviyanti (2021) employed a balanced scorecard approach combined with the Analytic Hierarchy Process (AHP) method to evaluate company performance and calculate weighted scores based on indicator prioritization.
Although research on performance measurement in construction companies using the balanced scorecard approach remains limited, this approach
has been widely applied in other industries. Examples include research by Dinçer et al. (2017) in the European aviation industry, Quezada et al. (2019) in the manufacturing sector, and Kurniadi et al. (2022) in Indonesia's livestock industry. While the performance indicators used in these studies may not be directly applicable to the construction industry, they can be adapted to suit the context of contractor performance assessment.
3. Research Methodology
3.1. Data collection method
The purpose of the data collection in this study was to identify and validate performance indicators that are relevant for small and medium-scale contractor companies, which will serve as the foundation for developing a performance measurement system. To achieve this, both secondary and primary data were collected.
The secondary data were obtained from a literature review of previous studies on performance indicators applied in construction companies in Indonesia and other countries using the Balanced Scorecard approach. The Balanced Scorecard was not used as a literature review tool itself, but as a guiding framework to classify and select indicators from existing studies. In addition, performance indicators from state-owned contractor companies (BUMN), as outlined in the Circular Letter of the Secretary of the Ministry of State-Owned Enterprises No. S-08/S.MBU/2013, were also reviewed. These indicators were compiled and synthesized to form a pool of potential variables. The findings from the literature review were then incorporated into the design of the research questionnaire, ensuring that the questionnaire items reflected a wide range of indicators previously recognized in both academic and practical contexts.
The primary data were collected through a questionnaire distributed to small and medium-scale contractor companies located in Bandung City. The questionnaire asked respondents to assess the relevance of each performance indicator variable to the characteristics of their companies using a fivepoint Likert scale.
This research was conducted on small and mediumscale contractor companies as classified under the existing qualification criteria set by Government Regulation No. 5/2021 and the Construction Services Development Board (LPJK), which categorize contractors based on financial capacity, annual turnover, workforce, and equipment ownership. The focus on Bandung was chosen as a case study area to provide a more contextual and practical scope for analysis, while still representing the challenges commonly faced by small and medium contractors in Indonesia.
Respondents were experts and practitioners directly working in small and medium-scale contractor companies. They included individuals responsible for executing construction work, managing resources (labor, time, and cost), and overseeing company management. To ensure comprehensive perspectives, respondents consisted of company leaders (owners, directors, and managers such as marketing, technical, HR, financial, and project managers) as well as staff members. All respondents were selected specifically from small and medium contractor firms, not from the construction industry in general, to ensure alignment with the research objectives.
3.2. Identification of performance indicators from literature
Performance indicators were identified by referring to relevant indicators obtained from previous studies (Kim, 2010; Irmansyah & Deviyanti, 2021; Dinçer et al., 2017; Quezada et al., 2019; Kurniadi et al., 2022; Kementerian BUMN, 2013). A list of potential indicators was then compiled for validation to determine the most important indicators suitable for use in measuring the performance of small and medium-sized construction companies.
The following tables shows the recapitulation of indicators for each of four perspectives used in the balanced score card approach, i.e., financial (Table 1), customer (Table 2), internal business process (Table 3), and learning and growth (Table 4).
Table 1. Financial perspective
| Deufermen en la dicetera | Source *) | |||||||
|---|---|---|---|---|---|---|---|---|
| Performance Indicate | ors | Description | 1 | 2 | 3 | 4 | 5 | 6 |
| Return on Invested Capital (ROIC) | Δ1 Rose Net oper acting projet after tax | |||||||
| ordinary profit | A2 | Operating profit plus non-operating balance | V | |||||
| Domestic Income Growth | А3 | Increase in revenue within a certain time period for domestic activities | √ | √ | ||||
| Debt Ratio | A4 | \(debt\ ratio = \frac{total\ debt}{total\ assets}\) | \(\sqrt{}\) | V | √ | |||
| Net Worth | A5 | \[total\ assets-total\ liabilities\] | \(\sqrt{}\) | |||||
| Return on equity (ROE) | A6 | \[ROE = \frac{net \ profit}{capital}\] | \(\sqrt{}\) | V | V | V | ||
| Return on asset (ROA) | A7 | \(ROA = \frac{net\ profit}{total\ assets}\) | √ | √ | √ | |||
| Current Ratio | A8 | \[current\ ratio = \frac{current\ assets}{current\ liabilities}\] | V | |||||
Table 2. Customer perspective
| Performance Indicators | Description | Source *) | ||||||
|---|---|---|---|---|---|---|---|---|
| Description | 3 | 4 | 5 | 6 | ||||
| Awards from competition | B1 | Customers' views on awards received by a company from competition | √ | √ | ||||
| Customer satisfaction | B2 | Overall assessment of service and as a result of comparison between customer expectations and perceptions of actual service performance | V | √ | V | √ | ||
| Corporate image | В3 | Perceptions, impressions, and feelings formed in the minds of customers about a company | V | √ | ||||
| Social contribution | B4 | Payments made by a company for the benefit of its employees to insurance companies and social benefits provided directly by the company to its employees, former employees, and other eligible persons | V | |||||
| Work environment and company culture | B5 | Environmental conditions that influence the formation of a person's behavior at work as well as the values, beliefs, and behaviors that determine how employees and company management interact, conduct, and handle business transactions. | V | √ | √ | |||
| Domestic market share | В6 | \[\frac{company\ revenue}{total\ industry\ revenue} \times 100\%\] | V | |||||
| Number of new customers | В7 | An entity that has not previously purchased a good or service, but has now purchased the good or service | √ | ١ | 1 | V | |
|---|---|---|---|---|---|---|---|
| Customer retention | В8 | The ability of a company to get customers to return to buy or use its services and not switch to competitors | √ | ١ | √ . | V V | |
| Number of customer complaints | В9 | The amount of negative feedback consumers give about a company's products, services, or support experiences | V | V | |||
| Service quality | B10 | The level of excellence a company provides to consumers/customers or service recipients | V | √ |
Table 3. Internal business process perspective
| Performance Indicators | 2 | S | our | urce *) | ||||
|---|---|---|---|---|---|---|---|---|
| Description | 3 | 4 | 5 | 6 | ||||
| Research and development costs | C1 services and intellectual property resulting from the development | √ | ||||||
| Ownership of intellectual property rights | C2 | Ownership of the right to obtain legal protection for intellectual property, in accordance with laws and regulations | ||||||
| Selling and administrative expenses to revenue | C3 | Costs incurred by the company to promote, sell and deliver its products and services, and to manage day-to-day operations | V | |||||
| Compliance with guidelines or regulations | C4 | Compliance of the company with laws, regulations, standards, guidelines, and specifications set by the government, institutions, associations, and other bodies | 1 | |||||
| Accident rates | C5 | The number of work accidents in a certain time period | V | V | ||||
| Reuse and recycling of waste | C6 | The number of waste reuse and recycling activities in the company's operations and projects being worked on | √ | |||||
| Number of projects | C7 | The number of projects worked on by the company in a certain time period | 1 | |||||
| Timeliness of project completion | C8 | Comparison of actual project completion time to project completion plan | √ | |||||
| Project value | C9 | The value of projects completed by the company in a certain time period | √ | √ | ||||
Table 4. Learning and growth perspective
| Performance Indicators | December | Source ' | ||||||||
|---|---|---|---|---|---|---|---|---|---|---|
| Description | 2 | 3 | 4 | 5 | 6 | |||||
| Training cost per employee | Costs incurred by the company to improve employee skills | √ | ||||||||
| Internship satisfaction | D2 | D2 Attitudes, beliefs, emotional responses of interns to their internship work | √ | |||||||
| Knowledge sharing | D3 | Methods or activities in knowledge management used to provide and disseminate knowledge, ideas, experiences, or skills from a person, department, organization, agency, or company to create a basis for cooperation | V | V | ||||||
| Employee productivity | D4 | The amount of work that can be completed by an employee in a certain period of time | √ | √ | √ | |||||
| Employee training time | D5 | The amount of time the company provides for employee training | V | |||||||
| Number of suggestions | D6 | The number of suggestions or input received by the company | V | √ | ||||||
| Number of absenteeism | D7 | The number of employees who are absent from work unplanned and without clear reasons | 1 | √ | ||||||
| Turnover rate | D8 | The percentage of employees who leave a company in a certain period of time | 1 | √ | ||||||
Source: 1 (Kim, 2010); 2 (Irmansyah & Deviyanti, 2021); 3 (Dinçer et al., 2017); 4 (Quezada et al., 2019); 5 (Kurniadi etal., 2022); 6 (Kementerian BUMN, 2013)
3.3. Research Analysis Method
3.3.1. Comparative test
Based on the results of primary data collection using questionnaires, the data were tabulated in the form of respondents assessments of performance indicator variables relevant to the characteristics of small and medium-scale contractors. The tabulated data were then processed using independent sample tests to identify the influence of differences in educational background, job position, and company qualification on the respondents' answers. Comparative tests were conducted using the Mann–Whitney test for comparing two independent samples, and the Kruskal–Wallis test for comparing three or more independent samples.
- 1. Kruskal–Wallis test based on education level: Diploma or below, Bachelor's degree (S1), Postgraduate (Master's degree/S2)
- 2. Kruskal–Wallis test based on job position: Owner, Director, Manager/Project Manager, Staff
- 3. Mann–Whitney test based on company qualification: Small and Medium-scale
The comparative test (Mann–Whitney and Kruskal– Wallis) was used to examine whether differences in respondents' backgrounds—such as education level, job position, and company qualification significantly influenced their responses to the questionnaire. The purpose was to ensure that the selected indicators reflected a consensus across respondent groups. Indicators that showed inconsistent perceptions among groups were excluded from further analysis.
3.3.2. Statistical analysis
The data obtained from respondents who filled out the questionnaire consisted of ratings from 1 to 5 for each variable, reflecting their perception of the relevance of each performance indicator variable to the characteristics of small and medium-scale contractors. These ratings were then averaged to obtain the relevance level of each variable. All respondents were assumed to have equal weight in their responses, so no weighting was applied in calculating the average score of each respondent. The average score was then used to determine the grouping of each variable's relevance level according to the distribution of the ratings. The average score used to determine the classification of the variables' relevance level was based on the Table 5 below.
Another parameter to consider is the variation in respondents' answers, represented by the standard deviation. This standard deviation is then used to calculate the Coefficient of Variation (CV), where :
\[CV = \frac{Standard\ deviation}{mean} \times 100\%.\]
Table 5. Distribution of relevance group based on average
| Mean | Relevance group |
|---|---|
| [1-1,8) | Very Irrelevant |
| [1,8-2,6) | Fairly Irrelevant |
| [2,6-3,4) | Slightly Irrelevant |
| [3,4-4,2) | Fairly Relevant |
| [4,2-5) | Very Relevant |
A high CV indicates that respondents' answers vary widely and not all agree on a specific score. A low CV indicates that responses tend to cluster around the mean value. Therefore, a variable is considered relevant not only if it has a high average score (greater than 3.4) but also if it has a low coefficient of variation (less than 20%). A low CV indicates that respondents share a similar perception of a variable's relevance. These two criteria reflect that a variable is sufficiently relevant to the characteristics of small and medium-scale contractors and that the relevance ratings were agreed upon by the respondents, as indicated by the low variation in responses.
3.3.3. Relative importance index
The Relative Importance Index (RII) is a method used to analyze the most influential or relevant factors within the research subject. This analytical method processes statistical calculations using questionnaire responses as input, which are subsequently processed to become key performance indicators for small and medium-scale contractors. The RII identifies the most influential factors through a ranking system based on the weighted scores given by respondents after completing the research questionnaire. The RII values range between 0 and 1 (excluding 0). The highest RII score indicates the most decisive variable in the study.
The RII method was employed to rank the indicators that had passed the previous tests. This ranking identified the most important indicators from the perspective of practitioners in small and mediumscale contractor companies. The output of this stage was a prioritized list of key performance indicators (KPIs). The RII was calculated using the following formula:
\[RII = \frac{\sum W}{A \times N}\]
- W: weight assigned to each indikator by respondents
- A: the highest possible weight (5)
- N: total number of respondents
In summary, these three analyses formed a systematic filtering process. The comparative test confirmed the consistency of responses across different respondent groups, the statistical analysis established both the relevance level and the degree of consensus among respondents, and the RII provided a ranking of the final set of indicators. Together, these analyses contributed to the main objective of this study: to identify and prioritize performance indicators as the first step toward developing a performance measurement system for small and medium-scale contractors.
4. Data and Analysis
4.1. Respondent profile and data description
The respondents in this study comprised company
leaders (Owners, Directors, or Managers/Project Managers) as well as employees from small and medium-scale contractor companies in Bandung City. The leaders were selected because they are considered to have a comprehensive understanding of the company's performance conditions. Meanwhile, employees were chosen to provide perspectives from personnel who work directly in the field and maintain direct contact with clients. The questionnaire was completed by 28 respondents from 20 different contractor companies. The distribution of respondents based on education, position, and the qualification of their respective companies in Figure 1 below.
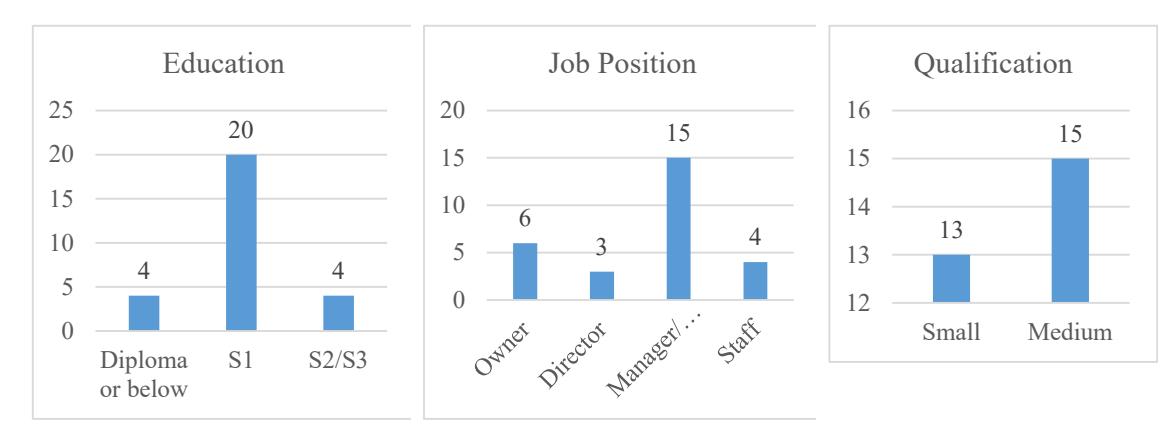
Figure 1. Distribution of research respondents
4.2. Results of Data Analysis
Table 6. Data processing results (comparative test, validity test, statistical analysis, RII)
| Comparative (Sig) | Statistical analysis | ||||||||
|---|---|---|---|---|---|---|---|---|---|
| Perspective | Var | CT1 | CT2 | CT3 | Mean | CV | Rmks | RII | Rank |
| A1 | 0,438 | 0,963 | 0,055 | 3,857 | 19,6% | P | 0,7714 | 17 | |
| A2 | 0,798 | 0,194 | 0,004* | 3,536 | 29,3%* | F | - | - | |
| A3 | 0,062 | 0,366 | 0,052 | 4,071 | 18,8% | P | 0,8143 | 14 | |
| A4 | 0,05 | 0,542 | 0,023* | 3,607 | 25,2%* | F | - | - | |
| Financial | A5 | 0,335 | 0,292 | 0,125 | 3,964 | 20,0% | P | 0,7929 | 15 |
| A6 | 0,078 | 0,165 | 0,557 | 3,964 | 17,5% | P | 0,7929 | 15 | |
| A7 | 0,757 | 0,109 | 0,006* | 3,536 | 27,2%* | F | - | - | |
| A8 | 0,052 | 0,691 | 0,172 | 4,179 | 19,6% | P | 0,8357 | 9 | |
| B1 | 0,069 | 0,462 | 0,593 | 3,893 | 23,5%* | F | - | - | |
| Customer | B2 | 0,474 | 0,671 | 0,177 | 4,107 | 16,7% | P | 0,8214 | 12 |
| B3 | 0,058 | 0,805 | 0,204 | 4,357 | 15,6% | P | 0,8714 | 3 |
| B4 | 0,118 | 0,891 | 0,640 | 4,179 | 19,6% | P | 0,8357 | 9 | |
| B5 | 0,093 | 0,578 | 0,023* | 4,179 | 17,3% | F | - | - | |
| B6 | 0,091 | 0,095 | 0,125 | 3,857 | 19,6% | P | 0,7714 | 17 | |
| B7 | 0,109 | 0,863 | 0,210 | 4,286 | 18,9% | P | 0,8571 | 6 | |
| B8 | 0,143 | 0,474 | 0,170 | 4,393 | 17,9% | P | 0,8786 | 2 | |
| B9 | 0,271 | 0,027* | 0,510 | 3,429 | 25,6%* | F | - | - | |
| B10 | 0,152 | 0,507 | 0,119 | 4,429 | 18,9% | P | 0,8857 | 1 | |
| C1 | 0,19 | 0,515 | 0,666 | 3,786 | 19,5% | P | 0,7571 | 20 | |
| C2 | 0,111 | 0,719 | 0,678 | 3,857 | 22,0%* | F | - | - | |
| C3 | 0,195 | 0,843 | 0,714 | 3,679 | 23,5%* | F | - | - | |
| C4 | 0,058 | 0,628 | 0,228 | 4,286 | 16,6% | P | 0,8571 | 6 | |
| Internal Business | C5 | 0,892 | 0,252 | 0,002* | 3,39* | 46,4%* | F | - | - |
| Process | C6 | 0,416 | 0,674 | 0,058 | 4,286 | 30,4%* | F | - | - |
| C7 | 0,193 | 0,789 | 0,440 | 4,321 | 16,6% | P | 0,8571 | 6 | |
| C8 | 0,073 | 0,705 | 0,060 | 4,357 | 15,5% | P | 0,8643 | 5 | |
| C9 | 0,051 | 0,867 | 0,188 | 3,786 | 16,8% | P | 0,8714 | 3 | |
| D1 | 0,158 | 0,814 | 0,828 | 3,893 | 24,6%* | F | - | - | |
| D2 | 0,04* | 0,488 | 0,335 | 4,107 | 28,0%* | F | - | - | |
| D3 | 0,57 | 0,944 | 0,883 | 4,179 | 19,1% | P | 0,8214 | 12 | |
| D4 | 0,71 | 0,334 | 0,160 | 3,571 | 16,0% | P | 0,8357 | 9 | |
| Growth and Learning | D5 | 0,138 | 0,49 | 0,343 | 3,857 | 25,8%* | F | - | - |
| D6 | 0,535 | 0,527 | 0,276 | 3,429 | 19,6% | P | 0,7714 | 17 | |
| D7 | 0,76 | 0,695 | 0,003* | 3,893 | 39,1%* | F | - | - | |
| D8 | 0,486 | 0,841 | 0,051 | 4,107 | 35,9%* | F | - | - | |
Notes: failed (*), passed (P), not qualified (F), education (CT1), job position (CT2), qualification (CT3).
- A variable is considered to pass the comparative test if the Asymp. Sig value is greater than or equal to the level of significance (α), i.e., ≥ 0.05.
- A variable is considered to pass the validity test if its Pearson correlation value (r) is greater than the critical r-value for a sample size of n = 28, i.e., r ≥ 0.374, and the Sig value is less than the level of significance (α), i.e., α ≤ 0.05.
- A variable is considered to pass the statistical analysis if it has a mean value of ≥ 3.4 and a coefficient of variation (CV) of ≤ 20%.
- A variable must pass the comparative test, validity test, and statistical analysis in order for its Relative Importance Index (RII) to be calculated.
Based on the results of the data processing presented in the Table 6, several performance indicators relevant to small and medium-scale contractor companies in Bandung City were identified. From the testing and analysis results, variable elimination was carried out as previously described. Several variables did not pass the comparative test and the validity test. The comparative test was necessary to harmonize the perception of responses from the questionnaire participants. Respondents with different educational backgrounds, positions, and company qualifications may provide varying responses. However, to obtain research results that can be applied more universally regardless of these differences, it is essential to ensure a shared perception. Therefore, variables that did not pass the comparative test were excluded from further analysis. Nevertheless, these variables may be reconsidered in future, more comprehensive studies.
Subsequently, from the statistical analysis results, variables were selected based on a mean relevance score of 3.4 (fairly relevant) or higher and a coefficient of variation (CV) of less than 20%. Out of a total of 35 research variables derived from previous studies, 20 variables met the criteria for both testing and statistical analysis, representing approximately 57.14% of the total predefined variables. The rationale for this adjustment is the differing perceptions among respondents due to variations in educational background, job position, and company qualification level. As shown in Table 6, one variable failed the validity test. This indicates that the questionnaire item for this variable was not appropriate for measuring the intended construct in this study. Furthermore, most variable adjustments were made due to relatively high coefficients of variation—i.e., greater than 20%. A high coefficient of variation implies that the data are widely spread from the mean, indicating a lack of consensus among respondents regarding the relevance of the respective variable.
Based on the previous data processing using the Relative Importance Index (RII) method, the 20 key performance indicators were ranked in order of priority. These indicators can be used to measure the performance of small and medium-scale contractor companies in Bandung City. The ranked key performance indicators are presented in the following Table 7:
Table 7. Ranked performance indicators
| Rank | Performance Indicators | Rank | Performance Indicators | ||
|---|---|---|---|---|---|
| 1 | Service quality | B10 | 11 | Social contribution | B4 |
| 2 | Customer retention | B8 | 12 | Customer satisfaction | B2 |
| 3 | Corporate image | B3 | 13 | Knowledge sharing | D3 |
| 4 | Project value | C9 | 14 | Domestic Income Growth | A3 |
| 5 | Timeliness of project completion | C8 | 15 | Return on equity (ROE) | A6 |
| 6 | Number of projects | C7 | 16 | Net worth | A5 |
| 7 | Compliance with guidelines or regulations | C4 | 17 | Return on investec capital (ROIC) | A1 |
| 8 | Number of new customers | B7 | 18 | Domestic market share | B6 |
| 9 | Employee productivity | D4 | 19 | Number of suggestions | D6 |
| 10 | Current ratio | A8 | 20 | Research and development cost | C1 |
The ranking was determined using the Relative Importance Index (RII) method, which calculates the relative weight of each indicator by comparing the total weighted score to the maximum possible score. This method does not directly compare one variable against another, but rather positions each variable within a scale from 0.2 (if all respondents assign the lowest score of 1) to 1.0 (if all respondents assign the highest score of 5). The midpoint of this scale is 0.6.
The calculation results showed that the lowest RII value among all indicators was 0.7571 (Research and Development Cost, C1). Since all RII values were greater than the midpoint, it indicates that every indicator was perceived as relevant and important by the respondents. Moreover, the differences among RII values were relatively small, reinforcing that no indicator was considered insignificant.
Therefore, the 20 indicators were retained as the key performance indicators (KPIs) for small and medium-scale contractors. The RII ranking serves not as an elimination tool but as a prioritization mechanism, highlighting the relative importance among indicators. These results provide a practical reference for comparing and prioritizing performance aspects, while all 20 remain valid for consideration in developing a comprehensive performance measurement system.
For illustration, the ten highest-ranked indicators consist of one financial indicator (current ratio), four customer indicators (service quality, customer retention, corporate image, number of new customers), four internal business process indicators (project value, project completion timeliness, number of projects, compliance with guidelines and regulations), and one learning and growth indicator (employee productivity). These top-ranked indicators can be considered priorities, while the remaining ones remain relevant and complementary to the overall system.
5. Conclusion and Recommendations
5.1.1. Conclusion
This study was motivated by the absence of a structured performance measurement system specifically designed for small and medium-scale contractors. Existing measurement systems, such as those applied by state-owned enterprises, are not fully aligned with the characteristics and capacities of smaller contractors.
To address this gap, the present study identified and validated a set of performance indicators that are relevant to small and medium-scale contractor companies. Using a combination of statistical analysis and the Relative Importance Index (RII), twenty indicators were confirmed as both relevant and consistently perceived as important by practitioners. These indicators cover all four perspectives of the Balanced Scorecard: financial, customer, internal business processes, and learning and growth. The RII results further provide a prioritization of indicators, with service quality, project completion timeliness, and company image among the most critical aspects.
The contribution of this research lies in establishing a foundation for the development of a performance measurement system tailored to small and mediumscale contractors. The study provides a validated list of indicators and a prioritization framework that future research can build upon. In particular, the findings can guide the design of a Balanced Scorecard-based system that incorporates these indicators into measurable objectives and targets.
5.2. Recommendations
The recommendations based on the findings of this study are as follows. First, although twenty key performance indicators have been identified, their validation is still limited. The relatively small sample size and focus on contractors in Bandung City mean that the results cannot yet be generalized to represent all small and medium-scale contractors in Indonesia. In addition, this study relied primarily on statistical agreement among respondents, without further validation through longitudinal testing or practical implementation in contractor companies.
Second, future research should extend the validation of these indicators by involving a larger and more diverse sample of small and medium-scale contractors across different regions of Indonesia. Broader coverage would enable evaluation of whether the identified indicators are context-specific or applicable at the national level.
Third, subsequent studies should focus on operationalizing these indicators into a comprehensive performance measurement system using the Balanced Scorecard approach. This includes developing weighting schemes, benchmarking standards, and testing the system in practice to evaluate its effectiveness.
By addressing these limitations, future research will be able to strengthen the validity, applicability, and practical value of a Balanced Scorecard-based performance measurement system for small and medium-scale contractor companies.
6. Bibliography
- Abidin, M. Z. (2023). Faktor Penentu dan Strategi Peningkatan Daya Saing Kontraktor Kualifikasi Kecil pada Industri Konstruksi di Kota Bandung. Institut Teknologi Bandung.
- Arifin, F., & Marwan. (2023). Pengukuran Kinerja Pada Perusahaan PT. XYZ Dengan Metode Balanced Scorecard. Jurnal JTIE (Journal Technology and Industrial Engineering), 1(2).
- Badan Pusat Statistik (BPS). (2022). Direktori Perusahaan Konstruksi Provinsi Jawa Barat 2022.
- Badan Pusat Statistik (BPS). (2023). Konstruksi dalam Angka 2023. bps.go.id
- Dinçer, H., Hacıoglu, Ü., & Yüksel, S. (2017). Balanced Scorecard Based Performance Measurement of European Airlines Using a Hybrid Multicriteria Decision Making Approach Under the Fuzzy Environment. Journal of Air Transport Management, 63(1), 17–33.
- Ervianto, W. I. (2005). Manajemen Proyek Konstruksi. Penerbit Andi.
- Hillebrandt, P. M. (1985). Analysis of The British Construction Industry. MacMillan Publisher Ltd.
- Hussain, C. M., Paulraj, M. S., & Nuzhat, S. (2022). Source reduction and waste minimization in construction industry. In Source Reduction and Waste Minimization (pp. 111–126). Elsevier.
- Irmansyah, M. Z. F., & Deviyanti, S. (2021). Analisis Pengukuran Kinerja Perusahaan dengan Balanced Scorecard. Jurnal Senopati, 3(1).
- Kaplan, R. S., & Norton, D. P. (2007). Using the Balanced Scorecard as a Strategic Management System. Harvard Business Review.
- KBBI. (2024a). Definisi Indikator. https://kbbi.web.id/indikator
- KBBI. (2024b). Definisi Kinerja. https://kbbi.web.id/kinerja
- Kim, D., Wongyun, O., Yun, J., Youn, J., Do, S., & Lee, D. (2021). Development of Key Performance Indicators for Measuring the Management Performance of Small Construction Firms in Korea. Sustainability, 13, 6166. https://doi.org/10.3390/su13116166
- Kim, M. K. (2010). A Study on the Management Performance Evaluation Model of Construction Firms [Ph.D Thesis]. Kyung Hee University.
- Kuncoro, T. (2017). Bagaimana Mengukur Kinerja Industri Jasa Konstruksi. Jurnal Bangunan, 22(2), 75–80.
- Kurniadi, D., Fahmi, I., & Novianti, T. (2022). Design of Performance Measurement System in Feed Company PT XYZ with Balance Scorecard Approach. Jurnal Rekomen : Riset Ekonomi Manajemen, 5(2), 157–169.
- Lubis, P. I., & Kusumanto, I. (2018). Penilaian Kinerja Karyawan Menggunakan Metode Key Performance Indicators (KPI) (Studi Kasus: Cv. Bunda Bakery Pekanbaru). Jurnal Sains, Teknologi Dan Industri, 15(2), 37–45.
- Nugraheni, S. R. W., Widyastutik, Amaliah, S., Panjaitan, I., Yulisyawati, I., & Malau, F. (2021). Strategi Peningkatan Daya Saing Sektor Jasa Konstruksi Di Indonesia. Jurnal Ekonomi Dan Kebijakan Pembangunan, 10(2), 176–200.
- Pangestu, R. E. (2020). Perancangan Pengukuran Kinerja Menggunakan Pendekatan Balanced
- Scorecard pada Perusahaan Jasa Konsultan Konstruksi (Studi Kasus pada CV. Araminta Reswara Sani). Universitas Atma Jaya.
- Prawirosentono, S. (1999). Manajemen Sumber Daya Manusia. Kebijakan Kinerja Karyawan : Kiat Membangun Organisasi Kompetitif Era Perdagangan Bebas Dunia.
- Putri, B. C. A. N. (2018). Analisis Pengukuran Kinerja Keuangan Sektor Publik dengan Pendekatan Value for Money. Universitas Sanata Dharma .
- Quezada, L. E., Reinao, E. A., Palominos, P. I., & Oddershede, A. M. (2019). Measuring Performance Using SWOT Analysis and Balanced Scorecard. Procedia Manufacturing, 39(1), 786–793.
- Rachman. (2023). Jurus Sri Mulyani, Bangun Infrastruktur Tanpa Nguras APBN. CNBC Indonesia. https://www.cnbcindonesia.com/news/202310 04165228-4-477921/jurus-sri-mulyanibangun-infrastruktur-tanpa-ngurasapbn#:~:text=Adapun%20alokasi%20anggaran %20infrastruktur%20dalam,2023%20sebesar% 20Rp399%2C6%20triliun.
- Sucahyo, W. A., & Ardyanfitri, H. (2021). Pengukuran Kinerja Perusahaan PT Indofood Sukses Makmur Tbk Periode 2017-2019 dengan Menggunakan Balanced Scorecard. National Seminar on Accounting, Finance,and Economics, 1(7).
- Surat Edaran Sekretaris Kementerian BUMN No. S-08/S.`MBU/2013 (2013) 08/S.`MBU/2013 (2013)