

1 Introduction
Public service websites, especially those of provincial governments in Indonesia, are common to find and accessed by public. Yet, with so many expensed budget and efforts that they put into, most of those websites still do not appeal to general users not to mention those who have special interests for investments. A rough preliminary browsing on those websites indicate that most provincial government websites do not present cognitive appeal, such as visual attractiveness in their page appearances, ease of use in information contents, and ease of navigation. Previous researches on users' acceptance toward presented information and visuals on website show that visuals and page
appearance influence the way users accept and react to a website [1,2]. Further, the quality of visual appearance on page affects the perceived level of credibility and trustworthiness of those websites [3-5]. Yet, with so many studies on website designs, structures, and information contents; none is found to objectively assess the cognitive appeal of information and presented visuals of provincial government websites in Indonesia, especially commonalities, discrepancies, and patterns of the presented websites. To address the presented issue, this study comparatively examines 18 (eighteen) provincial government websites of Indonesia as samples, using content analysis as method of analysis. The study aims to identify characteristics of content and visual presentation of those websites, in order to map visual tendencies and its information suitability as media for promoting and informing local potencies.
2 Theoretical Framework on the Interactive Aspects of Visuals on Web Environment
Many websites have not been necessarily designed with the users in mind. In many cases, websites were designed and engineered to perform merely a set of interactions, using menus and links with icons, symbols, and/or graphics, especially when recent software development can help novice users to build a website in an easy and available way. However, while the sites may effectively work from program-performance -related perspective, it is often at the expense of how the sites are viewed and actually used by the real users. Previous research by Kim-Moon [6] mentioned that when users do the browse with purposes in mind, the necessity to consider the aesthetics aspect of web pages is increased. This is because aesthetics impression was found to influence both users' memories and their decisions process [6,7]. As later mentioned by Schenkman and Jonsson's study [8] beauty is found to be primary predictor of overall impression and preferences of websites, suggesting that aesthetics is a strong determinant of pleasure, experienced by the users during web-interaction. Therefore, recognizing and understanding the trade-offs between performancerelated issues and visualized contents of a website are important, because it might assist web designers to aware on the consequences of arranging and prioritizing different combination of web elements. Accordingly, having the knowledge of these trade-offs can helped web designers to optimize the context of web use, the task at hand, and to be more focus on reaching the intended users.
The appearance of a website is not just merely created through the practice of usability and applying technical standard, but also results of an evolving design activity that transforms a web page appearance into a visual communication medium. The interplay of website visual elements builds up meanings that affect users beyond what previous communication technology practices have
uncovered. Previous research acknowledges that visually appealing website has significant effects in attracting users' attention and trust [1]. Thus, the ability of web designers to create web pages that are easily interpreted yet visually appealing to more target users is therefore of great importance in the success of websites. However, according to Jakob Nielsen [9], no matter how sophisticated every visual representation (on the web) is, the perceptual differences (such as language and cultural representation) will still remain. A visual representation that was designed and developed in one culture and/or geographical domain but used in another has a high probability to receive ―new‖ interpretation. We may not trust the original appeal of visual representations to be necessarily and equally usable around the world. Previous researches [10-12] suggest that what is meaningful and natural for one group may be ambiguous, unintelligible, and inappropriate for other groups. Therefore, presenting largely accepted visual appearances, such as those on the WWW, should be considered thoughtfully and carefully. Nielsen [9] notes that ―…sometimes cultural conditions may have fundamental impact on the very structure of user interfaces which are not just a matter of translations‖. This might have interesting consequences on the use of website as a medium to present and to inform information through visual contents in a diverse cultural setting, such as Indonesia.
3 Method
This study applied quantitative description of content analysis method to identify differences (commonalities, discrepancies, and/or functions) of visuals and information contents of sample websites. As explained by Berelson [13], content analysis is ―a research technique for the objective, systematic, and quantitative description of the manifest of communication.‖
3.1 Phases and procedures of analysis
To address characteristic of contents and visuals of websites, the study conducted 3 (three) phases of investigation:
- (1) Phase 1: Survey, aimed to collect actual data of provincial government websites of Indonesia. This was conducted through online browsing, surveying the visual of identified websites. In this phase, all identified provincial government websites of Indonesia (33 websites) were browsed and marked according to their accessibility points:
- 1. Can it be accessed or not?
- 2. Does it provide accessible links or not?
- 3. Does it regularly updated or not?
- 4. Does it provide accessible information or not?
Those that cannot be accessed, either because of still under construction or non updated contents, will not be used as samples for identification and analysis of websites.
(2) Phase 2: Identification and Analysis, aimed to develop measurement items, to select and to analyze samples of provincial government websites of Indonesia that are accessible, provide clickable links, and regularly updated. Those selected provincial government websites are:
Table 1 Selected Provincial Governments
| No | Website |
|---|---|
| 1 | Sumut (North Sumatera) |
| 2 | Riau |
| 3 | Sumbar (West Sumatera) |
| 4 | Sumsel (South Sumatera) |
| 5 | Jambi |
| 6 | DKI Jakarta |
| 7 | Jabar (West Java) |
| 8 | Jateng (Central Java) |
| 9 | DI Yogyakarta |
| 10 | Jatim (East Java) |
| 11 | Kalteng (Central Kalimantan) |
| 12 | Kaltim (East Kalimantan) |
| 13 | Kalsel (South Kalimantan) |
| 14 | Sulut (North Sulawesi) |
| 15 | Sulsel (South Sulawesi) |
| 16 | NTB (West Nusa Tenggara) |
| 17 | NTT (East Nusa Tenggara) |
| 18 | Bali |
(3) Phase 3: Synthesizing, aimed to summarize and to confirm findings, concluding results of analysis on visuals and information contents of sample websites
3.2 Variables of analysis
There are 2 (two) types of variables for analysis: variable of website visuals and variable of information contents.
3.2.1 Variable of Website Visuals
According to Patel [14], when referring to presented element of content on a website, one can look into the visual organizations of the presented website that are commonly in use. Following Patel's recommendation on home page analysis, this study applied quantitative description of content analysis on 5 (five) variables of website visuals: layout, user aids & services, texts, links, and image visualizations (details explanations of applied variables are presented in the table below).
| Variabel | Examination Purpose |
|---|---|
| Layout | To identify whether a site is designed using Grid or No Grid, and |
| to determine whether the presented screen is made Liquid | |
| (Flexible) or Frozen (Fixed) | |
| Texts | To identify the average words in a page (Differences of % |
| between linkage and non-linkage words) | |
| Links | To identify total number of active linkages, types & methods of |
| linking, and the average number of linkages per page. | |
| Image | To identify type & method of page visualizations (dynamic or |
| Visualization | static, etc.), and the average number of image use per page |
| User Aids & | To identify standard usage of features that aid users and provide |
| Services | services: update, search option, help/assistance, Q&A or FAQ, |
| Personalized / Member Login, Language Option, ID Web | |
| Administrator |
Table 2 Examined Variables for Website Visuals and their purposes
3.2.2 Variable of Information Contents
Based on Berelson's definition on content analysis [13], information contents of the websites were also examined according its accessibilities (the availability and understandability of the presented information contents) and deliverances (types and function of the presented information contents). Details explanations of examined variables are presented below:
| Table 3 | Examined Variables for Information Contents and their purposes |
| Variable | Examination Purpose |
|---|---|
| Availability | To identify whether or not a website provide available and easy |
| access to the presented information on their pages | |
| Understandability | To identify whether or not a website provide easy to understand |
| information on: a. Geography and/or Location; b. Cultural and | |
| tourism; c. Natural resources | |
| Deliverance | To identify whether or not a website presented its information |
| contents to serve as: a. Promotion; b. Information and/or | |
| Announcement; c. Documentaries |
3.3 Measurement Procedures
3.3.1 Analysis on Website Visuals
Each website was quantitatively compared according to the assigned examination variable of layout, texts, links, image visualization, and user-aid & services. Results are given in numbers (showing average, mean values, and/or percentages) as directly measured on examined variables of the presented website visuals.
3.3.2 Analysis on Information
Contents Information contents on each website was identified through onlinebrowsing. Browsing activities were conducted 2 (two) times using ADSL internet access. Results are given in numbers, showing average scores and/or values of those 2 (two) browsing activities on examined variables of the presented information contents. The examination process on information contents was based on interpretative procedures according to the following:
- 1. If the information contents are fully presented, it will be assigned a value of ―4‖ (four),
- 2. If the information contents are adequately presented, it will be assigned a value of ―2‖ (two),
- 3. If the information contents are not presented and/or unavailable, it will be assigned a value of ―0‖ (zero).
Contents that could not be accessed, under construction, and/or contained errormessages are directly associated as not presented and/or unavailable, thus it is assigned a value of ―0‖ (zero).
3.4 Sample of Stimuli
As each website stimulus contains multiple pages and, thus, may hinders webpage examination process; only 3 (three) pages per website are identified and examined further. Sample of website stimuli are presented on Figure 1.
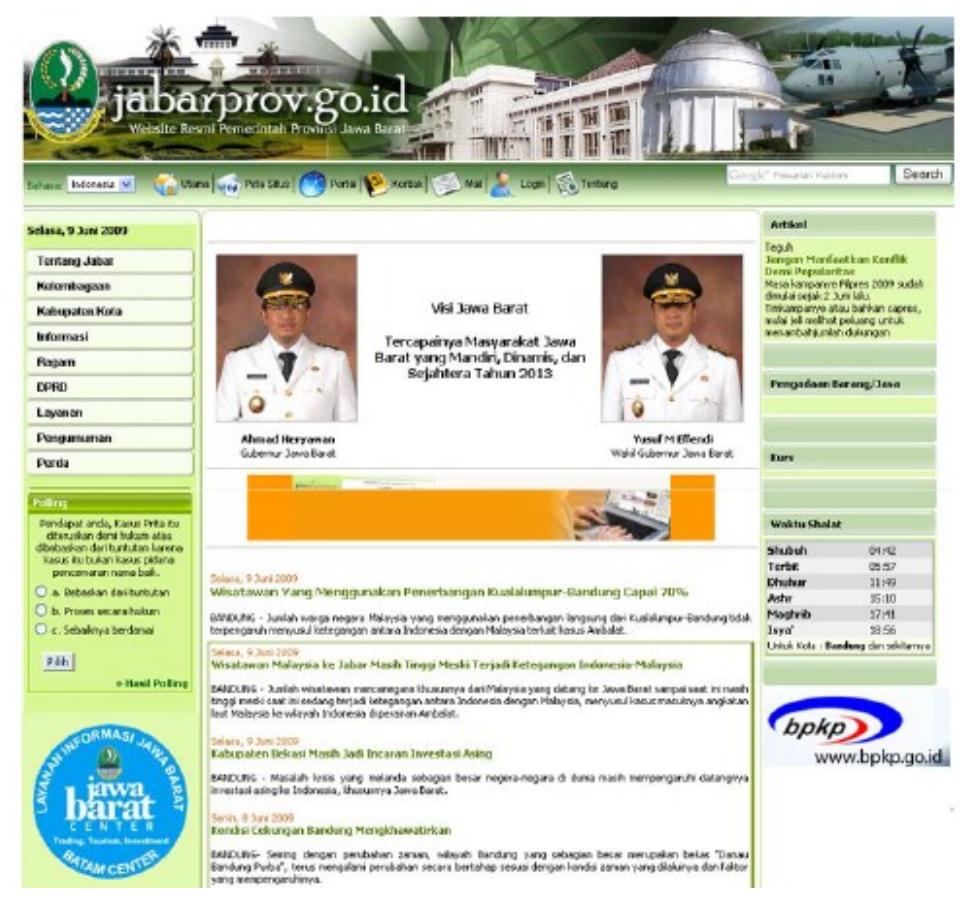
Figure 1 Sample of stimulus (Jabar).
4 Results and Discussions
4.1 Results on Website Visuals
Examination results indicate that all sample websites (100%) use frozen-screen, in which changes of screen sizes (for example from 14‖ to 21‖ monitor display) do not result in the changes of page-appearance sizes. As consequences, users of small-size display monitor must adjust their ‗readings' due to the scrolling of web pages. It indicates that the provincial government websites of Indonesia still do not have users of small-size displays (such as those using notebooks, smart cell-phones, and/or PDAs) as their targeted viewers. Further, examination on variable of user aids& services features shows that in average provincial government websites of Indonesia apply 4-5 features of user aids & services. The most typical user aid & service features are Q&A or FAQ, Search, Update
Information, and Help or Assistance. This indicates that, in average, provincial government websites of Indonesia have provided necessary features to assist visitors to their sites. It is worth to note that provincial government website of Riau is the most in applying user aids & service features (7 features), while websites of Sumut and NTB are the least in applying user-aids & service features (2 features).
Examination on text-feature of websites indicate that most provincial government websites of Indonesia applied in average 709.7 words, which shows relatively higher density of information. Normal density of texts in a page is between 400-700 words to assure readibility of information. Thus, the presented numbers indicate that most provincial government websites of Indonesia may not provide optimal readings for users. Users may be blown-away by the hefty and hectic information on displays (some may reach to over 1200 words per page), which make them hard to understand. According to Nielsen (1997), website are typically do scanning than reading the texts thouroughly. Therefore, inability to provide simple and easy-to-read information on texts, as shown by most provincial government websites of Indonesia, may results in unwillingness of users to interact further.
Examination on the variable of web-linkages, indicate that—in average provincial government websites of Indonesia applied 96.72 linking features per page, mostly appear as text-linking type (79.5%) instead of imagelinking type (15.5%). The results are understandable, due to the fact that most provincial government websites of Indonesia leaning to serve as service-websites (informing activities and/or events) and not serving as commercial websites (for conducting commercial activities on products and/or services). Yet, too much text-linking types require constant efforts in updating and/or managing the presented information contents of websites, which unfortunately did not thouroughly do by their website administrators. There were many cases in which the websites are not updated more than a year. Thus, the presented information are no longer credible and/or trustworthy to follow thorugh.
Examination on image visualization features indicates that—in average provincial government websites of Indonesia applied 8.1 images, which consist of 20% animated images and 80% static images. This indicates that most provincial government websites of Indonesia do not familiar enough to use animated images, which may be used to attract web-visitors and/or place online advertisings. In fact, there are 3 (three) provincial government websites that did not apply animated images at all in their pages. According to Nielsen (1997), if carefully designed, animated images may be useful to attract web-visitors and to extend their interaction with the websites. Given that most institutional websites— provincial government included—are designed and created to attract
visitors to specific information and services related to their places, it is worth to mention that using animated-images may assist them greatly to keep visitors.
Examination on the pop-up feature indicates that most provincial government websites of Indonesia (89%, 16 samples) do not apply pop-up features in their pages. It is only 2 (two) websites: website of Jawa Barat (avg 0.3 pop-up feature) and Sulsel (avg 1.3 pop feature) that apply pop-up feature in their webpages. This may indicate that (1) The presented information on the page of provincial government websites of Indonesia are meant to be ―just‖ information and not necessarily used as means to persuade users interests to the sites; (2) The provincial government of Indonesia do not familiar with the use of pop-up feature as immediate information agent that can be regularly changed and replaced.
Composite results of the examination are presented in the following table:
Website LO/Gr User Aid Text Links Avg Img Anim Stat Fonts Avg Texts Tlink Imglink Total BALI F/Grid 3 1 420.6 122 14 136 0.33 0 1 NTT F/Grid 5 4 974 53 13 66 28.7 5.67 23 NTB F/Grid 2 1 948 42 35 77 10 0 10 DKI F/Grid 5 3 489.3 45 12 57 7.3 1.7 5.7 JABAR F/Grid 3 1 1052.3 97 22 119 8 0.3 7.3 JATENG F/Grid 5 2 553.7 101 33 134 6.7 2.7 4 DIY F/Grid 6 2 835.3 155 14 169 16.7 9 7.7 JATIM F/Grid 5 7 722.3 85 8 93 7.7 5.3 2.3 SUMUT F/Grid 2 3 489.3 63 6 69 6.7 2.7 4 SUMBAR F/Grid 6 1 856.3 110 6 116 1.8 0 6.3 SUMSEL F/Grid 3 1 904 78 10 88 1.3 0.6 0.6 JAMBI F/Grid 4 1 553 55 12 67 4.3 0.3 4 RIAU F/Grid 7 1 1076.3 50 3 53 2.9 1.3 1.6 KALTIM F/Grid 3 2 278 98 7 105 2 1 1 KALSEL F/Grid 6 1 530.6 114 21 165 5.6 2 3.6 KALTEN G F/Grid 5 3 1285.3 51 24 75 11.3 0.7 10.7 SULUT F/Grid 6 3 377 85 22 107 11.3 2.3 9 SULSEL F/Grid 6 2 429.3 27 18 45 9.3 1.7 7.7
Table 4 Data of examined websites.
4.2 Results on Information Contents
Examination results (see Table 5) indicate that most of provincial government websites of Indonesia apply informational contents (value of 44, index score 2.444) rather than documentation contents (value of 36, index score 2.000) and promotional contents (value of 12, index score 0.667). The results confirms previous contention that provincial government websites of Indonesia are designed and meant to provide information for visitors (see previous page, section 4.1).
| Index | Website |
|---|---|
| 1.00 – 0.75 | Jawa Barat (0.9375) |
| (Good) | Kalimantan Timur (0.75) |
| DKI Jakarta (0.75) | |
| 0.749 – 0.50 | Sumatera Barat (0.6875) |
| (Average) | Jawa Tengah (0.625) |
| Bali (0.5625) | |
| NTB (0.5625) | |
| NTT (0.5625) | |
| Sumatera Selatan (0.5625) | |
| Kalimantan Selatan (0.500) | |
| 0.499 – 0.25 | Jambi (0.375) |
| (Fair) | Riau (0.250) |
| <0.249 | DI Yogya, Jawa Timur, |
| (Poor) | Sumatera Utara, Kalimantan |
| Tengah, Sulawesi Utara, |
Table 5 Index Scores of Sample Websites.
Further, there are 6 (six) websites: DI Yogya, Jawa Timur, Sumatera Utara, Kalimantan Tengah, Sulawesi Utara, and Sulawesi Selatan, which cannot fully be accessed within 2 (two) browsing occasions. Thus, those websites are given score of ―0‖ indicating unavailability to provide data. Detail examination of sample websites shows that provincial government website of Jawa Barat is the most accessible and available sites (index score of 0.9375).
Sulawesi Selatan
5 Conclusions
Based on the aforementioned analysis, it can be conclude that:
1. Provincial government websites of Indonesia tend to present high-density of information compare to those of normal pages on displayed texts. This may result in non-optimal readability of presented contents. Users and/or readers may be unable to understand fully what the presented information is about.
- 2. Thus, the provincial government websites of Indonesia may need to overcome these problems through simplifier and readable texts on their web-pages.
- 3. Provincial government websites of Indonesia tend to concern more on using texts than images. As result, users and/or browsers may be hindered to interact further. It is worth to note that ―explain-ability‖ of texts is limited due to their inability to be explored and described. Thus, provincial government websites of Indonesia may need to overcome these problems by functioning images as means of providing information.
- 4. Provincial government websites of Indonesia tend to present descriptiveinformation contents than those of documentary and promotional-contents. The presented information goes on one-way with no room for users/browsers to interact and/or to explore. It is worth to note that website is capable of presenting simultaneous graphics and text page information within a single click of mouse, providing a single interface for accessing all available internet protocols (such as e-mail, telnet, file transfer protocol or ftp, and hypertext transfer protocol or http). Therefore, the important thing from the web is not how it functions for displaying information, but how it presents distinct characters as a communication medium and creates way of impacting people. This, unfortunately, is not fully represented well in the provincial government websites of Indonesia.
This study has successfully examined visual appearance and information contents of sample provincial government websites of Indonesia, suggesting results and insights for improving their optimal uses. However, there still room to explore further, in which this study may not included yet. Future study may include additional factors and/or variables for analysis, providing more complete results for the optimal use of provincial government websites of Indonesia. Those additional variables can be condition of interaction (pre and post browsing), number of samples, state of text-legibility, contextual theme of the presented information on the web-pages, users' and/or perceptual evaluation (understandability, learn-ability, ease of use, ease of navigate) on the presented Information contents.
Acknowledgement
This research was partially funded by Program Insentif Ristek – Riset Dasar Bidang Informasi Teknologi 2008 (Ministry of Research and Technology, Republic of Indonesia). The authors wish to thank research assistants of Visual Communication Design Program for continuously making possible the process of compilation and analysis of data for the study.