
1 Introduction
Floods are natural disasters that occur frequently throughout the world. Researchers have been studying media generation for the visualization of flood disaster modelings to portray the impact of this type of natural disaster. For example, techniques that organize earth surface information in the form of 2D and 3D images or animations based on spatial data and non-spatial data [1]. Such visual representations are considered an efficient way to support decision making and collaborative thinking in the field of flood risk management [2].
However, many visualization media are not created while considering aesthetics so that they are unattractive and difficult to understand for ordinary people. An ideal visual representation has a high-quality design and uses aesthetic elements so that it is psychologically associated with beauty [3]. It is important to add aesthetic value to media visualizing natural disasters to make them more impactful and easier to understand [4]. The analysis of the aesthetic value of a visualization is important for verifying people's perceptions and reception. Studies on existing aesthetic values are needed to determine their relevance for the development of visualization media related to flood disaster modeling [5]. The flood modeling geovisualization sample used in this study depicts floods in Jambi city in 2003 and was created by Apip, et al. [6]. An analysis of the aesthetic elements was conducted to measure whether the modeling representation has aesthetic value [7].
The results of this study will be used for further development of visualization media for flood modeling. By considering aesthetic value, the visualizations can become more impactful and easier to understand by ordinary people so that they are better informed about the danger of flood disasters.
2 Aesthetic Literacy
This section discusses applied media aesthetics, the importance of aesthetics in disaster simulation media, and elements of applied media aesthetics. These theoretical considerations were used to analyze the aesthetic elements contained in the flood modeling geovisualization sample.
2.1 Aesthetics and Applied Media Aesthetics
The noun 'aesthetics' and the adverb 'aesthetic' come from the ancient Greek aisthanomai ('to perceive'). The most common meaning of aesthetics refers to the principles and techniques that make something beautiful [8]. The study of aesthetics in philosophy is related to the understanding, perception, and conception of adjectives such as 'beautiful', 'ugly', 'elegant' as well as related sensations and feelings. Aesthetic knowledge is highly dependent on sensations, feelings, empathy, and intuition [9]. Applied media aesthetics is the process of analyzing and applying the elements contained in aesthetic media communication systems, involving the following elements: shape, color, movement, sound, tone, and their relationship to the overall composition, with the purpose of finding deficiencies in an object and to formulate an appropriate aesthetic concept and create novelty [7,10].
2.2 Importance of Aesthetics for Disaster Information Media
The concept of 'aesthetics' has a unique relationship with media studies [8]. Aesthetic value is a concept that is ripe for future research in this context. The process of its evolution has shaped the human brain, influencing its perception and visual aesthetic experience [9]. However, in the second half of the 20th century, the concepts of aesthetics and pleasure were almost completely ignored in media theory [4]. Recently, the concept of aesthetic value has been applied in information media to create an experience that is easier to understand and better recallable by the audience [10].
Usually, natural disasters are depicted as frightening events. However, the film Ponyo presents a different perspective; the Japanese animation director Hayao Miyazaki represents a flood with extraordinary aesthetic sensitivity. According to Miyazaki there is no point in describing a natural disaster as an evil event. William Turner, the British romantic landscape painter, also found aesthetic pleasure in natural disasters. The American Noel Carroll, a representative of the contemporary philosophy of art, has described deep, intuitive responses to natural disasters in a form that is smooth and beautiful but also terrifying [11]. However, the visual aesthetics that this philosophy proposes are not applicable to representations based on real data.
2.3 The Elements of Applied Media Aesthetics
Some elements of applied media aesthetics [5,7] are:
- 1. Lighting is a key element of visual perception that directs the viewers in time space and affects their emotions. The type of light can be classified as natural light, a form of radiant energy that is visible. The purpose of lighting is to make objects and their textures visible.
- 2. Color plays an important role in determining aesthetic preferences for visual arts [12] by enhancing interface aesthetics, increasing attractiveness, and ensuring acceptance and system credibility [13]. The three main color attributes are hue, saturation, and brightness.
- 3. 2D field is a screen on which to present the media. It constitutes a frame that helps to control the space. The aspect ratio is the width of the screen to the screen's height. The aesthetics of size consists of: orientation, magnetism of the frame, asymmetry of the frame, figures and background, psychological closure, and vectors.
- 4. 3D field is the representation of depth and volume in a video, film, computer display, painting, or photograph. The structure of this process
- involves the Z-axis in the coordinate point system (X, Y, Z). Graphic depth factors indicate the volume of depicted objects (size, height, perspective).
- 5. Time/motion refers to various factors, such as duration, change, causality, repetitive phenomena, cycles, rhythm, and motion. Also included are day and night, month, season, past, and present. Types of time are: objective time, subjective time, psychological time, biological time, and time direction.
- 6. Sound in audio-visual media should not be used separately from the imagery [14]. Criteria used to match images and sound are: historical matching, geographical matching, thematic matching, tonal matching, and structural matching, [5,7,10].
3 Methods
This study used a questionnaire among a group of students to examine the implementation of the aesthetic elements in applied media in a flood modeling geovisualization sample. The sample population consisted of 40 undergraduate graphic design students. The participants were given a visualization sample to evaluate. The questionnaire represented a visual analogue scale, i.e. an instrument to measure the characteristics and attitudes that exist in a complete set of values that are difficult to measure directly [15]. Closed questions were used to identify the elements of applied media aesthetics. Several choices of answers were provided and the participants were asked to choose the one they considered the most appropriate [16]. The outcome of the questionnaire was analyzed to determine the appropriate elements of applied media aesthetics to be used in making flood modeling visualizations.
4 Results and Discussion
The elements of applied aesthetics in the flood modeling geovisualization sample were systematically analyzed.
4.1 Analytical Approach
In an analytic approach a phenomenon is broken down into the elements necessary to explain it [17].
- a. Description. The visual elements used in the visualization sample are lines, curves, text, numbers, colors, textures, and 2D animations.
- b. Analysis. Lines are used to frame the image. Arches are used to show the distribution of flooded areas. Text is used to show the names of locations of the flooded areas. Numbers are used to show the timing of the flood propagation, with a total duration of 480 seconds. Color is used to explain the height of the flood.
c. Interpretation. The following interpretation elements of applied media aesthetics are used in this sample: line, color, texture, text, and shape, arranged for conveying information about the location, time and height of the flood, as shown in Figure 1.
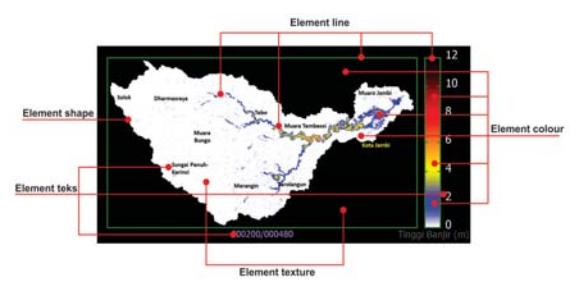
Figure 1 Elements of applied media aesthetics used.
To break down the sample further, physioplastic, ideoplastic, and judgment analyses were also carried out. The flood modeling visualization sample contains the following information:
- 1. Physioplastic analysis concerns objects that can be observed with the naked eye or touched and held by hand. These elements are color, line, texture, shape, and space [18]. The modeling in Figure 1 describes the distribution area of a flood for a duration of 480 seconds, showing the height of the flooding by using color gradations.
- 2. Ideoplastic analysis concerns the influence or understanding provided by an image [19]. The visualization sample in Figure 1 provides information on flooding events in the Batanghari River basin for forecasting and prediction.
- 3. Judgment analysis is criticism of a visual work based on identifying its strengths and weaknesses [20]. The information conveyed in Figure 1 is understandable by practitioners and researchers, but less understandable by ordinary people.
4.2 Applied Media Aesthetics Elements
A questionnaire was distributed using Google Form. The link address was shared using WhatsApp social media with 40 graphic design students from three universities in Bandung, Indonesia. The respondents were men as well women and were between 19 and 22 years old. The measurement parameters used as applied media aesthetics elements were: lighting, color, 2D field area, 3D field, depth and volume, time/motion, and sound. The questionnaires contained presented closed questions with a visual analogue scale format. The respondents' answers were scored in percentages. Based on the results of the questionnaire it could be concluded which elements were used and which were not used in the flood visualization sample, as shown in Table 1 (the boxes marked by a grey background in the Answer/persons column are conclusions).
\(\textbf{Table 1} \quad \text{Analysis of aesthetic elements applied in the modeling sample}.\)
| Element | Type - | Answer/persons | ||||
|---|---|---|---|---|---|---|
| paramaters | Us | Used | Not used | |||
| Light | Nature of light | 20% | ✓ | 80% | ||
| Lighting purposes and functions | ✓ | 84% | 16% | |||
| Nature of shadows | 13% | ✓ | 87% | |||
| Outer and inner orientation | 19% | ✓ | 81% | |||
| Color | Hue | ✓ | 85% | 15% | ||
| Saturation | ✓ | 82% | 18% | |||
| Brightness | 17% | ✓ | 83% | |||
| 2D field | Main direction | ✓ | 75% | 25% | ||
| Magnetism of the frame | 15% | ✓ | 85% | |||
| Asymmetry of the frame | ✓ | 93% | 7% | |||
| Figure and ground | ✓ | 84% | 16% | |||
| Psychological closure | 3% | ✓ | 97% | |||
| Vectors | ✓ | 77% | 23% | |||
| 3D field | The Z-axis | ✓ | 100% | |||
| Graphic depth factors | ✓ | 100% | ||||
| Depth characteristics of lenses | ✓ | 100% | ||||
| 3D stereoscopic projection | ✓ | 100% | ||||
| Time and motion | Objective time | ✓ | 81% | 19% | ||
| Subjective time | ✓ | 96% | 4% | |||
| Biological time | 16% | ✓ | 84% | |||
| Time direction | ✓ | 98% | 2% | |||
| Time present as subjective time | ✓ | 80% | 20% | |||
| Controlling subjective time | 7% | ✓ | 93% | |||
| Sound | Historical matching | ✓ | 100% | |||
| Geographical matching | ✓ | 100% | ||||
| Thematic matching | ✓ | 100% | ||||
| Tonal matching | ✓ | 100% | ||||
| Structural matching | ✓ | 100% | ||||
The method for calculating the scores from the results of the questionnaire is explained in Eq. (1),
\[\frac{\textit{Total answer}}{\textit{Total respondents}} \times 100\% = \textit{score}\] (1)
with rounding 'under 0.5=0; and upward 0.5=1'.
A further explanation of Table 1 is given below:
(a) Light. The lighting purposes and functions in the visualization sample were the control of the light so that objects and their textures are visible, which affects the understanding of those who view the sample.
(b) Color. The aesthetic perception of the visualization sample is characterized by the use of compatible/non-compatible colors and hue. The colors black, blue yellow, orange, red and black were used, as can be seen in Figure 2.
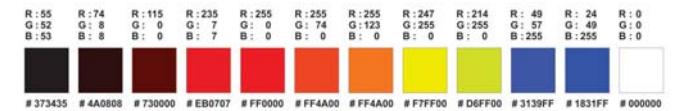
Figure 2 The use of hue in the visualization sample.
Saturation was used in the visualization sample to indicate the level of flood height with color gradation, as in shown in Figure 3.
Figure 3 The use of saturation in the visualization sample.
The following color arrangement was used to indicate the height of the flooding in different places: white to blue for a flood height between 0 and 2 m; blue to yellow for a flood height between 2 and 4 m; yellow to orange for a flood height between 4 and 6 m; orange to red for a flood height between 6 and 8 m; red to dark red for a flood height between 8 and 10 m; dark red to black for a height of flood between 10 and 12 m.
No explanation for the color use was given. It would be better if the color selection adhered to an aesthetic concept that can be psychologically explained. For example, white indicates a safe zone, yellow indicates a vulnerable zone, and red indicates a danger zone.
- (c) 2D field area. The media channel through which a modeling will be displayed is important to determine at the start of the design process because the aspect ratios of televisions, monitor screens, widescreen, and smartphones are all different. The aspect ratio used in the flood modeling geovisualization sample was 4 x 3, according to the height and width of a computer screen.
- 1. Orientation: horizontal. A modeling can be arranged visually on the screen with a horizontal or a vertical orientation. A horizontal
- orientation is more dynamic, stronger, and more attractive than a vertical orientation, as shown in Figure 5-1.
- 2. Asymmetry of the frame: Diagonal type 2 suggests a downhill slope because the perception of the left and right sides of the screen is not the same and objects are located in the center of the screen, as indicated by the yellow dashed line in Figure 5-2.
- 3. Figure and background. A modeling determines the relationship between the main object (map) and the black background. In the sample this aspect is managed well so that it is a stable and easy to manage value, as can be seen in Figure 5-3.
- 4. Vector. A vector is a type of line used in graphics that can direct the eyes of the viewer to follow the movement from one point to another. The line is an animation of flood distribution movements, as shown in Figure 5-4.
(d) Time/motion. The visualization sample is presented using:
- 1. Objective time. The broadcast duration of this modeling is 480 sec, the duration of time continues without stopping from 000000 to 000480, where each time change is followed by line movements with colors that vary according to the height of the flood, as in Figure 5-5.
- 2. Subjective time. The changes and line movements are very short, namely 000480 seconds.
- 3. Time direction. This modeling shows subsequent flood events in 2003.
- 4. The present time as subjective time. There are two objects that move at the same time in this modeling. It is divided into nine frames; each frame is divided into 60 seconds: 000000, 000060, 000120, 000180, 000240, 000300, 000360, 000420, and 000480. Every second there is a change in line movement and color on the line according to the level of flood height [21].
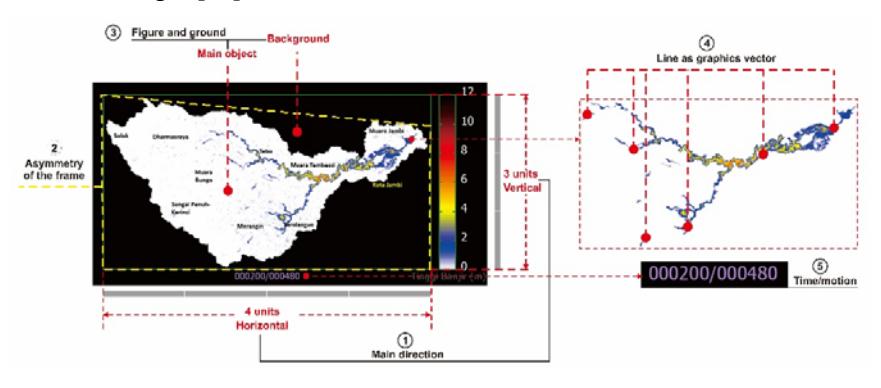
Figure 5 The flood modeling geovisualization sample that was analyzed.
Referring to the above description of the findings it is important to use the elements of applied media aesthetics so that flood simulation modeling will be easier to understand and remember by ordinary people. The color elements that are used must have a psychological meaning. Because of the subjectivity of time, an interaction button should be added for the element of time/motion that allows the user to stop and play back the time display and the distribution flood line so that user can repeat the displayed information.
In visualizations, aside from the aesthetic parameters mentioned in the modeling analysis above (light, color, 2D field area, and time/motion) we propose to add 3D elements, such as depth, and sound to make the representation more realistic, more impactful and easier to understand. Thus, the proposed aesthetic concept is:
- a) 3D field. Use graphic depth, relative sizes, height in fields, linear perspectives, aerial perspectives, supported by light and shadows that indicate volume, 3D stereoscopic projection, volume duality, special effects and spatial paradoxes.
- b) Sound. Use sound to supply information (for example in the form of narration), to help external orientation and to create an atmosphere. Use picture/sound matching, geographical matching, and tonal matching.
5 Conclusion and Future Research
Flood visualization media are often not made by using aesthetic value so that they are unattractive and difficult to understand for ordinary people. An example is the flood modeling geovisualization sample that was used for analysis in this study.
The analysis and interpretation showed that the sample used applied media aesthetics elements such as color and texture, line, text, and numbers. However, this was done without a proper aesthetic concept to arrange the elements to effectively convey information about the location, time and height of the flood. Physioplastic, ideoplastic, and judgment analyses were also conducted. The results of the physioplastic analysis revealed that the distribution area of the floods was indicated by color gradation. The results of the ideoplastic analysis revealed information provided on the flood events for forecasting, prediction, understanding the process, and scenario-based management. The results of the judgment analysis revealed that the information conveyed is understandable by practitioners and researchers but needs further explanation for an audience consisting of ordinary people.
The questionnaire results showed that the flood modeling geovisualization sample used applied media aesthetics elements but not according to a wellplanned aesthetic concept; it was only based on the usage function. The aesthetic elements used were light parameters: lighting type and light purposes and functions; color parameters: hue and saturation; 2D field area parameters: orientation, asymmetry of the frame, figures and background, and vectors; time/motion parameters: type objective time, subjective time, time direction, and present time as subjective time. Meanwhile, 3D field parameters (depth, volume, and sound) were not used. Aesthetics elements must be applied based on an appropriate aesthetic concept, such as using color psychology, adding interaction buttons, 3D field parameters and sound. This way, the modeling visualization can be more easily understood and will be more useful for ordinary people.
Acknowledgements
The authors would like to express their gratitude to the University Kebangsaan Malaysia (UKM) for providing the opportunity and funding under Industrial Research Grant code ZG-2018-001. They also express their thanks for the Malaysia International Scholarship (MIS) and the Indonesian Institute of Sciences (LIPI).