
1 Introduction
Motorcycles are an important mode of transportation within the transportation system of Indonesian people and are the largest contributor to the production of vehicles in Indonesia. Out of the total vehicle population (units in operation) in the period from 2010 to 2017, motorcycles accounted for around 82% of usage and were used by 120 million Indonesian people in 2018 this information can be seen in Figure 1. This number will continue to increase along with their production number [1].
Received August 9th , 2020, Accepted for publication November 15th, 2020. Copyright © 2020 Published by ITB Institute for Research and Community Services, ISSN: 2337-5795, DOI: 10.5614/j.vad.2021.13.1.1
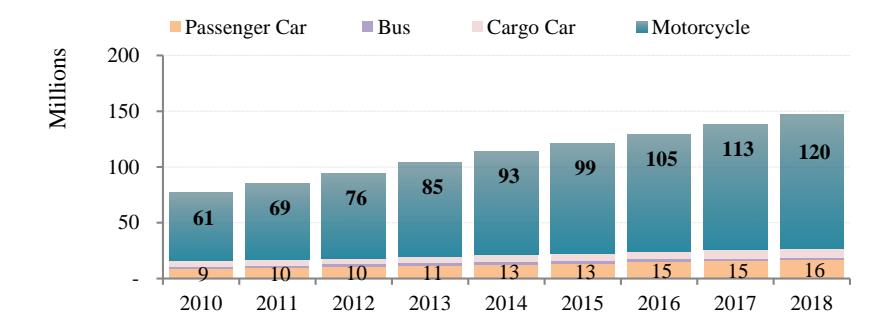
Figure 1 Graph of total vehicle usage (UIO/units in operation) in Indonesia in the period from 2010 to 2018 [1].
According to data from an internal research of Astra Honda Motor conducted on 5,056 motorcycle users in all provinces of Indonesia, there are several reasons why people in Indonesia use motorcycles, including: reducing household expenditure; reaching their destination fast; being able to ride on all road conditions, both wide and narrow roads (alleys); etc. [2].
According to the Indonesian Motorcycle Industry Association [3], the current market for motorcycles in Indonesia can be divided into three categories: underbone, sport and scooter motorcycle models. Based on the General Draft of the National Energy Plan (RUEN) stated in Government Regulation No. 79/2014, quoted by state-owned oil and gas corporation Pertamina in a seminar, the Indonesian government targets the usage reduction of gasoline-based energy from 46% in 2019 to 25% in 2025 and then to 20% in 2050. To support this program, the government has issued Presidential Decree No. 55/2019 regarding the acceleration program for electric vehicles. In order to promote the usage of electric vehicles, the government has determined a gradual targeted growth of electric vehicle production from 2020 to 2030 [4].
Key success factors for electric vehicle usage to survive and grow are among others: specification and performance, mileage, (exterior) design, regulations, energy-refilling infrastructure, and selling price. This is in accordance with customer purchasing decisions of products based on several judgments, such as: judgment of functionality and utility; judgment of product experience ('experiential, hedonic and aesthetic'); judgment of communicative value ('expression and public meaning') and judgment of private value ('the customer's own perception') [5].
In addition to experiencing the product's utility, other reasons and motivations also determine product purchasing decisions, both basic and emotional reasons and motivations, or essential ones as part of differential strategies or product
excellence compared to other products [6]. It is amust for a product to supply a basic need or a costumer purchasing reason related to the basic function of the product and also aspects such as those related to the emotional response of consumers to the design [7]. According to Hekkert [8], the success of a product is determined by several factors, including the experience of using the product (product experience), where each experience of using the product will determine the meaning for its user.
The research questions related to the study of Indonesian consumer preferences on motorcycle design in the areas of Jakarta and Bandung included: (1) who are electric motorcycle users, based on demography and psychographic, and what are their motivations (the difference in motivation between electric motorcycle and gasoline-fueled motorcycle users), and (2) what design category and Kansei dimension represent the type of electric motorcycle that motorcycle users are interested in.
2 Research Methodology
2.1 Kansei Engineering Method
The Kansei Engineering method was developed by Mitsuo Nagamachi at Hiroshima University around 43 years ago. This method is known as a product development method with an orientation toward the users of a product. It can be used to qualitatively measure the perception and preference provided by respondents toward certain stimuli in order to produce adjectives that can be used as reference in determining a design direction for designers [9]. In this study, the Type 1 Kansei method was used. The processes that were carried out were: (1) Kansei word identification – 0th order Kansei (qualitative); (2) Kansei word grouping – 1st order Kansei (qualitative); (3) knowing the user and product sample assessment (preferred image) using semantic differential measurement (quantitative); (4) factorial analysis – 2nd order Kansei; (5) product property identification, physical Kansei; and (6) product assessment with semantic differential measurement (quantitative) [10].
2.2 Semantic Differential (SD) Measurement
Semantic differential (SD) measurement is a method designed to measure the connotative meaning (semantic) of an object [11]. The connotative meaning is used to determine the expression of the research object in a stimulus. In this study, semantic differential measurement was used to analyze the evaluation results of the respondents' preferences related to motorcycle designs in response to stimuli in the form of motorcycle images provided as part of the Kansei Engineering method.
2.3 Factorial Analysis
Factorial analysis is a statistical method used to describe the relationship between each variable (connotative meaning) being observed. A number of observed variables are categorized according to general factors, which are then analyzed to determine which one has the specific (unique) factors that best reflect the impressions of the respondents (individuals) [12]. The variables in this study were 13 pairs of connotative meanings tested on 112 respondents.
According to Nagamachi and Loekman (2003) [10], factorial analysis in the Kansei Engineering method is important to avoid mistakes in determining which targets/factors are the most influential. In factorial analysis, several things need to be done before hand, including a data validity check using the Kaiser-Meyer-Olkin (KMO) test and Bartlett's test of sphericity (significance). The total statistical data processing done in this study was: (1) grouping and data cleansing; (2) conducting a data validity check using the KMO test and Bartlett's test; and (3) after the obtained data were declared valid, the factorial analysis process was carried out to produce the most dominant factors. The processing of factorial analysis was done using the SPSS software with the principal component analysis method. The next step was factor rotation carried out to get specific factors for each variable and to simplify the factor structure; (4) the contributing factors were grouped to get matching meanings as representative factors [13].
2.4 Study Preparation
This study was conducted in two large cities in Indonesia, Bandung (11 and 12 November 2019) and Jakarta (13 and 14 November 2019) with the same number of respondents in both cities, Jakarta 50% and Bandung 50%. The research target user details, including demographic aspects, can be seen in Table 1.
| Details | Item | Sum | % |
|---|---|---|---|
| Non User, BeAT, Vario 125, Scoopy, | |||
| Owner | PCX, Nmax, Mio | 112 | 100% |
| Male | 56 | 50% | |
| Gender | Female | 56 | 50% |
| Age | 17-25 years | 112 | 100% |
| Respondent | |||
| Interview | 3 respondents per interviewer | 112 | 100% |
| Level of Education | Min. senior high school | 112 | 100% |
| Total Sample | 112 |
Table 1 Respondent demography I.
The following are the different research instruments used in this study: (1) a motorcycle sales data base, online media and journals; (2) group discussions (focus group discussions) with a group of experts, (3) an online questionnaire; (4) show card stimuli, as shown in Figure 2, to represent the design directions Fun, Fashionable, Elegant, Sporty & Aggressive, and Manly; (5) a multilevel scale (Likert scale); (6) the stimuli were evaluated based on seven components of the design: overall design, designs of steering handle and head shape, head light design, front view design, side view design, seat design and rear view design; (7) respondent interviews (in-depth interviews); (8) study population and sample.
Figure 2 Stimuli grouping of motorcycle designs based on design direction existing in domestic and international markets.
2.5 Data Collection Method
In general, the process of this study can be divided into the following two phases:
- 1. Preparation and design of in-depth interviews (IDI). In this phase of the study, preparation and scenario design for the survey to be conducted were carried out with the following details: (1) determining the working partners, namely recruitment consultants, (2) forming the survey team, (3) selection and arrangement of the interview locations, (4) room layout, (5) number of respondents, (6) recruitment of respondents, (7) arranging indepth interview questions.
- 2. Implementation of in-depth interviews (IDI). During IDI implementation, the interviewers played an important role because they had to fill the
3 Discussion and Result of Study
The targeted number of respondents in this study was 112, but after data processing the number of respondents suitable for use was only 104. The decrease in the number of respondents was due to several outlier data that had to be excluded since they did not match the desired characteristics.
3.1 Characteristics of Motorcycle Users
Purchasing motivations of motorcycle users in Jakarta and Bandung as the object of this study were reaching their destination fast and to save expenses. The factors 'time' (efficiency) and 'money' (economy) were drivers of purchasing decisions. Motorcycle user characteristics represented by the respondents of this study were: active-general-fun-technology-efficient. Reasons for purchase were the second most important factor in the decision to purchase a particular type of motorcycle; the respondents' reasons to purchase motorcycles are grouped in the following Maslow pyramid. Can be seen in Figure 3, design become the top of pyramid that make the motorcycle user can actualize their character, but basic need that must be available for developing a motorctcle is valuable price (economy) and comfortable to ride.
Figure 3 Recapitulation of reasons for motorcycle purchase using a Maslow pyramid [7].
3.2 Analysis of Motorcycle Category and Motivation Toward Electric Motorcycles
Based on the data result of the selection of motorcycle categories (Table 2), that the respondents plan to purchase it can be seen that most users, 85% of the total number of respondents, preferred purchasing an AT motorcycle (automatic motorcycle/scooter).
| Utility Variable | Classification Parameter | Number | Percentage (%) |
|---|---|---|---|
| Next bike (gasoline) | MOPED | 1 | 1% |
| SCOOTER | 88 | 85% | |
| SPORT | 15 | 14% | |
| Purchasing potential EV | No | 55 | 53% |
| Yes | 49 | 47% | |
| Next bike (EV) | MOPED | 10 | 10% |
| SCOOTER | 93 | 89% | |
| SPORT | 1 | 1% |
Table 2 Result of category selection of next motorcycle (gasoline-fueled and electric) survey respondents plan to purchase.
Respondents selecting an electric motorcycle accounted for 47% of the total respondent population. Thus, the electric motorcycle penetration rate is not optimal. Some collected qualitative results related to respondents' obstacles to choosing an electric motorcycle were: (A) 'No, I am not interested in an electric motorcycle' (53%). The respondents' reasons included: limited riding distance, running out of electrical energy, difficulty in finding battery-charging stations, not being accustomed to riding one, and not being able to be ridden by two persons; (B) 'Yes, I am interested in an electric motorcycle' (47%). The respondents' reasons included: being more economical, more comfortable and not noisy, more environmentally-friendly and more practical because no gasoline is required. The scooter motorcycle is the most favored type because it is easier to ride (68%) and because it is comfortable for daily use (12%).
In addition to the above main aspects of selecting motorcycles, several supporting aspects in order for motorcycles to be selected were mentioned, including a maximum price of 25 million rupiahs, availability of a fast-charging infrastructure, and special parking facilities for electric motorcycles. Beside that the motivations to buy electric motorcycle users were (Figure 4): efficiency (saving expense), technological utility (technology), and fun (for having fun). Therefore, the electric motorcycles should be able to provide lower total cost than that of general motorcycles, the basic understanding of developing electric motorcycle should have lower total cost compare to internal combustion engine motorcycle. From this research we can summary the understanding of EV development with below equation.
Ownership cost (EV) + running cost (EV) + maintenance cost (EV) < (less than) ownership cost (gasoline) + running cost (gasoline) + maintenance cost (gasoline)
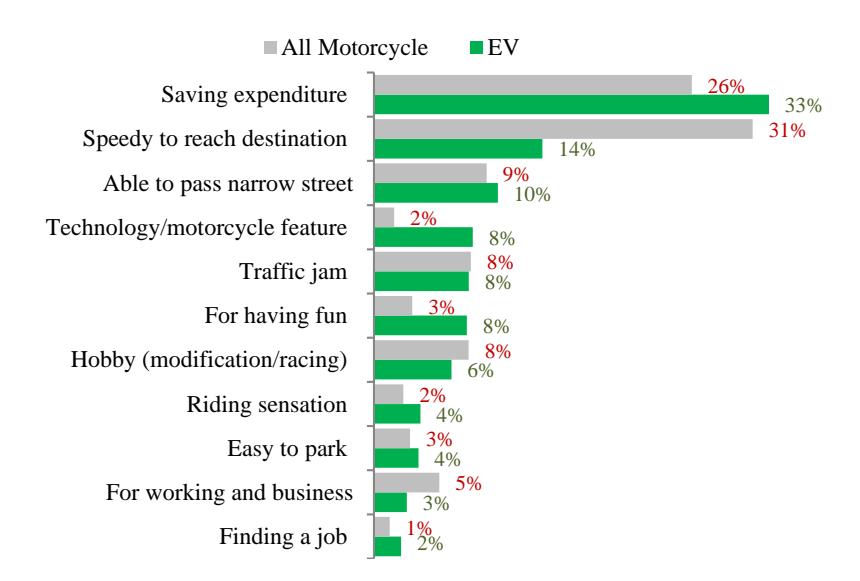
Figure 4 Graph of gasoline-fueled motorcycle and electric motorcycle selection reasons.
3.3 Analysis of Group of Electric Motorcycle Users and Motivation for Purchasing
In terms of their profile (demographic and psychographic) there was no difference between the total respondents and the respondents who wanted to switch to an electric motorcycle (Table 3). Both gasoline-fueled motorcycle users and electric motorcycle enthusiasts favored efficient products and were open-minded toward new technology, but this kind of users are followers that need convincing to use something new. This will be a challenge when marketing electric motorcycles because they compete with general motorcycles, and there is a possibility that consumers consider electric motorcycles as substitute motorcycles, not as first-use or additional motorcycles (complementing each other).
3.4 Kansei Dimensions Represented by Kansei Words and Electric Motorcycle Design Direction
Before deciding to evaluate the design direction for electric motorcycles consisting of 7 components by referring to 10 stimuli of both existing gasolinefueled and electric motorcycle images, a focus group discussion was carried out to extract Kansei words obtained from various automotive design journals, motorcycle brochures and catalogues, reviews by online magazines and official websites of motorcycle manufacturers as stimuli. There were 91 adjectives that were grouped into 13 pairs (Table 4), which were then arranged into a semantic differential questionnaire using a Likert scale from 1 to 5.
Table 3 Data for next motorcycle (next bike) selection by gasoline-fueled and electric motorcycle users.
| Demography of Motorcycle Users in Jakarta and Bandung | Total Respondents | Interested in EV | |||
|---|---|---|---|---|---|
| Demography Variable | Classification Parameter | Total (%) | Total | (%) | |
| Age range | < 20 Years | 17 | 16% | 8 | 16% |
| 20 - 24 years | 59 | 57% | 31 | 63% | |
| 25 - 29 years | 26 | 25% | 10 | 20% | |
| 30 - 35 years | 2 | 2% | 0 | 0% | |
| Type of occupation | Student | 22 | 21% | 13 | 27% |
| Entrepreneur | 15 | 14% | 5 | 10% | |
| Civil Servant | 2 | 2% | 1 | 2% | |
| Private employee | 47 | 45% | 23 | 47% | |
| Professional | 2 | 2% | 0 | 0% | |
| Housewife | 14 | 13% | 5 | 10% | |
| Unemployed | 2 | 2% | 2 | 4% | |
| > Rp. 8,000,000 | 3 | 3% | 1 | 2% | |
| Rp.7,000,000 - 7,999,000 | 1 | 1% | 1 | 2% | |
| Rp.6,000,000 - 6,999,000 | 5 | 5% | 2 | 4% | |
| Rp.5,000,000 - 5,999,000 | 14 | 13% | 7 | 14% | |
| Economic status based on household | Rp.4,000,000 - 4,999,000 Rp.3,000,000 - | 14 | 13% | 7 | 14% |
| expenditure | 3,999,000 Rp.2,000,000 - | 39 | 38% | 19 | 39% |
| 2,999,000 < Rp. 2,000,000 | 17 11 | 16% 11% | 8 4 | 16% 8% | |
The result of the evaluation with the above adjective pairs was processed using factorial analysis and processed using SPSS to get an eigen value that forms several factors.
3.5 Factorial Analysis of Electric Motorcycle Design
Before conducting the analysis, a validity test was conducted to ensure that the data used met the sample adequacy requirements and had simultaneous correlation among factors. The factorial analysis was applied to several components of the motorcycle, such as overall design (style), steering handle and head shape designs, position and shape of head light, front view design, side view design, seat design and rear view design.
| Adj. word | tally gree | Neutral | Totally Disagree | Adj. word | EPA Dimension | |||
|---|---|---|---|---|---|---|---|---|
| 1 | 2 | 3 | 4 | 5 | Difficusion | |||
| Masculine | Feminine | Evaluative | ||||||
| Tough | Gentle | Potency | ||||||
| Luxurious | Cheap | Potency | ||||||
| Compact | Big | Potency | ||||||
| Speedy | Slow | Activity | ||||||
| Comfortable | Uncomfortable | Activity | ||||||
| Sporty / active | Not Sporty | Evaluative | ||||||
| Futuristic | Retro | Evaluative | ||||||
| Stylish | Rigid | Evaluative | ||||||
| Simple | Complicated/winding | Evaluative | ||||||
| Playful | Boring | Evaluative | ||||||
| Looking | Ordinary | Evaluative | ||||||
| Different | ||||||||
| Elegant | Rough/notched | Potency | ||||||
Table 4 Bipolar adjective pairs forsemantic differential questionnaire.
From a sample testing using the Kaiser-Meyer-Olkin (KMO) test and Bartlett's test of sphericity using the SPSS program with the following steps: analyze – dimension reduction – factor and descriptive – KMO test – Bartlett's test of sphericity – anti image – initial solution for type of overall design, the result was as follows (Table 5).
Table 5 Result of KMO method and Bartlett test overall design parameters.
| KMO a | nd Bartlett's Test | |
|---|---|---|
| Kaiser-Meyer-Olkin mea | sure of sampling adequacy | ,859 |
| Bartlett's test of sphericity | Chi-square approx. | 549,824 |
| Df | 78 | |
| Sig. | ,000 |
Based on the above table, it can be seen that the value of KMO MSA, 0.859, was higher than the standard of 0.5 so it could be concluded that the sample data for overall design were eligible to process. The significance figure from Bartlett's test was Sig = 0.000 so that it could be concluded that there was a correlation among the variables and therefore they were eligible for to process.
To determine significant factors based on the responses on the overall design of the electric motorcycles, a tes twas carried out with image stimuli and bipolar adjectives. Extraction of factors was conducted using principal component analysis – PCA) in SPSS. After obtaining general factors, factor rotation to get one specific factor for each variable and simplification of the structure with SPSS was carried out. Regression toward the factor rotation result was carried out for use as a reference in creating a matrix plot for scatter plotting toward the formed factors.
The results of the factorial analysis were classified based on the eigen value produced for each component of the factors whose dominant value was larger than 0.5. Based on the result of data processing using SPSS it can be seen that from the analysis result for the overall design, two significant factors were obtained, namely Factor 1 with a total eigen value of 6.094 and a total variance of 36.26%, and Factor 2 with a total eigen value of 1.993 and a total variance of 56.70% (Table 6).
Table 6 Result of factorial analysis using rotated component matrix for overall design parameters.
| Rotated Component Matrixa | ||||
|---|---|---|---|---|
| Component | ||||
| 1 | 2 | 3 | ||
| Luxurious | .560 | .532 | 143 | |
| Speedy | .625 | .347 | .279 | |
| Comfort | .664 | .169 | .249 | |
| Sporty | .606 | .401 | .195 | |
| Stylish | .709 | .430 | .006 | |
| Simple | .643 | 269 | 075 | |
| Playful | .772 | .251 | .186 | |
| Outstanding | .783 | .144 | .034 | |
| Elegant | .732 | 011 | 057 | |
| Masculine | 093 | .837 | .075 | |
| Tough | .196 | .814 | 113 | |
| Futuristic | .275 | .447 | .291 | |
| Compact | .048 | 038 | .908 | |
| Eigenvalue (after rotation) | 6.094 | 1.993 | .908 | |
| % of Variance | 36.26 | 56.70 | 7.04 | |
| % Of Cumulative | 36.26 | 92.96 | 100.00 | |
| KMO | .859 | |||
One factor was selected as being outstanding, i.e. the factor with the highest variance. Regarding the design direction, the most dominant factors were Factors 1 and 2 with a total sample variance of 92.96% (Table 6). Both factors can be grouped based on type of Kansei word.
For Factor 1, there were two groups with similar words, i.e. luxurious, comfort, elegant, and simple with a total eigen value of 2.599, and speedy, sporty, stylish, fun, outstanding with a total eigen value of 3.495. Factor 1 had the highest total eigenvalue, which is represented by a playful character. Meanwhile, forFactor 2, only one group was formed, i.e. masculine, tough, futuristic with a total eigen value of 1.993, which is represented by a masculine character.
After grouping was carried out, the following design direction based on the factorial analysis with SPSS was obtained: F1 with factor name 'playful' and an eigen value of 6.904 and F2 with factor name 'masculine' and an eigen value of 1.993 (Figure 5). The factorial analysis result was processed into a plot graph based on the regression value formed from each sample of Factor 1 and Factor 2 (the dominant factors). The result was that the overall design of an electric motorcycle should have a masculine and playful character, but neither is dominant. The following is a scatter plot of the design direction for the overall design evaluation (Figure 5).
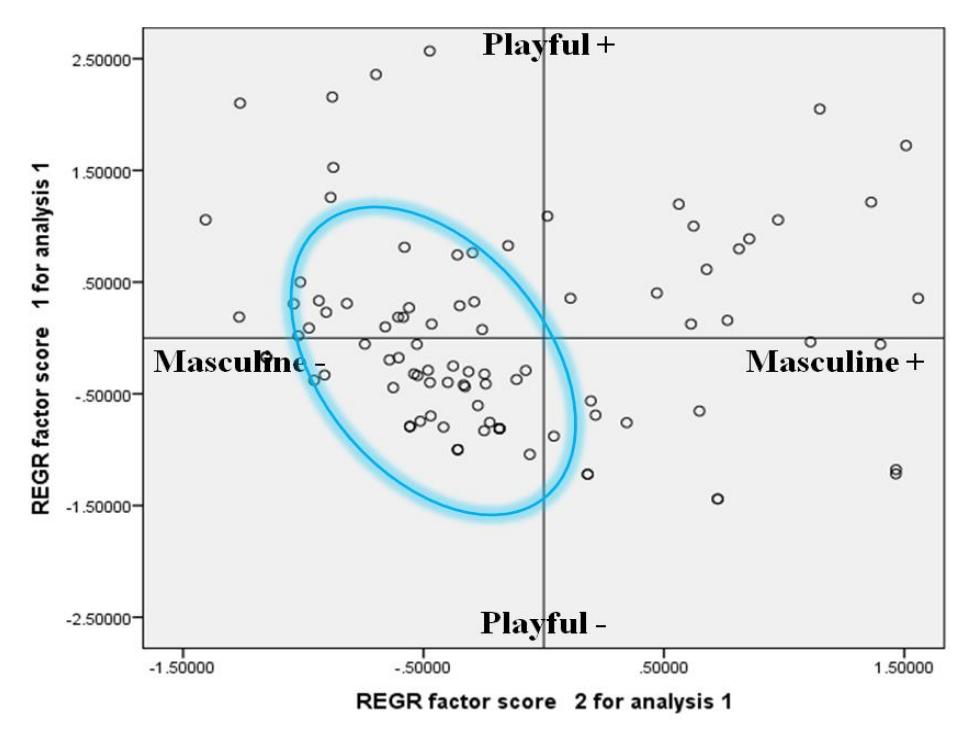
Figure 5 Scatter plot of the design direction for the overall design based on the regression value resulted from the factorial analysis.
Across analysis evaluation on the stimuli images given to the respondents when they evaluated the design revealed that models E and I, with percentages of 17.9% and 14.0% respectively, were the models that according to the respondents best represented the design direction of 'masculine' and 'playful'. The following images are scatter plot graphics for the other parameters that were used in this study (Figure 6).
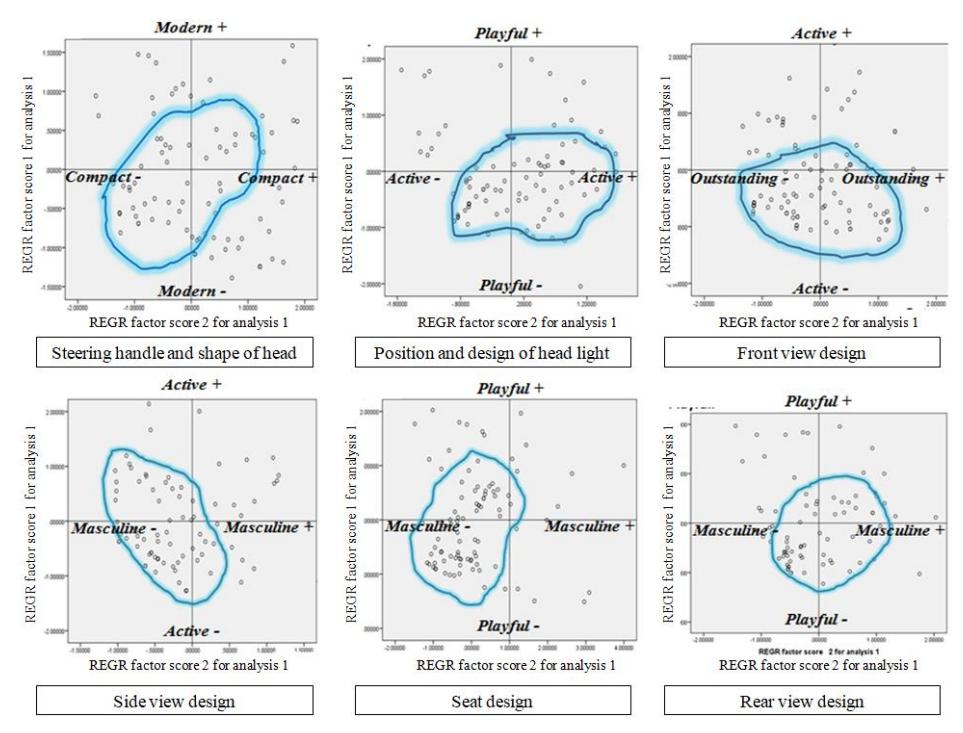
Figure 6 User persona (target character) for electric motorcycle Collection of scatter plot parameters for electric motorcycle design.
Furthermore, an evaluation related to the ideal dimensions for an electric motorcycle according to consumers was conducted. The result was that 52% of respondents chose the dimensions of the Honda BeAT as the most ideal dimensions, 25% of respondents preferred the dimensions of big scooters such as the Honda PCX and the Yamaha Nmax, and the other 23% preferred the dimensions of the Honda Vario. Therefore, it is assumed that Indonesian consumers want motorcycles with dimensions like those of the current topsegment motorcycles but with a compact appearance.
3.6 Visualization of Design Direction
Based on the analysis of opinions of the respondents who wanted to purchase a motorcycle in the future, their character from the psychographic test, respondent style and motivation to purchase electric motorcycles, the target electric motorcycle development to be achieved was set as shown in Figure 7.
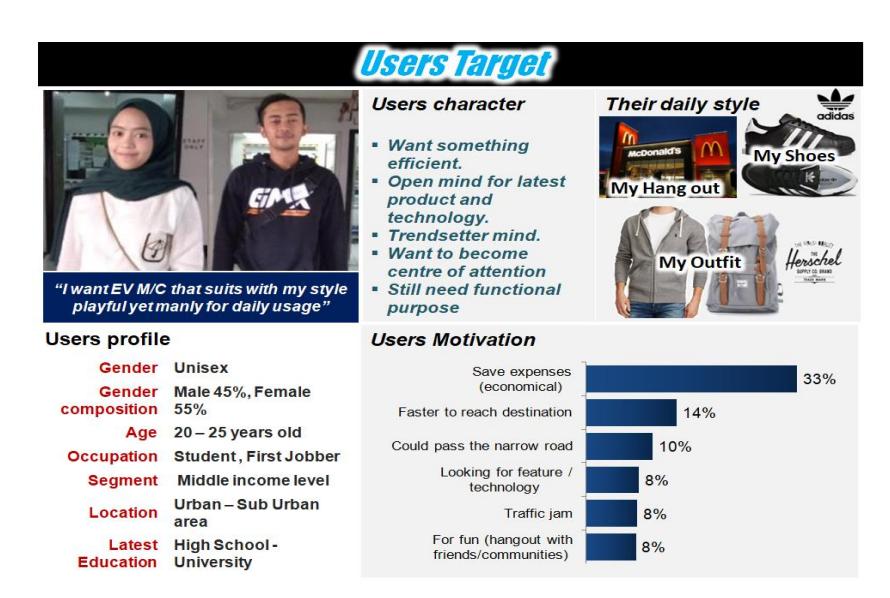
Figure 7 User persona (target character) for electric motorcycle development.
Based on factorial analysis, several design directions that can be used in the process of creating an initial design sketch were obtained as shown in Table 7.
| Design evaluation (component) | Design direction (factor) | Image reference (model) | Market name |
|---|---|---|---|
| Overall design | Playful- Masculine | Model E and Model I | Honda PCX and Honda ADV150 |
| Steering handle and shape of head | Modern- Compact | Model J and Model E | BMW and Honda PCX |
| Head light position and design | Playful-Active | Model I and Model E | Honda ADV150 and Honda PCX |
| Front view design | Active- Outstanding | Model I and Model J | Honda ADV150 and BMW |
| Side view design | Active- Masculine | Model I and model E | Honda ADV150 and Honda PCX |
| Seat design | Playful- Masculine | Model E and J | Honda PCX and BMW |
| Rear view design | Playful- | Model I and E | Honda ADV150 and |
Table 7 Collection of Kansei words as a result of factorial analysis.
Furthermore, an image board for use as reference in the process of electric motorcycle design in this study was arranged. The concept presented for this motorcycle was: Small Big Scooter EV for Youngsters, which has a compact design but looks big and has a playful and masculine overall design direction. The mentioned design direction can be seen in Figure 8.
Honda PCX
Masculine
Figure 8 Design direction to develop an electric motorcycle sketch with the Honda BeAT as the background (the Honda BeAT was taken as reference).
With the design direction that was successfully determined in the previous analysis process, the next step was to process the analysis data for creating an initial sketch and to discuss it with a designer. Based on the result of the discussion, in the initial sketching process three electric motorcycle sketches were made as stimuli for the sketch discussion (Figure 9).
Figure 9 Three electric motorcycle design alternatives based on the design direction analysis.
4 Conclusion
The potency of electric motorcycle usage in Indonesia was only 47% of total respondents and 53% of total respondents had obstacles to switch to electric motorcycles. The specifications and functional factors were the main obstacles to switching to an electric motorcycle, while economic (efficiency) and comfort were the main factors that stimulated the choice for an electric motorcycle. If the result of this study is combined with a competition analysis using Porter's Five Forces [14] for electric motorcycles, the threat of being seen as a substitute product for gasoline-fueled motorcycles is currently still large because its existing limitations are the main point of attention for motorcycle users. The minimum performance requirement related to utility was to be capable of reaching a distance of 20-30 km per day, with a speed of up to 69 km/hour on average. The purchasing motivation was to emphasize more on riding efficiency and excitement, including saving expenses, technology and having fun.
The process of the Type 1 Kansei Engineering (category classification) method as well as a descriptive analysis and factorial analysis were used to find the Kansei dimensions that were used as reference for the design direction in this study. In the phase of Kansei word 0 (zero) order, there were 13 bipolar adjectives, namely masculine-feminine, tough-gentle, luxurious-cheap, compact-big, speedy-slow, comfortable-uncomfortable, sporty-not sporty, futuristic-retro, stylish-rigid, simple-complicated, playful-boring, looking different-looking ordinary, and elegant-rough. The above adjective words were of the 1 st order Kansei dimension. Moreover, the result of the semantic differential method on the1 st order Kansei resulted in the 2 nd order Kansei as the design direction, i.e.an overall design that is playful and masculine, but still gives the impression of being compact and active. The overall design also has to give the impression of a big scooter and of functionality because respondents prefer two-seat motorcycles that can be ridden by two persons. The design direction obtained from the result of identification of the 2 nd order Kansei was interpreted visually by paying attention to physical conditions, namely compact dimensions but giving an impression of being a strong, big scooter.