
1 Introduction
Identifying consumers' emotional feelings towards products and integrating this insight in products is needed for diverse research capabilities. This includes psychological study of human behavior to find prospective buyer requirements investigated through product design and marketing [1,2]. The outcomes and research in these fields support concepts from the social sciences that further help in determining the human cognitive state of mind. The output of marketing research related to consumers in product design requires a seamless corridor
Received January 24th, 2022, Revised November 30th, 2023, Accepted for publication December 5th, 2023. Copyright © 2024 Published by ITB Institute for Research and Community Services, ISSN: 2337-5795, DOI: 10.5614/j.vad.2024.16.1.4 with different fields, such as social studies, marketing, physiology, psychology, and statistical investigations. In product design, the main objective is to untangle customer approaches, experiences, and cognitive insight [3]. Previous studies have revealed that industrial experts utilize guesses, internal insight, and years of experience to create a feasible and attractive product to fulfill consumer needs [4,5]. In the present scenario, the business environment is changing dynamically. This creates a challenging task for designers, marketing executives, and analysts to predict and clearly understand the thinking and emotional behavior changes of consumers when purchasing new products and assessing services [6-8]. Thus, various companies have tried to create a good image of their products in the current competitive marketplace by knowing the consumers' cognitive appeal for any product [9]. Social media have emerged as a communication channel between industries and prospective buyers in designing the most acceptable products and services [10]. However, the statistics suggest that social media inputs are very different from the real scenario of purchasing products. This raises questions regarding considering significant consumer opinions while designing a product for their usage. Thus, the studies revealed a gap between the interest of consumers and the designers' approach. Later, it has been observed that consumer input plays a crucial role in the success of any product [11-13].
In product design and automobile industries, the design elements are among the important characteristics based on which designers can produce well-accepted end products for the market. Since the preferences of prospective buyers significantly influence car sales, it is also a common belief that visual factors such as the form of a car, texture, and color predominately influence purchase behavior [14,15]. Visual factors of any product often affect human cognitive appeal during purchasing. The exterior design of any product provides the initial information for the consumer to recognize the product. Thus, it is required that a product's exterior design should attract consumers and communicate the right impression of its characteristics. For instance, in the earlier days of the 1980s, driving a Porsche sports car in Great Britain counted as a higher status symbol due to its exterior design. Porsche cars are portrayed as purchased by young successful executives who work for a top multinational company and earn a substantial salary package. Every Porsche owner makes a hidden statement: "I'm rich, I'm young, and I'm successful" [16]. In today's competitive marketplace, distinctive design plays a crucial role as product design has emerged as a primary factor in setting products apart. Norio Ogha, the former chairman of Sony, underscored the significance of product design by asserting, "At Sony, we operate under the assumption that our competitors' products share similar technology, pricing, performance, and features. Design stands out as the sole element that distinguishes one product from another in the market" [17]. Thus, the visual appearance plays a pivotal role in the successful product
purchase rate. There are some other factors in addition to visual factors that affect the consumer's cognitive feeling while purchasing. According to Jordan and Bloch, numerous visual/non-visual factors affect the consumers' cognitive appeal, which varies from consumer to consumer as well as from product to product [18,19]. Despite consumers forming judgments based on visual information acquired through their senses [20,21], and taking into account factors such as elegance [9], functionality [22], and the social significance of a product [23], these decisions frequently reveal a connection between perceived product characteristics that is centered on the desires of consumers rather than their needs [24].
In this paper, we discuss that apart from visual factors, non-visual factors also play a critical role in influencing the consumers' cognitive appeal. This study aimed to find out the various non-visual (N-V) factors and further investigate the relationship between the consumers' cognitive appeal related to N-V factors. These factors affect customer behavior, which is discussed with regard to purchasing a new car. Further, the designer's perception is also considered related to the aspect of newly designed cars. Nevertheless, N-V factors play a significant role, as highlighted in the comprehensive literature survey results presented in Table 1.
Table 1 List of non-visual factors of a car affecting the perceptive behavior of customers.
| Non-Visual Factors | Description | Reference |
|---|---|---|
| Self expression, social class/status, prestigious, feeling of wealth | "Individuals with elevated social standing typically wield a disproportionate level of influence, indicating that social status can be characterized by the extent of control one has over resource allocations, conflict resolution, and group decisions. Conversely, individuals with lower status often relinquish these advantages passively, yielding to those with higher status within the group. Consequently, higher social status tends to be associated with increased fitness compared to lower status, and a substantial body of evidence underscores a robust correlation between social rank and fitness or overall well-being." | [20-25] |
| Quality | "The term 'quality' is employed in a comprehensive sense to encompass all interconnected facets of a product that influence its perceived desirability, including functionality, performance, features, and reliability." Meanwhile, product quality is the primary factor that impacts the consumer-product relation and impacts the cost-effectiveness of a company. | [26-28] |
| Mileage/ fuel efficiency | "Manufacturers' and consumers' statements about how quickly fuel savings must repay any additional cost are not consistent with the theory of economically rational decision making." | [29] |
| Non-Visual Factors | Description | Reference |
|---|---|---|
| Feeling (psycho pleasure) | "The term pleasure was derived from the sensory organs such as touch and smell as well as sensual/sexual pleasure, for instance; the tactile sensation from using controls or the olfactory sensation from the smell of a new car." | [30-32] |
| Attention attraction | Luxury-liking customers desire special attention through services and products from luxury brands. They believe that if they purchase/use these things, they are considered or treated as celebrities. According to some authors, as they revealed in their studies, there is a strong relation between attention-seeking and status consumption. | [22,33] |
| Past experience / perceptions | What human beings notice of a brand is what causes he/she to make a purchase. If the human being has constructive views related to a brand, they will keep buying products off and on. As soon as a brand flourishes, they are pleased to provide the consumer with estimated importance. On the other hand, if the consumer's observed value surpasses the consumer's predictable value, they are stunned and may be attached to a particular brand for an extended period. | [33-35] |
| Ergonomic (physio pleasures) | This definition suggests that ergonomics encompasses both a social objective, focusing on well-being and an economic goal, which involves optimizing total system performance by addressing both the physical and psychological aspects of humans. Ergonomics seeks solutions in both technical and organizational realms. Performance considerations span various factors such as output volume, lead time, production flexibility, quality levels, and operating costs, among others. | [6,36,37] |
| Resale value | "Nowadays the market is changing continuously, and everyday new products are arriving in the market with new features and technology. Due to this, the term resale value of product comes into the picture. Therefore, it plays a significant role for the the success of the product and companies." | [30] |
| Emotional design | 'Human-product relations' and 'affective design' permit various kinds of personal impressions to be identified. Even though the affective design has a relation with SD, from that they examined the product meanings. Various kinds of meanings can be acclaimed in a product, such as functionality, aesthetics, symbolic values, etc., which have been given dissimilar weight in the previous work, for example, product messages, communicative functions, product appearance. Emotion are related to the above mentioned functions. | [36,38-41] |
Table 1 includes statements taken from several articles and books mentioning N-V factors that influence customers' emotional behavior during the purchase of new cars. However, the correspondance between the consumers' purchase behavior and product designers' considerations was not considered in previous studies, thus limiting the industrial growth. Numerous techniques/methods have been applied to attain and find prospective buyers' emotions relating to a product's emotional impression. For instance, at the end of the nineteenth century, Nagamachi developed a technique/approach known as Kansei engineering for product development. With this technique, the potential buyers' input (feelings or desires) is considered in linguistic form to develop future products [42]. In the early twentieth century, a semantic differential (SD) method was used to find buyers' cognitive perception for different forms/shapes of upcoming products [43]. Some researchers used the Likert scale technique to describe consumer intention related to the image of a brand. This is accomplished by focusing on the functionality and value of the brand and product [44,45]. Petiot and Yaanou [46] used a combination of the SD method, multidimensional scaling, factor analysis, and AHP to measure consumer opinions related to product semantics. The word-to-mouth technique has been used to find the relationship between the buyers' cognitive behavior and their status of consumption varying with age [9]. Luo [47] used a three-phase methodology, which includes Kansei engineering, ranking method, and SD method, to assess the cognitive response of buyers to a car wheel hub design. There are still many unsolved issues related to Kansei engineering and the SD method, which lack qualitative as well as quantitative input about consumer decisions, which is relevant to to the consumers'/designers' satisfaction. With the help of the method mentioned above, we found out the potential criteria but not their weights/preferences with respect to other criteria. Thus, other techniques may help researchers make accurate decisions related to the designers' and consumers' hidden desires related to any product.
The assessment criteria for the cognitive thinking of human beings have been studied by various researchers using a combination of AHP and fuzzy set theory [48,49]. Some other studies were conducted in which the F-AHP technique was used to resolve actual real-life problems such as supplier selection of washing machines [50] and vendor selection for competing in a volatile business environment [51]. A hybrid F-AHP approach has been used to resolve ambiguity and multi-criteria decision-making in the implementation factors that affect enterprise resource planning [49]. One assumption in the F-AHP approach is that all criteria are independent of each other. In actuality, the relationship between the criteria is quite complex and there may be interdependencies/similarities among the factors that affect the selection criteria. In the previous literature, works on finding the top N-V factors of cars are still lacking, limiting the prioritization of the perception gap between consumers and car designers. Our study aimed to pave the way in identifying the various N-V factors among consumers by considering the recent purchase of a car. Further, the top factors and their weights among experienced consumers and car designers respectively was explored. Thus, our study provides excellent
support to industrial experts by providing them a platform to understand the cognitive thinking of designers and consumers, generalized to any product.
2 Aim and Methodology
The understanding of consumer desire in the initial stage is the main requirement for the development of a product [52,53]. Furthermore, Bloch stated that the form of any product produces emotional responses in human beings [54]. The blend of cognitive perception and emotional feelings eventually convey the behavioral reactions of humans [55]. These responses can be utilized to study consumer requirements, which can ultimately guide the development of a new product. Thus, studying the purchasing habits of their customers is not only a requirement for multinational industries but it scales from medium, small, and micro enterprises (MSMEs) to entrepreneurs and even start-ups, which may help them to examine consumer behavior to achieve business success.
Aim: In this work, we investigated the top N-V factors that affect the perception of both potential customers and industrial designers of a car considered as a product. The mapping of the consumers' cognitive perception was done just before or after purchasing a new car. In addition, the cognitive feelings of industrial experts for the new product was examined. This study approach is relatively novel, as it recognizes a realistic scenario, involving in-depth study of the behavior of consumers and product designers reviewed on the ground.
Methodology: According to Blessing and Chakrabarti [56] the whole motive of design studies is to "make the design more effective and efficient, to allow design exercise to develop more effective and popular products". They developed their Design Research Methodology with the intention of anchoring a highly rigorous methodology to initiate design research. Many researchers from different fields and designers use this methodology to create new products and succeed in the competitive market. These studies convey the theoretical finding in design studies through critical sampling difficulties [57], assessing the design research quality [58], and examining the influence of design support in susceptible rural communities [59]. During this study, a two-phase methodology was applied for prioritizing the top N-V factors among consumers and designers related to the perception of cars. In the first phase (Phase I), we used literature and an open-ended survey for determining the non-visual factors. A mathematical technique was then used to identify the top N-V factors that affect the likeness and purchase behavior of consumers at the time of purchasing a car. In the next phase (Phase II), we used F-AHP to determine a comparative understanding of the factors from the consumers and the designers points of view. Section 3 discusses Phase I and II of this work.
In light of this context, the remainder of this manuscript is structured as follows: In Section 1, we critically review previous articles in related research areas that convey the gap in understanding of consumer and designer behavior. In Section 2, we describe the methodology used to obtain the data for the present study. The collection of the data is explained in Section 3. Further, the results collected from the surveys are presented in Section 4 and Section 5 discusses the outcomes of the current work. Finally, we conclude in Section 6, also providing future aspects of the work.
Identification of the different non-visual factors from the literature review as well as from a consumer perspective (Phase I): First, we conducted an extensive literature survey and listed all the non-visual factors affecting consumers' cognitive appeal during a car purchase. Various non-visual factors were obtained through a comprehensive literature survey, as shown in Table 1. We searched with the Springer, Willy, and Elsevier search engines for articles with keywords such as 'class', 'status', and 'feeling' to find suitable references, as mentioned above.
2.1 Participants Details
In this work, to determine the additional N-V factors and their importance, an open-ended survey was conducted. This allows to recognize the dominant nonvisual factors among consumers and designers for car purchase. In this whole study, we met with a total of 135 prospective participants and 10 industrial designer/experts. Initially, a pilot survey with 15 participants was conducted which was then followed by the main survey with 110 participants. After the pilot survey, the questions were tweaked to provide more clarity to them. During the pilot experiment, the factors obtained from the literature were provided to the participants as examples of N-V factors. However, it was observed that the participants were vastly influenced by the list provided, which affected the credibility of the survey, as the participants' thought process was not recorded. This generated the idea of conducting the survey by only providing a few factors from the literature as sample factors. A copy of the survey questions is provided in Appendix 1, and the details of the participants are given in Table 2. Additionally, in the final survey, we also asked all the participants to rank the N-V factors affecting cars purchase, according to their preference from 1 to 10.
In Phase I, we have considered participants from different age groups ranging from 18 to 40 years, which included students, novice designers, technical, and non-technical employees in an educational institute. The participants had different cultural backgorunds and came from different states of India. We visited universities for unbiased data collection to get senior research students and staff participants. The integrity of this work was improved by considering participants from different industries and design studios, where experienced automobile designers shared their concealed perspective. We met 110 potential participants, and among them, 86 responses were valid and helpful for our research work. These 86 participants were 66 males and 20 females. Responses of 24 participants (out of 110) were discarded due to invalid or insufficient information, including not purchasing a car in the last six months or incompletely filling out the survey form. Appendices 1 shows the survey form used to collect non-visual factors (Table 12).
Table 2 Participant details for Phase I and Phase II.
| Participant Details: Phase I | |||||||||
|---|---|---|---|---|---|---|---|---|---|
| Gender | Living Place | Age Group | |||||||
| Total | 86 | 100% | Metro City | 17 | 19% | 18-30 | 46 | 53% | |
| Male | 66 | 76% | City | 50 | 59% | 31-40 | 36 | 42% | |
| Female | 20 | 24% | Town | 19 | 22% | 41-50 | 4 | 5% | |
| Education | Number of Participants | Percentage | |||||||
| Graduate | 65 | 76% | |||||||
| Post Graduate | 14 16% | ||||||||
| Other | 7 | 8% | |||||||
| Area of Expertise | Participants Education Background | Percentage | |||||||
| Science | 13 | 15% | |||||||
| Arts | 4 | 5% | |||||||
| Engineering | 60 | 70% | |||||||
| Management | 7 | 8% | |||||||
| Commerce | 2 | 2% | |||||||
| Participant Details: Phase II | |||||||||
| Designer | Working Area | Sex | Experience | Consumer | Working Area | Sex | Driving Experience | ||
| 6 | Automobile | M | 5 years avg. | 6 | Approx. ten years of working experience | M | 5 years avg. | ||
The participants in the study had a minimum of 4 years of driving experience. Postdoctoral candidates from the institute, who all had cars and a lot of driving experience, were among the attendees. Additionally, we had M.Des students from the university's transportation department who were aspiring new designers for the auto industry. The technical participants were professors from various universities with more than five years of driving experience, some of whom had just purchased a new vehicle. On the other hand, the non-technical staff members included people with plenty of driving experience who worked in the management and clerical fields. All participants signed consent forms, and their names and precise ages were kept secret throughout the study to maintain confidentiality. To give a thorough overview of the participants' backgrounds and experiences, we defined these aspects in typical terms. We aimed to respect the participants' privacy while still obtaining valuable insights for the study by guaranteeing anonymity and using general descriptions. This diverse group of participants – with varying expertise and backgrounds – enriched the study by offering a thorough perspective on the non-visual factors influencing their cognitive behavior about car purchase and design. We could understand the subject better and arrived at insightful conclusions thanks to their contributions and experiences.
3 Data Collection
Phase I: During the open-ended survey, participants added their preferences according to their choice. After that, we segregated all the N-V factors based on their rank (i.e., from 1st, 2nd, 3rd, and up to the 10th rank). The responses of all participants differed in ranking as it was observed that some participants gave first preference/rank to reliability, while others gave it to status, safety, or other N-V factors, as shown in Table 3.
| S. N. | Participant | Rank 1 | Rank 2 | Rank 3 | Rank | Rank 10 |
|---|---|---|---|---|---|---|
| 1 | Participant 1 | Ergonomics | Reliability | Past exp. | Quality | |
| 2 | Participant 2 | Feeling | Innovative features | Fuel efficiency | Past exp. | |
| 3 | Participant 3 | Status/feeling of prestige | Ergonomics | Innovative Technology | Fuel- efficiency | |
| 4 | Participant 4 | Comfort zone | Reliability | Feeling of prestige | Materialistic | |
| 125 | Participant 110 | New Technology | Ergonomics | Attention | Safety |
Table 3 Ranking of N-V factors by the participants.
As evident from Table 3, the ranks were different for different factors. Therefore, to develop a list of factors that expresses the cumulative rank of various non-visual factors, the rank value and the average value methods were used. First, we developed a simple multiplication method (called the rank value method). We allocated the highest multiplication factor (here 10) to the topmost factor and then 9 to the next lower factor and so on, according to each factor's occurrence and position. By multiplying the factors, the total frequency with its corresponding multiplication factor gave a comparative value for each factor in each rank. Then, these values were compared to develop participant preference lists, as shown in Table 4. The partial studies are included in Table 4, which shows only 2 non-visual factors out of 19.
The eighty-six participants from India provided a diverse group for the study, including graduates and professionals with essential positions in the public or private sectors or currently interning. Twenty percent of the participants were women, but men made up the majority. Geographically, the participants came from various areas; roughly 56% were from urban areas, 19% were from major cities, and the remaining 22% were from rural areas. Notably, the study ignored cultural considerations to concentrate on preference-related factors. However, the geographical context and other pertinent factors will be appropriately considered in future research. The results of this study provided insightful information about the preferences of educated people from various backgrounds and laid the foundation for future research that will explore more general topics like cultural influences and regional differences.
Table 4 Partial table showing 4 out of 19 N-V factors, their rank frequency, and total values, after multiplying with the multiplication factor.
| Reliability | Comfort/Ergonomics | ||||||
|---|---|---|---|---|---|---|---|
| Rank | Frequency | Multiplication Value | Total Score | Rank | Frequency | Multiplication Value | Total Score |
| 1 | 3 | 10 | 30 | 1 | 5 | 10 | 50 |
| 2 | 12 | 9 | 108 | 2 | 11 | 9 | 99 |
| 3 | 5 | 8 | 40 | 3 | 5 | 8 | 40 |
| 4 | 9 | 7 | 63 | 4 | 7 | 7 | 49 |
| 5 | 11 | 6 | 66 | 5 | 1 | 6 | 6 |
| 6 | 1 | 5 | 5 | 6 | 3 | 5 | 15 |
| 7 | 3 | 4 | 12 | 7 | 0 | 4 | 0 |
| 8 | 0 | 3 | 0 | 8 | 1 | 3 | 3 |
| 9 | 1 | 2 | 2 | 9 | 0 | 2 | 0 |
| 10 | 0 | 1 | 0 | 10 | 0 | 1 | 0 |
| 326 | 262 | ||||||
Table 4 demonstrates that while purchasing a car, according to 12 participants, reliability is the second top N-V factor. Thus, in the fourth row of the table with 12 as the frequency and 9 as the multiplication factor, a subtotal of 108 was obtained. Additionally, from Appendices 2 and Table 13, we see 20 N-V factors stating 'new technology' and 'new features', which can be considered as the same according to various articles, blogs, and books and thus, were merged in the study. The above analysis and segregation allowed to find the 19 most frequent N-V factors that should be considered while purchasing or designing cars, as shown in Table 5.
However, it was noticed that few participants also considered the design of the car as an N-V factor that impacted their purchase. The examples included that consumers preferred brand A over brand B on the basis of their designs. Here, a particular form of a car is not referred to; instead, the entire gamut of the forms of cars made by these companies was referred to. Our next step was to select the top N-V factors. However, based on their subtotal values it was difficult to choose which factors were signifcantly important. Therefore, to identify the top non-visual factors from Table 5, the inverse Pareto principle (i.e., 80/20 rule) was used; a detailed description of the inverse Pareto principle is provided below. Detailed studies among designers and consumers will be carried out to find the top N-V factors.
Table 5 Rank value method and average method summary of N-V factors.
| Rank/Average Value Method | ||||||||
|---|---|---|---|---|---|---|---|---|
| Sl no. | Factor | Subtotal | Average Weight | |||||
| 1 | Average mileage/fuel efficiency | 561 | 8.428 | |||||
| 2 | New technology/features | 535 | 9 | |||||
| 3 | Reliability | 326 | 6.833 | |||||
| 4 | Status/feeling of prestige/materialistic | 315 | 6 | |||||
| 5 | Quality | 275 | 3.286 | |||||
| 6 | Ergonomics | 262 | 5.286 | |||||
| 7 | Design/form* | 256 | 4.571 | |||||
| 8 | Past experience | 214 | 4.571 | |||||
| 9 | Safety | 163 | 3.625 | |||||
| 10 | Cost/budget | 148 | 1.571 | |||||
| 11 | Attention | 146 | 3.111 | |||||
| 12 | Resale value | 106 | 2.25 | |||||
| 13 | Warranty | 102 | 1.556 | |||||
| 14 | Service center | 70 | 1.142 | |||||
| 15 | Brand | 62 | 0.174 | |||||
| 16 | Accomplished feeling | 24 | 0.571 | |||||
| 17 | Power | 24 | 1 | |||||
| 18 | Culture | 10 | 1 | |||||
| 19 | Number of seats | 9 | 0.2 | |||||
Pareto principle: The Pareto principle, also known as the 80/20 rule or Pareto's principle of unequal distribution, was coined by economist Vilfredo Pareto [60,61]. According to Pareto, 20% of the Italian country's population holds less or more than 80% of the wealth (or its total income) of the rest of population. With the help of this principle, scarce resources are effectively allocated among all. Therefore, it is quite essential to note that this rule was applied in the current study as it does not consider the up and down probability but rather considers the major factors affecting the perspective of the consumer and designer. Thus, an inverse Pareto chart was created with the Pareto principle or 80/20 rule, as shown in Figure 1.
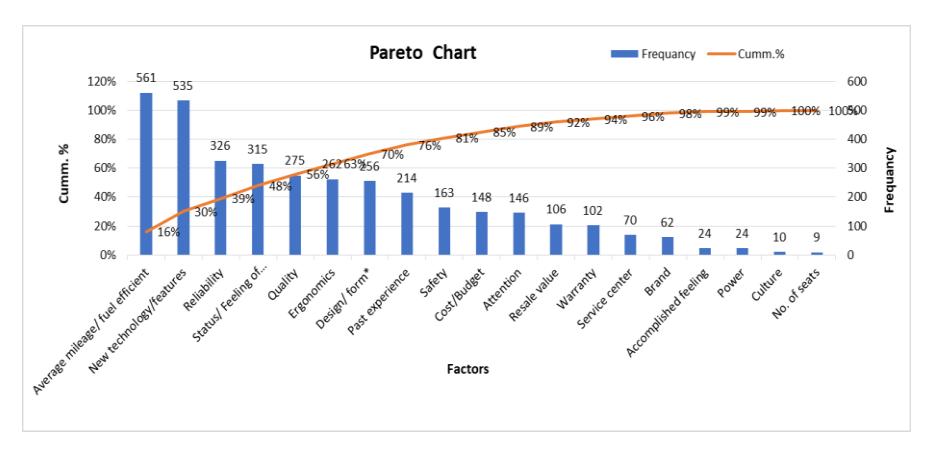
Figure 1 Inverse Pareto chart for N-V factors affecting consumer cognition during car purchase.
The principle suggests that out of the 19 N-V factors, 9 factors were mentioned by 80% of the participants, while the remaining 11 factors were mentioned by 20% of the participants. Therefore, we eliminated the rest of the 11 N-V factors because their contribution was only up to 20% or less. Table 6 shows the 9 N-V factors. On the other hand, the calculation of this inverse Pareto principle is given in Appendices 4, and represented in Table 15. Figure 1 shows the Pareto chart of all the non-visual factors and we observed that there were only nine non-visual factors that influenced prospective consumers' decision-making while purchasing new cars. However, these 9 factors still could not be ranked on the basis of importance. To find the answer, an appropriate approach was required, which will be discussed later.
Table 6 List of N-V factors from the Pareto principle.
| Reliability | Status/Feeling of Prestige | Average Mileage/Fuel-Efficient |
|---|---|---|
| Quality | Design/form | New technology/new features |
| Ergonomics | Safety features | Past experience |
Note: A brief description of all these above mentioned factors are given below.
Social class/status, feeling of prestige/wealth: Individuals with higher social status often wield a disproportionate level of influence, characterized by their command over resource allocation, management of conflicts, and participation in group decisions [20]. In contrast, individuals with lower social status often relinquish these advantages passively, yielding to members of higher status within the group. Consequently, higher social status tends to correlate with increased fitness compared to lower social status, and a substantial body of evidence supports a robust connection between social rank and fitness or wellbeing [21,62]. Berger and Kraus explain social status as "status inequalities generated by expectations about future performances". "A number of researchers have asserted that social status is one of the persuasive cues of the source that has the potential to generate social influences" [63,64].
Quality: The term 'quality' is employed here in a broad sense to encompass all interconnected aspects of a product that influence its perceived desirability, including functionality, performance, features, and reliability. Simply put, the perceived quality levels of a product may vary between two periods. This is swiftly becoming a key competitive issue in the current market scenario [65].
Mileage/fuel-efficiency: According to Greene's study, consumers' statements about how quickly fuel savings must repay any additional costs are not in line with the theory of economically rational decision-making. "What matters is how much money we will be spending on fuel over the lifetime of driving a car" [29]. For several years, vehicle makers in India have emphasized fuel efficiency through km/l values to attract consumers. However, consumers often lack awareness of the quantitative calculation of fuel efficiency in conjunction with the cost of fuel over the vehicle's lifetime or an extended period, such as five years. Consider this scenario: when presented with the choice of purchasing a car that provides 15 km/l at ₹5 lakh and another car with an efficiency of 12 km/l priced at around ₹4.5 lakh, consumers tend to opt for the lower-cost car. Many consumers perceive that the fuel efficiency difference between a car offering 15 km/l and one providing 12 km/l is not significant. Behavioral science studies reveal that making such calculations is not intuitive for most people; instead, they rely on simple rules of thumb to make quick decisions, leading to biases and errors.
Ergonomics: "The definition suggests that ergonomics encompasses both a social objective, focusing on well-being, and an economic objective, aiming for total system performance. It considers both the physical and psychological aspects of humans, seeking solutions in both technical and organizational domains. Performance aspects within this context may encompass factors such as output volume, lead time, production flexibility, quality levels, and operating costs, among others" [42].
Reliability: Reliability has a deep impact on our day to day life. In technical manner, reliability is described as the possibility that an object accomplishes its expected activity without failure under defined environment for a specified duration. In engineering terms, a product/object is trustworthy when it functions well in a specific way in the knowledge that failures are unavoidable [66].
Safety feature: "Safety features are elements incorporated into products or services to ensure user safety." In the context of the Asian market, there has been a decision to develop a new product specifically targeting young adults making their first car purchase. The aim is to create a modern car equipped with state-of-the-art safety features while still being budget-friendly [67].
New technology/features: The technology is designed to tackle safety concerns linked to human-related errors, enhancing mobility for both the elderly and individuals with disabilities. In the realm of car psychology, driving is frequently viewed as a manifestation of the driver's self-identity [68,69]. Beyond its instrumental aspect of providing mobility, driving is often perceived as adventurous, thrilling, and pleasurable. Engaging in driving fosters a sense of control, capability, strength, efficiency, comfort, and entertainment for the driver [70]. "Through driving, the driver develops a sense of control, capability, strength, efficiency, comfort and entertainment."
Past experience: What people notice of a brand is what causes he/she to make a purchase. If a person has constructive views related to a brand, they will keep buying products off and on. Once the brands flourish, they are pleased to provide the customer with esteem and importance. Alternatively, if the customer's observed value surpasses the cosntumer's predictable value, they are stunned and might be attached to a particular brand for an extended period." [34]
Design/unique form: "Automotive design is a creative process used to define the physical appearance of motor vehicles such as cars, trucks, motorcycles etc. It encompasses interior and exterior design." [71]
Phase II: So far, the nine non-visual factors were investigated, however, the above-mentioned methods are insufficient to determine the ranking of these factors. A multi-criteria decision-making technique such as Saaty's AHP or the F-AHP approach can be used to find the top non-visual factor. However, there are some boundaries associated with Saaty's AHP approach, which are as follows: (i) it cannot manage the impreciseness and vagueness in human decision-making; (ii) Saaty's AHP approach uses an unbalanced scale of judgment; (iii) preferences of decision-makers broadly impact the end results of the traditional AHP approach. Considering these drawbacks, a fuzzy-based analytical hierarchy process was used in this research work [72,73]. The F-AHP process has the advantage of handling the imprecise and ambiguous judgment of professionals. It has mostly been used for decision-making in several areas, which include the planning for the selection of underground mining [74], selection of best renewable alternatives [75], location selection for a thermal
power plant [76], and many others. The steps involved in fuzzy AHP are as follows:
Step 1. Defining the scale of relative importance used in a pair-wise comparison matrix .
In this step, the triangular Fuzzy numbers (TFNs), 1 to 9 are used to improve the orthodox nine-point scale, as provided in Table 7. The fuzziness of consumers' qualitative assessments are taken into consideration by defining the nine TFN's with an equivalent relationship function.
Table 7 Characteristic function of the fuzzy number (Triangular Fuzzy Number of linguistic comparison matrix).
| Linguistic Variables | Triangular Fuzzy Number | Triangular Fuzzy Reciprocal Number |
|---|---|---|
| Equally strong | 1 = (1, 1, 1) | (1, 1, 1) |
| Intermediate | 2 = (1, 2, 3) | (1/3, 1/2, 1) |
| Moderately strong | 3 = (2, 3, 4) | (1/4, 1/3, 1/2) |
| Intermediate | 4 = (3, 4, 5) | (1/5, 1/4, 1/3) |
| Strong | 5 = (4, 5, 6) | (1/6, 1/5, 1/4) |
| Intermediate | 6 = (5, 6, 7) | (1/7, 1/6, 1/5) |
| Very strong | 7 = (6, 7, 8) | (1/8, 1/7, 1/6) |
| Intermediate | 8 = (7, 8, 9) | (1/9, 1/8, 1/7) |
| Extremely strong | 9 = (9, 9, 9) | (1/9, 1/9, 1/9) |
Step 2. Construct the fuzzy comparison matrix
With the help of TFN, the decision group constituted by the experienced consumers and designers was further asked to make pairwise comparisons of the criteria. A matrix was constructed according to the arithmetic mean of the pairwise comparisons from the decision group.
\[A = \begin{bmatrix} 1 & a_{12} & \cdots & a_{1n} \\ a_{21} & \vdots & \ddots & \vdots \\ \vdots & \ddots & \ddots & \vdots \\ a_{n1} & a_{n2} & \cdots & 1 \end{bmatrix}\] Eq. (1)
Where , if 'i' is equal to 'j' and or if 'i' is not equal to 'j'. When scoring is conducted for a pair, a reciprocal value is automatically assigned to the reverse comparison within the matrix (i.e., = matrix score assigned to the comparison of factors 'i' to factors 'j', then ).
Step 3. Converting the fuzzy comparison matrix into a crisp comparison matrix
In this matrix, all experts provided their scores, which were converted into a triangular fuzzy number. If there is an 'n' number of experts, then the final value for a particular factor is given by adding all the scores and divided by the number of experts (i.e., 'n').
Step 4. Finding the fuzzy geometric mean value (ri)
\[\text{[rumus tidak dapat ditampilkan dengan baik — lihat PDF asli]}\]
The above-mentioned multiplication procedure was used to find out the fuzzy geometric mean value for all factors.
Step 5. Finding the fuzzy weights (fwi)
The mathematical expression considered to find the fuzzy weights (fwi) for each factor is given below:
\[\begin{split} fw_i &= \left[ r_i * \left( r_1 + r_2 + \cdots r_n \right)^{-1} \right] \\ \text{whereas,} \qquad & r_1 + r_2 = \left( l_1, m_1, n_1 \right) + \left( l_2, m_2, n_2 \right) = \\ \left( l_1 + l_2, m_1 + m_2, n_1 + n_2 \right) \\ \left( r_1 + r_2 + \cdots r_n \right)^{-1} &= \left( l_s, m_s, n_s \right)^{-1} \\ &= \left[ \frac{1}{n_s}, \frac{1}{m_s}, \frac{1}{l_s} \right] \end{split}\]
After getting the value of for each criterion, the corresponding criteria was multiplied with each value and the fuzzy weights for particular criteria was calculated.
Step 6. After finding the fuzzy weights (fwi), the next step was to find out the weights for each criterion by using center of the area (COA),
\[\mathbf{w}_{i} = \left(\frac{1+m+n}{3}\right)\] Eq. (4)
Step 7. After finding the fuzzy weights ( ), we normalized and got the respective weights for each criteria as 'NWi'.
We found nine factors based on the Pareto principle as shown in Table 6. A total of 10 experienced consumers and 10 industrial designers/experts was contacted through in-person. Both six out of the ten designers as well as consumers agreed to be a part of this sudy. The details of the designers and consumers are provided in Section 3. The industrial designers were associated with automobile industries. The identified non-visual factors were given to the industrial professional/designers and consumers who had purchased cars. The open-ended survey (questionnaire) given to the designers and consumers was made with the help of using the characteristic function of the fuzzy number using TFNs of linguistic comparison matrix.
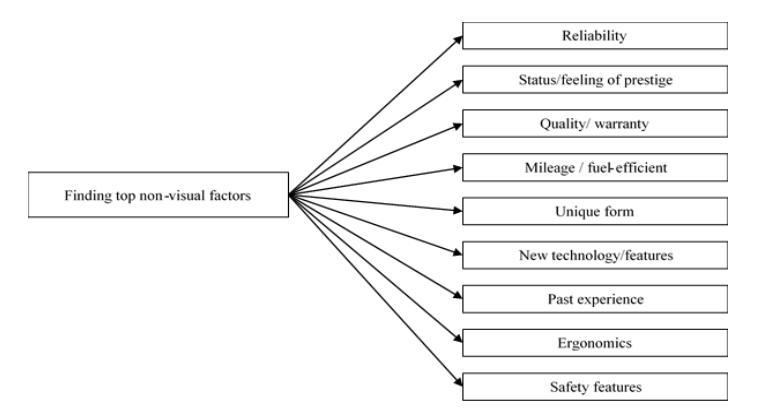
Figure 2 List of N-V factors for weightage identification.
Further, the perceptions of the consumers and designers were obtained relative to the importance of each non-visual factor with respect to other factors. Then, a fuzzy-AHP technique was used to obtain the weights for each non-visual factor against the other factors. The weights provided by the consumers and designers were compared with each other to see whether there was any difference in cognitive thinking between designers and consumers.
4 Results and Analysis
Using the Pareto principle, we collected the top nine N-V factors, as shown in Table 6. However, some of the participants gave higher preference to one factor, while some preferred another factor. We used an F-AHP to get weights for the N-V factors to solve this problem. They identified nine N-V factors that were given to six designers and six consumers who owned a car. Next, the designers were requested to give their opinion using fuzzy numbers about the relative importance of each N-V factor with respect to the remaining factors. Then, the F-AHP approach was used to obtain the weight for each N-V factor. The weights provided by each designer was compared with the weights provided by the consumers by using factorial analysis to ascertain whether there was any gap between the perception of the consumers and the designers. The questionnaire is shown in Appendices 2. However, before conducting the final
survey, we first conducted a pilot study. In the pilot study (second pilot for Phase II), we considered 6 consumers and 6 designers to prioritize the factors using the scale given in Table 7. The pilot experiment conveyed the clarity of the questionaire, considering the level of understanding about the questions required of the designers and consumers. Further, valuable input obtained from the pilot study was included in the final survey. At the time of the final survey, 36 open-ended comparative questionnaires in matrix form were made by considering the scale of Table 7. A pair-wise comparision matrix obtained from the consumers and designers was constructed using a lignuistic scale, as shown in Table 8 and Table 9, respectively. This pair-wise matrix was used to calculate the weights of each factor, as discussed in the previous section. All 6 consumers had experience in driving cars and had purchased a car in the last 2 years. The designers with a minimum working experience of 5 years were considered.
Table 8 Comparison matrix to obtain weights from consumers for the N-V factors.
| C1 | C2 | C3 | C4 | C5 | C6 | C7 | C8 | C9 | |
|---|---|---|---|---|---|---|---|---|---|
| C1 | (1, 1, 1) | (6.5, 7.17, 7.83) | (2, 2.67, 3.33) | (0.241, 0.33, 0.56) | (4.83, 5.833, 6.833) | (3.93, 4.639, 5.417) | (0.171, 0.21, 0.275) | (1.889, 2.42, 3.0) | (0.613, 0.653, 0.76) |
| C2 | (0.128, 0.14, 0.154) | (1, 1, 1) | (1.56, 2.242, 2.93) | (0.16, 0.199, 0.26) | (1.44, 2.0, 2.667) | (0.528, 0.61, 0.833) | (0.5, 0.91, 1.45) | (0.48, 0.667, 0.88) | (0.13, 0.145, 0.17) |
| C3 | (0.30, 0.375, 0.5) | (0.34, 0.45, 0.64) | (1, 1, 1) | (0.14, 0.159, 0.19) | (2.556, 3.42, 4.33) | (2.556, 3.25, 4) | (0.79, 1.17, 1.583) | (2.08, 2.764, 3.47) | (3.667, 4.5, 5.333) |
| C4 | (1.786, 3.03, 4.15) | (3.85, 5.03, 6.135) | (5.26, 6.29, 7.299) | (1, 1, 1) | (6.33, 7.33, 8.333) | (5.67, 6.67, 7.667) | (5.88, 6.389, 7.25) | (5.67, 6.67, 7.667) | (1.408, 1.93, 2.47) |
| C5 | (0.146, 0.17, 0.207) | (0.375, 0.5, 0.694) | (0.231, 0.293, 0.39) | (0.12, 0.14, 0.158) | (1, 1, 1) | (2, 2.833, 3.667) | (0.354, 1.08, 0.56) | (0.372, 0.45, 0.653) | (0.13, 0.15, 0.179) |
| C6 | (0.185, 0.22, 0.254) | (1.2, 1.64, 1.894) | (0.25, 0.308, 0.39) | (0.13, 0.15, 0.176) | (0.28, 0.353, 0.5) | (1, 1, 1) | (1.22, 2.083, 3) | (0.354, 0.41, 0.561) | (0.18, 0.215, 0.28) |
| C7 | (3.636, 4.77, 5.848) | (0.69, 1.11, 2) | (0.632, .857, 1.263) | (0.138, 0.16, 0.17) | (1.783, 0.93, 2.825) | (0.333, 0.48, 0.818) | (1, 1, 1) | (1.06, 1.583, 2.17) | (0.31, 0.34, 0.381) |
| C8 | (0.333, 0.414, 0.53) | (1.135, 1.5, 2.101) | (0.29, 0.36, 0.482) | (0.130, 0.15, 0.176) | (1.531, 2.22, 2.688) | (1.783, 2.45, 2.825) | (0.46, 0.63, 0.947) | (1, 1, 1) | (0.15, 0.178, 0.22) |
| C9 | (1.323, 1.53, 1.631) | (5.88, 6.897, 7.94) | (0.188, 0.22, 0.27) | (0.41, 0.518, 0.71) | (5.59, 6.579, 7.576) | (3.54, 4.651, 5.714) | (2.63, 2.985, 3.226) | (4.57, 5.618, 6.667) | (1, 1, 1) |
Note: Reliability (C1), Status/feeling of prestige (C2), Quality/ warranty (C3), Mileage/fuel-efficiency (C4), Unique form (C5), New technology/features (C6), Past experience (C7), Ergonomics (C8), Safety features (C9).
Table 8 shows a comparison of criterion C1 (reliability) with respect to the other 8 criteria (factors). In row 2, we can see that the consumers preferred criterion C2 (Status/feeling of prestige) over C1 and vice versa. Similarly, we can see the preference of the C1 criterion on other criteria or vice versa.
Table 9 Comparison matrix to obtain weights from designers for the N-V factors.
| C1 | C2 | C3 | C4 | C5 | C6 | C7 | C8 | C9 | |
|---|---|---|---|---|---|---|---|---|---|
| C1 | (1, 1, 1) | (5.333, 6.167, 7) | (1, 1, 1) | (4.167, 5, 5.833) | (3.667, 4.67, 5.667) | (2.556, 3.25, 4) | (2.367, 2.71, 3.056) | (1.216, 1.56, 1.913) | (0.114, 0.128, 0.147) |
| C2 | (0.143, 0.16, 0.188) | (1, 1, 1) | (0.132, 0.149, 0.174) | (0.167, 0.12, 0.253) | (0.337, 0.39, 0.511) | (0.97, 1.180, 1.456) | (1.42, 1.61, 1.802) | (0.296, 0.32, 0.363) | (0.140, 0.165, 0.2) |
| C3 | (1, 1, 1) | (5.747, 6.711, 7.576) | (1, 1, 1) | (3.83, 4.833, 5.833) | (0.137, 0.16, 0.189) | (1.53, 1.694, 1.867) | (3.03, 3.542, 4.056) | (2.67, 3.333, 4) | (0.272, 0.288, 0.309) |
| C4 | (0.171, 0.2, 0.24) | (3.953, 8.475, 5.989) | (0.171, 0.21, 0.261) | (1, 1, 1) | (6.5, 7.5, 8.5) | (5.33, 6.333, 7.33) | (2.21, 2.718, 3.228) | (0.16, 0.183, 0.225) | (0.137, 0.16, 0.192) |
| C5 | (.176, 0.214, 0.273) | (1.957, 2.571, 2.967) | (5.29, 6.289, 7.299) | (0.12, 0.133, 0.154) | (1, 1, 1) | (0.35, 0.403, 0.5) | (1.589, 2.11, 2.639) | (0.135, 0.16, 0.185) | (0.118, 0.134, 0.16) |
| C6 | (0.25, 0.308, 0.391) | (0.687, 0.847, 1.031) | (0.54, 0.590, 0.656) | (0.136, 0.16, 0.186) | (2, 2.481, 2.857) | (1, 1, 1) | (0.65, 0.861, 1.111) | (0.604, 0.794, 1) | (0.259, 0.266, 0.280) |
| C7 | (0.327, 0.37, 0.422) | (0.555, 0.623, 0.705) | (0.25, 0.282, 0.33) | (0.31, 0.368, 0.452) | (0.38, 0.474, 0.629) | (0.9, 1.163, 1.538) | (1, 1, 1) | (1.733, 2.25, 2.778) | (3.7, 4.208, 4.722) |
| C8 | (0.523, 0.64, 0.822) | (2.755, 3.106, 3.378) | (0.25, 0.3, 0.375) | (4.444, 5.46, 6.452) | (5.405, 6.41, 7.407) | (1, 1.259, 1.656) | (0.36, 0.444, 0.577) | (1, 1, 1) | (1.111, 1.3, 1.5) |
| C9 | (6.80, 7.813, 8.772) | (5, 6.061, 7.143) | (3.236, 3.472 3.676) | (5.208, 6.25, 7.3) | (6.45, 7.463, 8.48) | (3.57, 3.759, 3.861) | (0.21, 0.238, 0.27) | (0.67, 0.769, 0.9) | (1, 1, 1) |
Note: Reliability (C1), Status/feeling of prestige (C2), Quality/warranty (C3), Mileage/fuel-efficiency (C4), Unique form (C5), New technology/features (C6), Past experience (C7), Ergonomics (C8), Safety features (C9).
In Table 9 we show a comparison of factor C1 (reliability) with respect to the other eight factors. Similarly, a comparison of factor C2 was done with respect to the other seven factors, up to factor C8 (i.e. ergonomics) with respect to the last factor C9 (i.e. safety). The numerical values in Table 9 were the input of the average values of all 6 designers. Table 14 shown in Appendices 3 illustrates the preferences a designer (D1) gave to one factor compared to the other factors. Let us see an example: the C2 value corresponds to C1, i.e. (5.333, 6.167, 7). This value is the average of the input from 6 designers in the open-ended questionnaire by using the scale from Table 7, as shown below. Since, D1 = 9 =
(9, 9, 9), D2 = 8 = (7, 8, 9), D3 = 5 = (4, 5, 6), D4 = 5 = (4, 5, 6), D5 = 5 = (4, 5, 6), and D6 = 5 = (4, 5, 6) were the values given by the six designers and the average of these values is shown in the second row, third column (i.e. (5.333, 6.167, 7)) of Table 9, where D1, D2…, D6, were considered as the designers' input. On the other hand, due to size constraints, we show only 1 designer's input (Table 14).
| Designers | Consumers | ||||||||
|---|---|---|---|---|---|---|---|---|---|
| ri | Wi | Wi | Nwi | ri | Wi | Wi | Nwi | ||
| C1 | (1.599, 1.85, 2.10) | (0.13, 0.174, 0.228) | 0.178 | 0.17 | C1 | (1.315, 1.57, 1.91) | (0.09, 0.132, 0.195) | 0.139 | 0.13 |
| C2 | (0.34, 0.364, 0.453) | (0.028, 0.034, 0.05) | 0.037 | 0.04 | C2 | (0.449, 0.573, 0.73) | (0.03, 0.048, 0.074) | 0.051 | 0.05 |
| C3 | (1.293, 1.46 1.62) | (0.11, 0.137, 0.176) | 0.14 | 0.14 | C3 | (0.936, 1.176, 1.46) | (0.065, 0.099, 0.15) | 0.104 | 0.08 |
| C4 | (0.83, 1.032, 1.14) | (0.068, 0.097, 0.13) | 0.096 | 0.09 | C4 | (3.401, 4.174, 4.90) | (0.235, 0.351, 0.5) | 0.362 | 0.35 |
| C5 | (0.499, 0.589, 0.69) | (0.04, 0.055, 0.075) | 0.057 | 0.06 | C5 | (0.335, 0.447, 0.51) | (0.023, 0.038, 0.052) | 0.038 | 0.04 |
| C6 | (0.515, 0.61, 0.706) | (0.04, 0.057, 0.077) | 0.059 | 0.06 | C6 | (0.376, 0.467, 0.58) | (0.03, 0.04, 0.06) | 0.043 | 0.04 |
| C7 | (0.68, 0.794, 0.938) | (0.056, 0.075, 0.10) | 0.078 | 0.08 | C7 | (0.704, 0.819, 1.19) | (0.049, 0.069, 0.12) | 0.08 | 0.08 |
| C8 | (1.148, 1.353, 1.61) | (0.094, 0.127, 0.18) | 0.132 | 0.13 | C8 | (0.518, 0.65, 0.81) | (0.036, 0.055, 0.082) | 0.058 | 0.06 |
Table 10 Weights for each N-V factor given by designers and consumers.
Note: (C1), Status/feeling of prestige (C2), Quality/warranty (C3), Mileage/fuel-efficiency (C4), Unique form (C5), New technology/features (C6), Past experience (C7), Ergonomics (C8), Safety features (C9). Fuzzy geometric mean value (ri), Fuzzy weights (fwi), Weights (Wi), Normalized weight (NWi).
0.249 0.24 C9 (1.73, 2.044, 2.367)
(0.12, 0.172, 0.241)
0.178 0.17
The calculation of the average comparison matrices for the consumers and designers was performed. The values of ri and fwi were computed using Equations (3) and (4) for each non-visual factor as given in Table 10. After finding Wi, the normalized weights NWi value for all factors was calculated such that the sum of weights of all factors was equal to one (Equation 5).
5 Discussion
C9 (2.31, 2.592, 2.874)
(0.189, 0.244, 0.31)
The results are shown in the Table 11 being presented offer a thorough comparison of the weights that the consumers and designers assigned to various non-visual factors that affected their cognition during the purchasing and designing of cars. The percentages show how important each group views each element relative to the others and provide helpful information about how dominant each factor is at different stages of the decision-making process.
Mileage/fuel efficiency: With a weight of 35%, this factor stands out as the most critical factor for consumers. It demonstrates how seriously they take long-term cost-effectiveness and fuel efficiency. However, designers only give it 9% of their total weight, suggesting they place more importance on other aspects of car design than mileage.
Safety features: Both the designers and the consumers valued safety features, but the designers gave them a higher weight, i.e. 24%, than the consumers, who gave them a weight of 17%. This implies that designers may put more effort into incorporating cutting-edge safety technologies and laws.
The consumers and designers agreed that reliability is essential in car design, with the consumers giving it a 13% weight and the designers giving it a slightly higher 17% weight. Consumers want a car that needs little upkeep and repair, so this factor is essential for guaranteeing their satisfaction and loyalty.
Ergonomics: The designers placed a higher priority on a car's ergonomics, giving this factor a 13% weight, while the consumersgave it a 6% weight. This shows that when designing a car, designers are more focused on comfort and safety, considering things like driving posture and usability.
The designers gave quality and warranty a more significant weight than the consumers (14% vs 8%). This discrepancy may result from designers considering product performance and durability, whereas consumers may rely on their own prior experiences with car quality.
Status/sense of prestige: The consumers and designers gave this factor relatively less weight, with the consumers giving it 5% and the designers giving it 4%. This suggests that while some consumers may take a car's prestige value into account, it is not usually a top priority for buyers.
Unique form: With a weight of 4% for each group, the consumers and designers placed relatively less weight on a car's distinctive shape. Consumers may place more importance on certain functional elements than designers who place more importance on aesthetics and branding.
Like the unique form, the consumers and designers gave new technology or features a weight of 4%. This implies that, even though consumers value cutting-edge features, they may not be the primary determinant of buying a car.
S. No. Non-Visual Factors Weights by Consumers Weights by Designers 1 Mileage/fuel-efficiency 35% 9% 2 Safety features 17% 24% 3 Reliability 13% 17% 4 Ergonomics 6% 13% 5 Quality/warranty 8% 14% 6 Past experience 8% 7% 7 Status/feeling of prestige 5% 4% 8 Unique form 4% 6% 9 New technology/feature 4% 6%
Table 11 Weights for consumers and designers.
However, in our studies we found that the designers' experience was based on their empirical and quantitative experience adapted from the success of their car parts. Factors such as status/feeling of prestige, unique form, and new technology/features were considerd of less weightage in contrast to other factors.
In conclusion, the non-visual factors show that customers and designers agree on issues such as security, dependability, and prior experience. However, their priorities diverge, with consumers emphasizing factors like fuel economy while designers concentrate more on things like ergonomics and quality/warranty. To match design strategies with consumer preferences and ultimately produce cars that satisfy the needs and expectations of the target market, car manufacturers and designers must have a thorough understanding of these variations.
Significant findings from our study and the Phase II consumer interviews are presented in this section. Consumers undoubtedly place the highest value on fuel efficiency, but designers place a greater emphasis on reliability and safety features when conceptualizing new cars. Although consumers also value dependability and safety, some may hesitate to pay a hefty premium just for improved safety features. Notably, consumers' prior experiences significantly impact their decision to buy a car. On the other hand, designers rely more on their personal experiences with previous designs. This draws attention to the differences between designers' empirical approaches and consumers' experiential knowledge from various sources, such as comments and reviews about different car brands.
An overall comparison shows that consumers lean towards economic considerations, particularly fuel efficiency, while designers prioritize policy and regulation-based aspects, such as safety and car quality. It is interesting to note that socio-pleasure factors like status or a sense of prestige hold little importance for most consumers, and designers agree with this by giving them a lower priority. Even though designers and consumers generally give the distinctive form of a car less importance, they understand its importance for upholding a brand's reputation. This suggests that consumers may not value unique designs highly, but they affect how the public views a brand. Understanding that consumer perceptions, needs, and preferences for automobiles are changing quickly is critical. Consumer expectations change in line with advancements in technology and innovation. To effectively meet the market's evolving needs, car manufacturers and designers must stay on top of these dynamic changes. In previous literature, we observed that numerous factors affect consumers and the designer's cognitive appeal. A lot of research has been conducted related to the visual factors considered in car design from the perspective of the consumer only. Here, we strongly would like to convey that our research work builds a bridge to overcome the gap between consumers' and designers' cognitive thinking while purchasing and designing a car, respectively. We considered the non-visual factors of cars to furnish our research. One possible reason might be that designers often work in isolation with minimal interaction with common people or consumers, therefore they do not receive substantial input directly from consumers. Designers always get input from marketing personnel in technical language and sometimes in terms of data. Therefore, designers do not receive information about the conceptual and emotional responses of consumers from marketing personnel.
6 Conclusions
In this paper, we studied non-visual factors that impact the cognitive appoach of consumers and designers for the car considered as a product. Our empirical studies evidences the role played by various factors involved in estimating the success of any product. The non-visual factors were identified through a survey conducted for among consumers and designers. This allowed us to study the consumer's cognitive behavior while considering the same aspect for the designer, thus filling the gap between them. The open-ended survey provided novel non-visual factors that are missing in the existing literature. These factors were studied and their values were weighted using a rank/average value method. Further, the Inverse Pareto principle allowed us to analyze the most significant factors affecting the design and purchase of a car. The ranking of all these factors were performed using a fuzzy-based analytical hierarchy process. Thus, a mixture of all the techniques allowed us to study the main aspects of the nonvisual factors considered by both designers and consumers. These dominant factors are: fuel efficiency, safety features, reliability, ergonomics, and quality/warranty. These factors have been broadly discussed and studies have demonstrated the role of each factor required for the success of a product. Since the requirments of consumers are highly diverse and practically speaking it is not possible to consider all of the requirements in a single design. Thus, this study may be useful for designers in terms of a better understanding of consumer requirements.
In the future, this work can be extended to a larger sample size of consumers and designers for a better perspective. The outcome of our results and studies can be applied to any industry setup for validating the applicability of the purposed research. Other factors not discussed in this study, which include corporate strategy, R&D vision, organizational communication, and transdisciplinary collaboration, indirectly affect individuals' work in any organization. Organizational communication as an example has been proposed as an influencing factor of a group's innovativeness and creativity [19]. Organizational boost, workgroup support, supervisory boost, freedom, resources, and challenging work are other vital factors that are positively linked with creativity. Companies also need to emphasize their corporate strategies, such as excellent after-sale services to gain a competitive advantage. Similarly, marketing people, industries, and R&D need to focus on today's consumers' hidden requirements. We again emphasize that the only way to recognize these requirements or desires affecting the customer's perception during the purchase of a new product is to work with consumers on the ground and not merely to collect data from social networking sites, their daily lifestyle, etc.
Acknowledgements
The authors would like to acknowledge the Department of Science and Technology, Government of India for their financial support with reference number SR/CSRI/169/2015 (G), under Cognitive Science Research Initiative (CSRI) and DST iHub – AwaDH Agriculture and Water Technology Development Hub IIT Ropar. We also acknowledge all those who participated in the survey.
Institutional Review Board Statement
The study was conducted in accordance with the Declaration of Helsinki, and was approved by the Institutional Review Board (Ethics Committee) of IIT Ropar, Punjab (protocol code IITRPR/IEC/2023/001 and 17 April 2023) and iHub – AwaDH IIT Ropar.