
M. Prama Yufdy
Assessment Institute for Agricultural Technology North Sumatera Jl. Jend. Besar A. H. Nasution No. 1b Pangkalan Masyhur, Medan 20143 pramayufdy@yahoo.com
ABSTRAK
SORPSI DAN DESORSI NUTRISI PADA AIR LAUT DENGAN ZEOLIT. Air laut terdiri dari kation-kation dalam jumlah yang besar. Sejak dulu sumber daya ini mempunyai jumlah yang sangat berlimpah dan murah, sehingga dapat dijadikan sumber nutrisi yang baik bagi tanaman. Tujuan dari studi ini adalah untuk meneliti seberapa besar nutrisi yang dapat diserap oleh zeolit pada beberapa konsentrasi air laut yang berbeda. Hasil menunjukkan bahwa Na dan Mg dapat diserap oleh zeolit. Persentase Na dan Mg terbesar yang dapat diserap adalah sebesar 76.19 dan 36.69%, yang secara berurutan diperoleh dari 10% air laut. Hasil penyerapan ini diindikasikan oleh konsentrasi air laut yang digunakan lebih tinggi, dimana Na dan Mg diserap lebih tinggi. Air laut dilewatkan melalui zeolit yang dilarutkan terhadap K dan Ca yang mempengaruhi kationnya. Hasil larutan ini dapat digunakan sebagai sumber nutrisi pada tanaman. Konsentrasi yang tinggi seperti pada kation terlarut disebabkan oleh tingginya pH dan EC, yang berarti bahwa kation harus berupa larutan agar mudah diserap oleh tanaman.
Key words: Desorption, nutrients, seawater, sorption, zeolite.
INTRODUCTION
Seawater contains large amounts of dissolved salts, with about 3.5% by weight (Brown et al., 1989) [1]. These salts contain high amounts of Na, K, Ca and Mg with about 10,000, 380, 400, 1300 mg L<sup>-1</sup>, respectively. This could meet nutrients requirement by many crops. It will be laudable to make maximum use of K, Ca and Mg but a minimal use of the Na in seawater since this resource is abundant and cheap.
Zeolite has been known as an ion exchanger as well as an adsorbent. A natural zeolite might have single species or multiple species of zeolite, which depends on the host rock, and the formation process of zeolite, which is influenced by temperature and chemical
environment of the soil (Tsitsishvili et al., 1992) [2].
Substitution of one ion in or on it due to its negative charge can take place for an electrically equivalent number of ions from a solution (Suzuki, 1990) [3]. As a microporous substance, it also may adsorb cations through primary and secondary porosity (bidispersive porosity). Diameter of aperture in the primary porous structure of zeolites varies between 0.3 to 0.6 nm. Existence of apertures of fixed diameter causes the molecular sieving action of zeolites. Under ideal conditions some molecules can pass through the apertures to the internal structure, filling the available adsorptive space. The larger sizes. however, cannot enter and therefore remain on the outer surface of the zeolite grain (Tsitsishvili et al., 1992). Since each cation has different ionic radius, each zeolite species can adsorb cations that fix to its cavities.
Ion selectivity is another characteristic of zeolite that indicates its capacity to sorbs cation, and it is different from one zeolite species to another depending on the structure. Clinoptilolite and mordenite are the most important species of natural zeolite that can adsorb various cations (Dyer, 1990) [4]. Exchange selectivity of clinoptilolite is \(Cs^{+}>K^{+}>Sr^{2+}=Ba^{2+}>Ca^{2+}>>Na^{+}>Li^{+}\)and that of mordenite \(Cs^{+}>K^{+}>NH_{4}^{+}>Na^{+}>Ba^{2+}>Li^{+}\)(Vaughan. 1978) [5]. The selectivity of the natural zeolites for a particular ion is very much dependent on its origin as well as on the type of ions already present in the structure (Metropoulos et al., 1993) [6]. Higher cation saturation of zeolite will result in less amount of cation that could be sorbed. Another factor is the impurity of zeolite. Prolonged mineralogical processes in the soil with different environmental regimes produce different impurities of zeolite. Natural zeolite, which contains clinoptilolite and mordenite, may be contaminated with many other minerals. The higher the impurity the lower the sorption capacity of the natural zeolite.
These characteristics of zeolite are of great advantage when using zeolite for crop nutrient management, particularly to minimize nutrient loss due to leaching and run-off. Zeolite for this purpose may retain cations and release them slowly.
The objective of this study was to investigate the extent to which zeolite could sorb and desorb nutrients in different concentrations of seawater.
MATERIALS AND METHODS
The experiment was conducted at the Soil Fertility laboratory and Glasshouse, Department of Land Management, Faculty of Agriculture, Universiti Putra Malaysia. Commercial natural zeolite with a size of >500 µm (split) from Lampung- Indonesia was used as sorption material, and seawater taken from UPM Research Station Port Dickson, Negeri Sembilan - Malaysia as a source of nutrients.
Chemical Analysis of Seawater
The K, Na, Ca and Mg concentrations of the seawater sample were determined using AAS. The pH and EC of these samples were determined using pH meter (Corning 220) and EC meter (HANNA HI 8820), respectively. The results of these analyses are shown in Tables 1.
Sorption of cations
Thirty grams of oven dried (60 °C for 24 hours) zeolite was placed in 150 mL leaching tube and leached with six concentration of seawater (5, 10, 15, 20, 25 and 30 %). The leaching process for each concentration was repeated 5 times (fractions), and 18.2 mL diluted seawater was used for each fraction. Each treatment was replicated two times. The amount of diluted seawater required per fraction was calculated based on the zeolite pore space. The leaching process was adjusted to a rate of 1 drop in about 8 to 10 seconds. The influent and effluent solutions were then analyzed for K, Na, Ca, Mg concentration using AAS, whereas
pH and EC were determined using pH and EC meters respectively. The quantity of cations sorbed in and on sorbents was calculated by difference between cations concentration in the influent and effluent for each fraction and multiplied with the volume of effluents. The third fraction that showed the highest sorption was chosen to represent the sorption of cations in zeolite.
Desorption of Cations from Zeolite
Thirty grams of oven dry (60 °C for 24 hours) zeolite saturated with nutrients of all seawater treatments (small-scale and scaled up experiment) were leached with 5 fractions (5 x 18.2 mL) of distilled water. The effluents were then analyzed for K, Na, Ca and Mg concentration and the amount of those cations were calculated by multiplying their concentration with the volume of effluents.
RESULTS AND DISCUSSION
Sorption of Cations. The results indicate that zeolite sorbed Na and Mg but not K and Ca (Table 2). Higher concentrations of both K and Ca were found in the effluent compared to that of the influent. It also means that K and Ca in the effluent were not only from seawater but also leach out from zeolite.
The most important factor in ion exchange and adsorption properties of zeolite is ion
selectivity, which is influenced by some factors such as ion size and porous structure (Barrer, 1978 [7]; Tsitsishvili et al., 1992). The selectivity of cations for clinoptilolite is in the order \(Cs^{+}>K^{+}>Sr^{2+}=Ba^{2+}>Ca^{2+}>>Na^{+}>Li^{+}\)and that of mordenite is \(Cs^{+}>K^{+}>NH_{4}^{+}>Na^{+}>Ba^{2+}>Li^{+}\)(Vaughan. 1978). Higher sorption of Na and Mg compared to K and Ca in this study does not mean that this zeolite sample has different cation selectivity than those reported by several researchers (Barrer, 1978; Tsitsishvili et al. 1992; Vaughan, 1978) but because it is naturally saturated with both cations
Most of K and Ca in the influent (Table 1) might have not entered the cavities of the zeolite due to the existing amounts of K and Ca and the reverse seems to be true for Na and Mg where there might be available spaces in the specific cavities. which indicated the are by concentration of both cations in the effluent (Table 3). This was possible because of the ionic sieve function of clinoptilolite and mordenite (Tsitsishvili et al., 1992). For this reason K and Ca with ionic radii 1.33 and 0.99 Å could not enter the available space suitable for Na and Mg with ionic radii of 0.97 and 0.07 Å. Similarly, the zeolite might contain more available specific cavities for Na than Mg so that it sorbs higher Na than Mg. This observation is similar to ion selectivity reported by Vaughan (1978).
Table 1. Cation Concentrations, pH and EC of Diluted Seawater
| Concentration of | Cations | EC | ||||
|---|---|---|---|---|---|---|
| Seawater | K | Na | Ca | Mg | pH (H2O) | |
| % | μg mL-1 | mS cm-1 | ||||
| 5 | 7.50 | 514.00 | 30.50 | 62.00 | 6.56 | 02.85 |
| 10 | 46.00 | 1030.00 | 49.00 | 130.00 | 6.89 | 05.40 |
| 15 | 61.00 | 1555.00 | 63.00 | 188.00 | 7.04 | 08.63 |
| 20 | 75.00 | 2104.00 | 121.00 | 256.00 | 7.24 | 10.86 |
| 25 | 110.00 | 2585.00 | 132.00 | 312.00 | 7.36 | 12.73 |
| 30 | 124.00 | 3024.00 | 148.00 | 372.00 | 7.52 | 15.43 |
| 365.00 | ||||||
| 100 | 255.00 | 4665.00 | 1120.00 | 7.88 | 44.40 | |
Table 2. Sorption of Na and Mg by Zeolite
| Concentration | Influent | Effl | uent | Cation sorbed | Percentage | |
|---|---|---|---|---|---|---|
| of Seawater | Conc of | Amount | Conc of | Amount | sorbed | |
| cation | of cation | cation | of cation | |||
| Na | ||||||
| % | mg mL-1 | mg | mg mL-1 | mg | μg g-1 | % |
| _ | ||||||
| 5 | 0.51 | 9.36 | 0.16 | 2.78 | 219.33 (31.11) | 70.29 |
| 10 | 1.03 | 18.76 | 0.27 | 4.47 | 476.33 (50.02) | 76.19 |
| 15 | 1.56 | 28.32 | 0.80 | 11.73 | 553.00 (70.37) | 58.57 |
| 20 | 2.10 | 38.31 | 1.49 | 25.31 | 433.33 (72.19) | 33.93 |
| 25 | 2.59 | 47.07 | 1.70 | 28.58 | 616.33 (93.23) | 39.30 |
| 30 | 3.02 | 55.07 | 1.94 | 28.03 | 901.33 (189.27) | 49.10 |
| Mg | ||||||
| 5 | 0.06 | 1.13 | 0.06 | 1.08 | 1.67 (0.18) | 4.07 |
| 10 | 0.13 | 2.37 | 0.09 | 1.50 | 29.00 (3.61) | 36.69 |
| 15 | 0.19 | 3.42 | 0.17 | 2.58 | 28.00 (7.67) | 24.50 |
| 20 | 0.26 | 4.67 | 0.26 | 4.34 | 11.00 (1.71) | 6.83 |
| 25 | 0.31 | 5.68 | 0.32 | 5.43 | 8.00 (0.99) | 4.47 |
| 30 | 0.37 | 6.77 | 0.40 | 5.72 | 35.00 (4.95) | 15.62 |
| Ca | ||||||
| _ | ||||||
| 5 | 30.50 | 0.56 | 242.00 | 4.16 | - | - |
| 10 | 49.00 | 0.89 | 638.00 | 10.51 | - | - |
| 15 | 63.00 | 1.15 | 1308.00 | 19.20 | - | - |
| 20 | 121.00 | 2.11 | 1448.00 | 24.54 | - | - |
| 25 | 132.00 | 2.40 | 1525.00 | 25.68 | - | - |
| 30 | 148.00 | 2.70 | 1704.00 | 24.35 | - | - |
| K | ||||||
| 5 | 7.50 | 0.14 | 63.40 | 1.09 | - | - |
| 10 | 46.00 | 0.84 | 113.50 | 1.86 | - | - |
| 15 | 61.00 | 1.11 | 225.00 | 3.31 | - | - |
| 20 | 75.00 | 1.37 | 253.50 | 4.30 | - | - |
| 25 | 110.00 | 2.00 | 270.50 | 4.55 | - | - |
| 30 | 124.00 | 2.26 | 301.50 | 4.30 | - | - |
Table 3. Potassium, Calcium, pH and EC of Effluent after Passing through Zeolite
| Concentration of seawater | К | Ca | pH (H2O) | EC |
|---|---|---|---|---|
| % | μg mL-1 | μg mL-1 | mS cm-1 | |
| 5 | 63.40 | 242.00 | 6.99 | 2.45 |
| 10 | 113.50 | 637.50 | 7.29 | 2.46 |
| 15 | 225.00 | 1307.50 | 7.13 | 3.58 |
| 20 | 249.50 | 1447.50 | 7.40 | 5.97 |
| 25 | 270.50 | 1525.00 | 7.20 | 11.11 |
| 30 | 301.50 | 1703.50 | 7.34 | 12.94 |
Values in bracket are standard error of the mean, n = 2
The higher the concentration of seawater. the higher the amount of Na and Mg sorbed (Table 3). The highest amount of Na sorbed was 901.33 µg g<sup>-1</sup> obtained from 30% diluted seawater concentration and was 35.00 µg g<sup>-1</sup> for Mg from the same diluted seawater concentration. However, the highest percentage of Na and Mg sorbed by zeolite was found in lower seawater concentration. The highest percentage of Na and Mg sorbed were 76.19 and 36.69%, respectively obtained from 10% seawater concentration. The results suggest that both cations could be at 10% sorbed more seawater concentration compared to the other treatments. This is consistent with earlier finding that zeolite (clinoptilolite) can sorb cation in a high amount if the cation is present in low concentration, especially when there are appreciable Ca 2+ and Mg in the solution (Vaughan, 1978). Furthermore, the sorption of Na and Mg in this study was lower than 3 - 4 mg g<sup>-1</sup> (common range for cations zeolite sorption) as reported by Mumpton and Fishman (1977) [8], and far lower (110 g kg<sup>-1</sup>) compare to pure clinoptilolite reported by Ming and Mumpton (1989) [9].
Since no K and Ca were sorbed by the zeolite, both cations from seawater together with those from zeolite were leached out and concentrated in effluent solution (Table 4). This solution may be used as a source of plant nutrient in the liquid form. However, the effluent that can
only be used for this purpose has to be diluted up to 15% (Table 1) since the EC is below the critical level of 4 mS cm<sup>-1</sup> required by plant (Miller and Gardiner, 1998) [10].
Sorption of Na and Mg in zeolite resulted in a lower value of EC in the effluent (Table 4) compared to those of the influent (Table 1). It may also explain the occurrence of cation sorption process, since EC is commonly used as an expression of the total dissolved salt concentration of an aqueous sample (Rhoades et al., 1999) [11].
Desorption of Cations
The higher the amount of Na sorbed, the higher the amount of Na desorbed (Figure 1). Desorption of Na for all treatments reached the peak at the second fraction and decrease at the subsequent fractions. The figure also shows that the pattern of desorption from one fraction to another for all treatments was generally similar.
The same pattern of Na desorption was also observed for Mg desorption from zeolite saturated with seawater (Figure 2). Similar to the amount of sorption, the amount of Mg desorbed was lower than that of Na. This result again indicates that the potential of the zeolite observed to sorb and desorb Mg was lower than that of Na. It might be because of higher amount of Na in the influent, but it can also because of higher selectivity of this zeolite to Na compared to Mg.
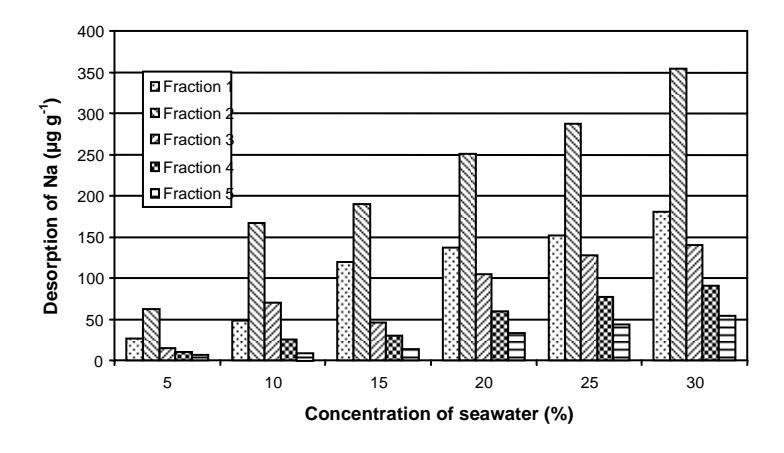
Gambar 1. Desorption of Na from Zeolite for 5 Fractions
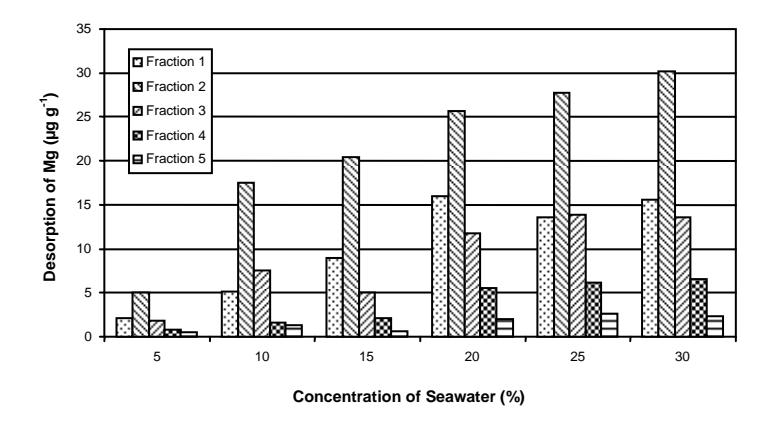
Gambar 2. Desorption of Mg from Zeolite for 5 Fractions
Table 4. Total Amount of Na and Mg Desorption after 5 Fractions
| Concentration of seawater | Na | Mg |
|---|---|---|
| % | µ g g-1 | |
| 5 | 121.34 (11.54) | 10.27 (1.23) |
| 10 | 318.92 (49.45) | 33.07 (5.27) |
| 15 | 399.29 (38.16) | 37.05 (3.89) |
| 20 | 583.72 (57.13) | 62.68 (5.63) |
| 25 | 686.81 (61.29) | 63.86 (7.11) |
| 30 | 819.42 (82.10) | 68.19 (5.31) |
Values in bracket are standard error of the mean, n = 2
The results in Table 5 shows the total amount of Na and Mg desorbed from zeolite saturated with seawater after 5 fractions. The higher the concentration of seawater leached through zeolite in the sorption, the higher desorption of both cations. This result was consistent with the increasing amount of Na and Mg sorbed with increasing the concentration of seawater (Table 3).
The total amount of Na desorbed at 5, 10 and 15% diluted seawater were about 55, 67 and 74% from the amount sorbed (Table 3), respectively. However, the amount was increased at higher seawater concentration particularly 20% and 25%, which was 136 and 111%, respectively. It means that Na in the effluent was not only from desorbed Na in zeolite, but also includes those initially present in zeolite at 2.12 cmol kg-1 (487.6 µ g g-1) (Table 2).
The total amount of Mg desorbed from zeolite after 5 fractions (Table 5) was more than the amount sorbed from seawater (Table 3) in all treatments. It shows that Mg released from zeolite during desorption includes the initial Mg already present in the zeolite cavities at 2.38 cmol kg-1 (571.00 µ g g-1) before sorption process took place (Table 2).
CONCLUSION
Zeolite sorbed Na and Mg. The highest percentage of Na and Mg sorbed was 76.19 and 36.69%, respectively obtained for 10% seawater. However, the highest amount of both cations sorb was 301.33 and 35.00 µg g-1 from 30% seawater. The highest sorption percentage for Na was 92.58% obtained for 30% diluted seawater; and 67.84 and 54.75% for Mg and Na from 40% diluted seawater; while the highest amount of the three
cations sorb was from 40% seawater at 2260.00, 210.00 and 60.00 \(\mu g\) \(g^{-1}\), respectively.
The desorption study indicated that the higher the seawater concentration used during the sorption, the higher the Na and Mg desorbed in the small-scale experiment Zeolite treated with 30% seawater can release Na and Mg at a moderate rate, which is slower than that for 20% and faster than that for 40% seawater. However, K release from 30% seawater was faster than 20 and 40% seawater.
Passing diluted seawater through zeolite leached out Ca, some K and Mg to the extent that the effluent was concentrated with the cations. This byproduct solution can be used as a source of plant nutrients. However, high concentration of such cations in the solution caused high pH and EC, which means that the solution has to be diluted to meet the requirements of plants.
REFERENCES
- Brown, J., A. Colling., D. Park., J. Phillips., D. Rothery., J. Wright. 1989. Sea Water: Its composition, properties and behaviour. Pergamon Press, Oxford. p. 19
- Tsitsishvili, G.V., T.G. Andronikashvili., G.N. KirovN., and L.D. Filizova. 1992. Natural Zeolite. Elli Horwood. pp.1-181.
- 3. Suzuki, M. 1990. Adsorption Engineering. Elsevier, Amsterdam. pp.35-61
- 4. Dyer, A. 1990. Recent advances in inorganic ion exchangers. p. 43-55 In P.A. Williams and M.J. Hudson (ed.).
- Recent Developments in Ion Exchange 2. Elsevier Applied Science
- Vaughan, D.E.W. 1978. Properties of natural zeolites. p. 353-371 In L.B. Sand and F.A. Mumpton. Natural Zeolites, Occurrence, Properties, Use. Pergamon Press, Oxford.
- Metropoulos, K., E. Maliou., M. Loizidou and N. Spyrellis. 1993. Comparative studies between synthetic and natural zeolites for ammonium uptake. J. Environ. Sci. Health, A28(7):1507-1508.
- Barrer, R.M. 1978a. Cation-exchange equilibria in zeolites and feldspathoids. p. 385-396 In L.B Sand and F.A Mumpton (ed) Natural Zeolites, Occurrence, Properties, Use. Pergamon Press, Oxford
- Mumpton, F.A., and P.H. Fishman. 1977. The application of natural zeolites in animal science and aquaculture. J. Animal Sc. 45(5):1188-1203)
- Ming, D.W and F.A. Mumpton. 1989. Zeolites in soils. p. 873-911. In J.B. Dixon and S.B. Weed (ed). Minerals in Soil Environment. SSSA, Wisconsin WI.
- 10. Miller, R.W and D.T. Gardiner. 1998. Soils in Our Environment. Prentice Hall Inc, London. pp. 284-310.
- Rhoades, J.D., F. Chanduvi., and S. Lesch. 1999. Soil salinity assessment, methods and interpretation of electrical conductivity measurements. FAO Irrigation and Drainage Paper, Rome. pp. 5-14