
INTRODUCTION
BACKGROUND OF THE STUDY
The speed of technology has affected some aspects of people's life, one of which is the need to get quick and accurate information. Internet has become the technology to fulfill people's need in gaining abundant information. According to Australian Survey Institute, Effective Measure, the number or internet user in Indonesia until the first quarter has reached 39.1 million. It took Indonesia at the Eighth position as the greatest Internet users in the world. According to KADIN, Senior High School and College students dominate Indonesian internet users in the average age of 15 to 25 years old. In Indonesia, College students are the potential internet users. Meanwhile, Bandung ranks as the third city with the highest internet users. Because the College students are the potential Internet users in Indonesia, they dominate the students from private universities with the presentation as much as 71%.
In 2011, the active students at Telkom Institute of Management (IM Telkom) have reached 4960 students or controlled as much as 3.757% of the total private university students in Bandung. It makes IM Telkom hane the largest number of students in Bandung. IM Telkom has other advantage to provide every curriculum in teaching based on ICT (Information and Communication Technology). Over the development period, Internet has become people lifestyle for the students as the potential Internet users in Indonesia. They make Internet then lifestyle tool to be able to access information quickly and accurately from online news services. Services online news sites began to develop in 1998 by the conjunction of transitioning from sociopolitical order to reformation era. It was the era where the freedom of the press is limited and many print media banned. Along with the times that demand for fastpaced and driven by the increasing number of internet users, the online news site services born to be a new and popular media. As Antaranews.com reported that newspaper readers (print media) remained 15% in 2010, inversely proportional to the number of internet readers that reached 20% in 2010. Meanwhile, Alexa.com reported the measurement results on September 26, 2011. It said that 25 most frequently accessed sites in Indonesia constituted by Detik.com, Kompas.com, Okezone.com, and Vivanews. com. Until 2010, 16 news online services sites compete in Indonesia. They compete with each other to be the top news site. There is one way to do in facing the tight competition by understanding the preferences and good positioning. Ballou said (2005:1-3), the company will be able to design a strategy when they respond to all consumer needs. With good positioning, the company will determine the mapping position of competitors.
Based on this background, the writers conducted a study entitled "A Comparative Study of Online News Site Services Based on Consumer Preferences to Telkom Institute of Management Students In 2011" (Study Objective at Detik.com, Kompas.com, Okezone.com, and Vivanews.com).
RESEARCH PROBLEM
The research problems in this study are: What are the factors for IM Telkom students' preference to choose online news sites? How is the competitive position maps online news service for IM Telkom students? What are the positioning strategies used by all four services online news sites?
PURPOSE OF THE STUDY
The purpose of this study is to determine the factors that make IM Telkom students prefer the four online news sites, to determine the map competing position of those four online
news services, and to determine positioning strategies used by these service site news online.
RESEARCH METHODOLOGY
The study was conducted in two stages: Stage I by using factor analysis to determine the factors of IM Telkom students' preference in choosing online news sites. Phase II by using Multi Dimensional Scaling using (MDS) to assess the competitive position maps based on factors or attributes that have been generated by the Phase I study, so it can be formulated as positioning strategies to be used by all four services online news sites.
OPERATIONAL VARIABLE
One characteristic of factor analysis is interdependence variable, which means measuring the relationship between each variable so that all variables will equal each other (no dependent variable or independent variable). In Phase I study, the writer used variables of E-Service, which consists of Ease of Use, Reliability, System Availability, Responsiveness, and Trust Dimensions (Hongxiu, et.al, 2007:3). While the E-Qual variables comprised of Accessibility, Navigation, Design and Presentation, Content and Purpose, and interactivity, customization, and personalization dimensions. (Hoffman and Bateson, 2006:350). Therefore, the total variables measured in the Phase I study is 16 variables. The following is the operational variables for Phase I research:
| complaining | ||||
|---|---|---|---|---|
| Variable | Dimension | Item | (X9) | |
| Ease of Use | 1.Easiness to | Trust | 10.Website | |
| get the needed | administrator | |||
| information | is able to | |||
| E-Service | (XI) | keep the user | ||
| 2.Easiness to | personal data | |||
| leave | secrecy | |||
| comment in | (X10) | |||
| each | 11.Website |
| information | |
|---|---|
| (X2) | |
| Reliability | 3. Accuratenes |
| s guaranteed in | |
| presenting | |
| information | |
| (X3) | |
| 4. Up to date | |
| information in | |
| presenting | |
| information | |
| (X4) | |
| System | 5. Easiness in |
| Availability | using the |
| system for the | |
| user to access | |
| the sites | |
| whenever and | |
| wherever (X5) | |
| 6. Easiness in | |
| using the | |
| system to | |
| speed the | |
| access (X6) | |
| Responsiveness | 7. Comments |
| are | |
| responded | |
| quickly by | |
| the | |
| administrato | |
| r (X7) | |
| 8. Applying | |
| suggestions | |
| given by | |
| website users | |
| (X8) | |
| 9. Quick | |
| website | |
| administrator | |
| respond on | |
| complaining | |
| (X9) | |
| Trust | 10.Website |
| administrator | |
| is able to keep the user | |
| administrator | ||
|---|---|---|
| is able to | ||
| keep the | ||
| accurate | ||
| reputation of | ||
| information | ||
| (X11) | ||
| Variable | Dimension | Item |
| Accessibility | 12. The site is | |
| easy to be | ||
| found in | ||
| search | ||
| engine (X12) | ||
| Navigation | 13.The | |
| easiness in | ||
| moving | ||
| E-Qual | around on | |
| the website | ||
| (X13) | ||
| Design and | 14. The | |
| Presentation | information | |
| presented | ||
| using picture | ||
| or animation | ||
| (X14) | ||
| Content and | 15. The | |
| Purpose | information | |
| presented is | ||
| in-depth | ||
| elaboration | ||
| (X15) | ||
| Interactivity, | 16. There is a | |
| customization, | contact | |
| and | person of | |
| personalization | website | |
| administrator | ||
| which can be | ||
| contacted to | ||
| make the | ||
| communicati | ||
| on easier | ||
| (X16) |
In Phase II study, the operational variables taken from the results of Phase I study.
MEASUREMENT SCALE
Measurement scale used is ordinal scale, which is the scale to sort the data from the lowest level to the highest level, or vice versa. But it does not notice the interval data. (Sekaran, 2003:186). As for the instrument scale, the writer used Likert scale with four levels. There are Strongly Agree (Four score), Agree (Three score), Disagree (Two score), and Strongly Disagree (One score).
POPULATION AND SAMPLE
a. Population
The populations are all IM Telkom active student in 2011 that reach the total number of 4960. They consist of 643 Trade Administration bachelor students (ADNI), 692 Accounting bachelor students, 334 Visual Communication Design bachelor students (DKV), 2145 Business Management of Telecommunications and Informatics bachelor students (MBTI), 92 International Class of Business Management of Telecommunications and Informatics, 701 Communication Studies Bachelor students (Ikom), 206 Marketing Management Diploma Students (Mansar), and 147 Master Management students (MM).
b. Sample
To determine the sample number, the writer use Slovin formula. There are 150 respondents gained using it.
The sample selection was done by using modified convenience-sampling method. The members are people easily found, accessible and fulfill proportional modification sample determination. The specified characteristics is IM Telkom active students who access Detik.com, Kompas.com, Okezone.com, and Vivanews.com
RESULTS AND DISCUSSION
RESEARCH PHASE I (FACTOR ANALYSIS)
Factors analysis was included into multivariate analysis used to identify the structure of inter-dimensional E-Service and E-Qual. They are considered as the most important dimension by consumers or users in selecting online news sites. It ash conducted to find new factors or components
Before conducting factor analysis, the data should be analyzed through the assumptions tests consisting of Data Test. It has ensured that the uploaded data is the interval data,while Homogeneity Test is just merely to find the similarity and nonsimilarity of groups data. There are some steps to determine the factor analysis:
1. Size Sampling Adequacy (MSA)
The statistical test used in factor analysis was Barlett Test Sphericity and Kaiser-Mayer Olkin (KMO). They are use to determine the adequacy of the sample. Minimal tally should have a value of 0.5 KMO and if it is less than the value, this study cannot be continued using factor analysis.
| KMO and Bartlett's Test | |||||||||
|---|---|---|---|---|---|---|---|---|---|
| - | Kaiser-Meyer-Olkin Me | .809 | |||||||
| • | Bartlett's Test of | Approx. Chi-Square | 807.594 | ||||||
| Sphericity | df | 120 | |||||||
| Sig. | .000 | ||||||||
From the results of the calculation, the KMO value derived from the 1809 study, it can be said that the study is feasible using factor analysis.
Barlett's Test of Sphericity is a statistical test to examine whether the variables correlated to each other. The null hypothesis (H0) has no correlation between the variables, whereas the alternative hypothesis (Ha) has the correlation among each variable. Barlett Test score chained with chi-square score. On Table 4.1 shown that the value of chisquare is 807 594, which means 120 degree of freedom and has the significance of <0.05. Conclusion: reject H0 and accept Ha, which means that there is a correlation between each variable.
2. New Factor Decreasing (Factor Extraction) of E-Service and E-Qual.
The Factor Decreasing conducted with the Principal Component Analysis, which is a factor analysis method to extract factors using the total variance analysis. (Hair, et.al, 2010:107). The writer chose to establish six new components generated from factor analysis data processing. There is no eigenvalue as the standard to find new formed components. The eigenvalue and variance can be seen in Total Variance Explained table below:
| Phase | |||||||||
|---|---|---|---|---|---|---|---|---|---|
| Initial Eigenvalues Extraction Sums of Squared Loadings | ed Loadings | Rotation Sums of Squared Loadings | |||||||
| Component | Total | % of Variance | Cumulative % | Total | % of Variance | Cumulative % | Total | % of Variance | Cumulative % |
| 1 | 5.054 | 31.586 | 31.586 | 5.054 | 31.586 | 31.586 | 2.369 | 14.808 | 14.808 |
| 2 | 1.789 | 11.182 | 42.768 | 1.789 | 11.182 | 42.768 | 2.010 | 12.562 | 27.370 |
| 3 | 1.454 | 9.089 | 51.857 | 1.454 | 9.089 | 51.857 | 2.008 | 12.550 | 39.920 |
| 4 | 1.136 | 7.097 | 58.954 | 1.136 | 7.097 | 58.954 | 1.968 | 12.301 | 52.222 |
| 5 | .978 | 6.113 | 65.067 | .978 | 6.113 | 65.067 | 1.668 | 10.425 | 62.647 |
| 6 | .849 | 5.309 | 70.376 | .849 | 5.309 | 70.376 | 1.237 | 7.729 | 70.376 |
| 7 | .745 | 4.654 | 75.030 | ||||||
| 8 | .700 | 4.375 | 79.405 | ||||||
| 9 | .623 | 3.891 | 83.296 | ||||||
| 10 | .543 | 3.395 | 86.691 | ||||||
| 11 | .496 | 3.097 | 89.788 | ||||||
| 12 | .425 | 2.659 | 92.446 | ||||||
| 13 | .377 | 2.356 | 94.803 | ||||||
| 14 | .330 | 2.061 | 96.864 | ||||||
| 15 | .294 | 1.835 | 98.698 | ||||||
| 16 | .208 | 1.302 | 100,000 | ||||||
Column % of variance on eigenvalue initial part (third column) indicates the amount of variance which can be explained by 16 items in the questionnaire statements. The fourth column describes the total variance explained by 16 cumulatively components. So the cumulative variance that can be explained by all 16 items in the questionnaire statement is 70,376%
The Interpretation of maintained components were conducted through Communalities Table and Component Matrix Table. Both tables show the contribution of each item to the counted component.
TABEL COMMUNALITIES FACTOR
| Initial | Extraction | |
|---|---|---|
| Easiness to get | 1.000 | 0.476 |
| information | ||
| Easiness to leave | 1.000 | 0.853 |
| comment | ||
| Information | 1.000 | 0.733 |
| accuracy | ||
| Up to date | 1.000 | 0.740 |
| information | ||
| Easiness in | 1.000 | 0.781 |
| accessing whenever | ||
| and wherever | ||
| High-speed site | 1.000 | 0.781 |
| accessing | ||
| Responded | 1.000 | 0.647 |
| Comments | ||
| Do what the user | 1.000 | 0.732 |
| suggest | ||
| Administrator | 1.000 | 0.675 |
| responded | ||
| Complaint | ||
| Able to keep | 1.000 | 0.793 |
| confidential | ||
| personal data | ||
| Able to keep | 1.000 | 0.740 |
| reputation | ||
| Easy to find in | 1.000 | 0.668 |
| search engine | ||
| Navigation easiness | 1.000 | 0.616 |
| Delivering | 1.000 | 0.550 |
| information using | ||
| pictures | ||
| Supported | 1.000 | 0.677 |
| information by data | ||
| accuracy | ||
| Contact person | 1.000 | 0.799 |
| administrator | ||
| display |
Communalities table is a table that shows the value of the total variance in each item. It affects the components obtained overall. Let us take an example in item 2 where its communality score is 0.853. The score indicates that 85.3% of the variance can be explained by six new formed factors.
The number of each variance items can be calculated by squaring the loading (seen Component Matrix Table)
COMPONENT MATRIX TABLE
| Component | ||||||
|---|---|---|---|---|---|---|
| 1 | 2 | 3 | 4 | 5 | 6 | |
| Mengakses kapangun dan dimanapun | 0.724 | |||||
| Informasi up to date | 0.715 | 7 - B | Q | 8 | ||
| Mampu menjaga rahasia data-data pribadi | 0.686 | 2 | ||||
| Mengakses situs dengan cepat | 0.684 | 8 | 8 | |||
| Mampo menjaga reputasi | 0.661 | 9) | ||||
| Informasi didukung oleh data akurat | 0.640 | 77 | ||||
| Mudah ditemukan dalam seorch engine | 0.613 | 8 | 8 | 0.473 | ||
| Complaintdranggapi pengelola | 0.609 | 77 | - | |||
| Kemudahan navigasi | 0.548 | 0.494 | 8 | 8 8 | ||
| Keakuratan informasi | 0.499 | Ü | ||||
| Kemudahan mendapatkan informasi | 60 | |||||
| Melakukan saran yang diberikan pengakses | 0.630 | 2 1 | ||||
| Komentar ditanggapi | 0.537 | 0.537 | - | |||
| Adastya contact person pengelola | 0.496 | |||||
| Informasi menggunakan gambar | San Maria | 0.621 | Show on | % | 8 8 | |
| Kemudahan meninggalkan komentar | 0.488 | 0.667 | - | |||
3. Rotation Factor
Factor rotation is a stage to maximize loading score in each time to ease its factor determination. Contribution (variance) of each item to its components needs to be maximized through the rotation technique. It is used to maximize the contribution in each item to its components called VARIMAX rotation method. Varimax method is a method that maximizes the amount of variance loading to each component without a changing in communality score. The results of the rotation shown in Rotated Component Matrix Table:
| Component | |||||||
|---|---|---|---|---|---|---|---|
| 1 | 2 | 3 | 4 | 5 | 6 | ||
| Mampu menjaga rahasia data-data | 0.809 | ||||||
| pribadi (Q11) | l | | | | | ||||
| Mampu menjaga reputasi (Q10) | 0.795 | ||||||
| Complaint ditanggapi pengelola (Q9) | 0.666 | ||||||
| Mengakses kapanpun dan dimanapun (Q5) | 0.787 | ||||||
| Mengakses situs dengan cepat (Q6) | 0.786 | ||||||
| Kemudahan navigasi (Q13) | 0.735 | ||||||
| Informasi menggunakan gambar (Q14) | 0.674 | ||||||
| Mudah ditemukan dalam searek engine (Q12) | 0.602 | ||||||
| Krakuratan informasi (Q3) | 0.799 | ||||||
| Kemudahan mendapatkan informasi (Q1) | 0.589 | ||||||
| Informati up to date (Q4) | 0.554 | 0.588 | |||||
| Informasi didukung oleh data akuat (Q15) | 0.472 | 0.562 | |||||
| Melakukan saran yang diberikan pengakses (Q8) | 0.759 | ||||||
| Adanya contact person pengelola (Q16) | 0.737 | ||||||
| Kemudahan meninggalkan | 0.891 | ||||||
| komentar (Q2) Komentar ditanggapi (Q7) | _ | 0.489 | |||||
The loading scores contained in each component are represented items. Those scores showed great contribution to each retained component as replacement components.
By doing VARIMAX rotation method, the distribution of variants items spread widely and evenly. It makes the contribution of each item to each component obvious. This is because each item provides maximum loading to its component.
4. Interpretation Formed Factors
Based on the analysis of the factors discussed above, there are six major factors formed and considered the most important thing by consumers in selecting online news sites.
The six new components are the variable at the Second Phase Study using MDS. These are six new components formed that based on the factor analysis result:
VARIABLE GROUP TABLE
| Komponen | Item | loading |
|---|---|---|
| Trust (Kepercayaan) | Mampu menjaga rahasia data-data pribadi Mampu menjaga reputasi | 0.809 |
| Complain ditanggapi pengelola | 0.666 | |
| Access | Mengakses kapanpun dan dimanapun | 0.787 |
| Mengakses situs dengan cepat | 0.786 | |
| Kemudahan navigasi | 0.735 | |
| Website Design | Informasi menggunakan gambar | 0.674 |
| Mudah ditemukan dalam search engine | 0.602 | |
| Keakuratan informasi | 0.799 | |
| Accuracy | Kemudahan mendapatkan informasi | 0.589 |
| Accidacy | Informasi up to date | 0.588 |
| Informasi didukung oleh data akurat | 0.562 | |
| Communication | Melakukan saran yang diberikan pengakses | 0.759 |
| Adanya contact person pengelola | 0.737 | |
| Interaction | Kemudahan meninggalkan komentar | 0.891 |
| I.i.c. Bollon | Komentar ditanggapi | 0.489 |
RESEARCH PHASE II
There are six important factor related to the preference of IM Telkom Student in choosing service online news sites; Trust, Access, Website Design, Accuracy, Communication, Interaction
The mapping used MDS. Its result is the perceptual mapping in describing Detik.com competitive position, Kompas.com, Okezone.com, and VIVAnews. com based on the six attributes from previous studies.
2. MDS Process
Preference data tabulation E-Service and E-Qual services online news site were selected based on attributes using the sum of the results obtained with a preference given by paired comparisons. Then, it was listed in the biggest of respondent preference. The sorted preference data results become respondents' assessment that can be seen in the following table.
| Atribut | LAYANAN SITUS BERITA ONLINE | |||||||
|---|---|---|---|---|---|---|---|---|
| Atriout | Detikcom | Kompas.com | Okezone.com | Vivanews.com | ||||
| Trust | 1 | 2 | 4 | 3 | ||||
| Access | 1 | 2 | 4 | 3 | ||||
| Website Design | 1 | 3 | 4 | 2 | ||||
| Accuracy | 2 | 1 | 4 | 3 | ||||
| Communication | 1 | 2 | 4 | 3 | ||||
| Interaction | 1 | 2 | 4 | 3 | ||||
After that, the above results of respondents' preference were processed using the MDS. According to Hair, et. al (2010:568) MDS is a procedure used to map the perceptions and preferences of the respondents visually in map geometry map. It is called spatial or perceptual map folder, which means the elaboration of various related dimensions. From the mapping itself, the competitive position perceived by consumers based on their preferences will be obtained.
To map consumer perceptions toward E-Service and E-Qual attributes, the writer used MDS methods by the scale of paired comparisons. It was used to express respondent unambiguous attitude in choosing between two objects.
The processed preference data result of consumer preferences in the form of maps. Map comparison service online news sites (Detik.com, Kompas.com, Okezone.com, and Vivanews.com) shown with pictures at some point. Purple dot indicates the position of online news sites and green dot indicates the attributes position of respondent assessment. The distance of each attribute showed in Euclidean Distance Table. Overall, map image and object attributes can be seen in the following figure:
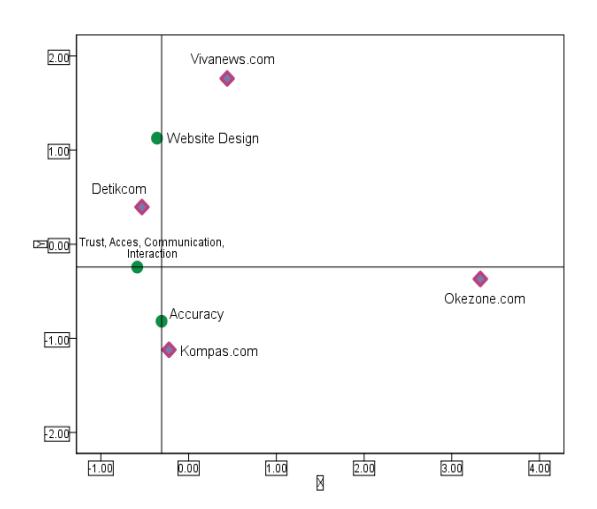
The results of comparison map above show the nearest objects to each attribute. The objects are four online news services (Detik.com, Kompas.com, Okezone.com, and Vivanews.com). It means the proximity of the object to the attribute indicates the level of respondents' likeliness: trust, access, website design, accuracy, communication, and interaction. The distance between each attribute with the object was found from Euclidean distance score.
POSITIONING STRATEGY BY ONLINE NEWS SITE SERVICE
1. Detik.com
Overall, Detik.com positioned in the first rank of all attributes, except for accuracy attributes. This means that IM Telkom students prefer Detik.com because of its trust, access, website design, communication, and interaction for information. They get the access of news value, entertained information and informative tips. This is supported by the results of respondent characteristics.
If Detik.com is able to maintain its current position by continuing to improve the accuracy of the information, it has a potential to use positioning unfocused strategy. It provides a kind of diverse service and controls the spread of market segments. Detik.com is an online pioneer journalism site. It can be a start-up to create Detik.com positioning in users'
minds. Besides that, Detik.com is a very up to date online news service on social media. Based on the calculation of alexa.com, Detik.com ranks the most accessed site in Indonesia until the date of 26 September 2011. According to competitive positioning map (perceptual mapping) and supported by the state company Detik.com, Detik.com is potential to use positioning unfocused strategy.
2. Kompas.com
Overall, Kompas.com is positioned in the first rank of all attributes, except for accuracy attribute. This means that IM Telkom students prefer to choose Kompas.com because of its trust, access, website design, communication, and interaction for information. They get the access of news value, entertained information and informative tips. This is supported by the results of respondent characteristics.
If Kompas.com is able to maintain its current position by continuing to improve the accuracy of the information, it has a potential to use positioning unfocused strategy. It provides a kind of diverse service and controls the spread of market segments. Kompas.com is an online pioneer journalism site. It can be a start-up to create Kompas.com positioning in user minds. Besides that, Detik.com is a very up to date online news service on social media. Based on the calculation of alexa.com, Kompas.com ranks the most accessed site in Indonesia until the date of 26 September 2011. According to competitive positioning map (perceptual mapping) and supported by the state company Kompas.com, Kompas.com is potential to use positioning unfocused strategy.
3. Okezone.com
Overall, Okezone.com ranks at the fourth or the last in all attributes. One positioning strategy used by Okezone.com is serviced focused. Service focused
provides limited service for a broad market segmented.
Okezone.com is MNC Group platform online that oversees three broadcasting units RCTI, GlobalTV, and MNC. Those broadcasting television engaged in entertain world. It causes the initial perception of Okezone.com to broadcast entertainment news. Meanwhile, the characteristics of IM Telkom respondents' online user seem to access 29.30% of Okezone.com news. This has been an opportunity to specialize entertainment information in Okezone.com site. It happened because the entertainment information has a very wide scope.
4. Vivanews.com
Overall, Vivanews.com ranked at the third position for trust, access, accuracy, communication, and interaction attributes. While Vivanews.com website design ranked at the second position after Detik.com. According to the map of the position of competition, the position of Vivanews.com is still under the rank of Detik.com and Kompas.com. It might be because Vivanews.com is a brand new online site news in 2008.
Vivanews.com owned by PT Visi Media Asia Tbk, which has broadcasted unit known as TV One as news television and ANTV known as TV engaged in entertainment. In observing the respondents' characteristics, IM Telkom students are more frequently accessing news (50.67%) and entertainment (29.30%). It makes Vivanews.com have a potential to use positioning unfocused strategy. However, if Vivanews.com decided to use positioning unfocused strategy, all attributes should be improved in order to compete with other popular online news services. It should have the differences from Detik.com that is known for its controversial language usage and indepth analysis.
CONCLUSIONS AND SUGGESTIONS
CONCLUSION
- 1. Based on the questionnaire results to 150 respondents (Detik.com, Kompas.com, Okezone.com, and Vivanews.com users), IM Telkom students preference in choosing online news site are based on trust, access, website design, accuracy, communication, and interaction.
- 2. Based on the questionnaire results to 150 respondents (Detik.com, Kompas.com, Okezone.com, and Vivanews.com users), the mapping competition position are:
- a. Detik.com is positioned at the first rank for trust, access, website design, communication, and interaction. Detik.com ranked the second for accuracy attribute.
- b. Kompas.com ranked at the first position on accuracy attributes and second ranked for trust, access, communication, and interaction attributes. Kompas.com is at the third rank for website design attribute.
- c. Okezone.com ranked the last position for its all trust, access, website design, accuracy, communication, and interaction attributes.
- d. Vivanews.com ranked the second position in terms of website design attributes and at the third rank on trust, access, accuracy, communication, and interaction attributes.
- 3. Service providers or companies should improve the attributes preferred by users to deal with the competition. These are the positioning strategies that can be undertaken by the company:
- a. Detik.com and Vivanews.com can apply positioning unfocused strategy to provide similar online news site service and wide spread broad market share.
- b. Kompas.com can apply positioning fully focused strategy to provide limited
- services as well as its limited market share.
- c. Okezone.com can apply positioning service focused strategy to provide limited service for a large market share.
SUGGESTION
- 1. Suggestions for Further Research The population in this study was only focused on IM Telkom students. The writer expects that the population in further research be wider and not be limited to the students. In addition, the writer also suggest to use other dimension to proceed further research in the future.
- 2. Suggestions for the Company
- a. Suggestions for Detik.com Detik.com has to maintain its position at the first rank for five attributes because IM Telkom students have preferred it. Detik.com has to increase its information accuracy too.
- b. Suggestions for Kompas.com Kompas.com ranked at the second position after Detik.com. Kompas.com must be brave to innovate and update positioning fully focused strategy in order to be the leader. It should highlight its feature characteristics or uniqueness provided services to be different from Kompas.com and other online news sites.
- c. Suggestions for Okezone.com Okezone.com ranks at the last position of all attributes. It has to make incremental innovation to be able to compete with other new online service site. An innovation that can be done by Okezone.com is focusing the service into entertain news. This is because Okezone.com is recognized by its entertain information, rather than news.
- d. Vivanews.com is a newcomer in online news services provider. However, Vivanews.com excels on website design attribute and put it in the third rank of other attributes. Vivanews.com services can be one of the most powerful online
news site in Indonesia because it is supported by two TV stations engaged in news and entertainment; Vivanews.com should improve its performance on all attributes perceived by consumers in order to compete with other service providers.