
ABSTRAK
Dalam sepuluh tahun terakhir, peningkatan pengetahuan disertai dengan bertumbuhnya ekonomi banyak membantu bertambahnya kesadaran terhadap dampak perubahan iklim di Jabodetabek. Artikel ini akan menganalisis index, status, dan respons serta aktivitas prolingkungan dari setiap wilayah di Jakarta, Bogor, Depok, Tangerang, dan Bekasi. Metode yang digunakan adalah Climate Change Effectiveness Response Assessment (CERAM) dengan memanfaatkan multidimensional scaling technique (MDS). Data yang dipergunakan sejumlah 1261 responden. Secara umum, index menunjukkan Kota Bogor merespon dampak perubahan iklim paling tinggi dan menunjukkan sikap prolingkungan. Akan tetapi, bila dilihat secara unit individu, Bekasi memiliki indeks sumber daya tertinggi untuk mampu merespons (71.47). Atribute yang paling memengaruhi indeks dan status dalam merespon perubahan iklim di Jabodetabek adalah keinginan untuk memiliki asuransi. Hasil studi ini akan menyediakan data kepada pembuat kebijakan untuk mendukung Jabodetabek bersiap menghadapi perubahan iklim.
Kata kunci: perubahan iklim, Jabodetabek, multidimensional scaling (MDS), kerentanan, respon
INTRODUCTION
Climate change is recognized as a major anthropogenically induced environmental threat with potentially severe and far reaching consequences for human and natural system. Greater Jakarta, which includes Jakarta, Bogor, Depok, Tangerang and Bekasi, is on the frontier of climate change impacts. Those impacts are torrential rain, flooding, sea level rise and storm surges. All of these impacts mentioned may cause economic loss and casualties. Its frequent occurrence hit the national and regional economies (Fuchs, 2010). Despite this alarming signs, it seems climate change is not a priority concern for the public (Whitmarsh, 2011).
Few people perceive climate change as a direct and personal risk. One survey found 74% of Indonesians believe that climate change is real. However, behavioral response to climate change including prevention and protection has been limited. Less than 8% of the population has taken precaution such as signing up for early warning system, having emergency plan and subscribing to weather reports (Copsey et al., 2013)
There are various individual and social barriers to public engagement with it as a risk issue (Lorenzoni,2007) . The disparity between public awareness and concern about climate change on the one hand, and the limited behavioral response on the other is consistent with the widely-reported 'value-action' or 'attitude-behavior' (Agyeman & Angus, 2002).
"W hy do people respond to changes and climate and what are the barriers for them to take action and be willing to act as in pro-environmental behavior?' is extremely complex. We use the concept of 'pro-environmental behavior' by Aygeman 20025 which is simply a behavior that consciously seeks to minimize the negative impact of one's actions on the natural and built world (e.g. minimize resources and energy consumption, use of non-toxic substances, reduce waste production). Numerous theoretical frameworks have been developed to explain the gap between the possession of environmental knowledge and environmental awareness, and display pro-environmental behavior (Agyeman & Angus, 2002). The notions from various literature of public understanding of climate change indicate that individuals perceive a wide variety of barriers to engag with climate change. However, there are only limited empirical data that address these barriers. The psychological barriers of dissonance and denial to behavioral change in light of alternative energy futures have been discussed (Stoll-Kleeman et al , 2001). Rajecki (1982) explains this gap; there are four dimensions that contribute to act less responsive to changes and environment that prevent people from being more pro-environment; they are: direct versus indirect experience, normative influences, temporal discrepancy and attitude-behavior measurement.
Hines et al.., however, has had a different approach in explaining
pro-environmental behavior. Hines, Hungerford and Tomera published their Model of Responsible Environmental Behavior which was based on Ajzen and Fishbein's theory of planned behavior (Hines et al., 1986–87; Hungerford & Volk 1990). They did a meta-analysis of 128 pro-environmental behavior research studies and found the following variables associated with responsible pro- environmental behavior:
- a) Knowledge of issues: the person has to be familiar with the environmental problem and its causes. Knowledge of action strategies: the person has to know how he or she has to act to lower his or her impact on the environmental problem.
- b) Locus of control: this represents an individual's perception of whether he or she has the ability to bring about change through his or her own behavior. People with a strong internal locus of control believe that their actions can bring about change. People with an external locus of control, on the other hand, feel that their actions are insignificant, and feel that change can only be brought about by powerful others.
- c) Attitudes: people with strong proenvironmental attitudes were found to be more likely to engage in proenvironmental behavior, yet the relationship between attitudes and actions proved to be weak.
- d) Verbal commitment: the communicated willingness to take action also give some indication about the person's willingness to engage in pro-environmental behavior.
- e) Individual sense of responsibility: people with a greater sense of personal responsibility are more likely to have engaged in environmentally responsible behavior.
There seem to be many more factors that influence pro-environmental
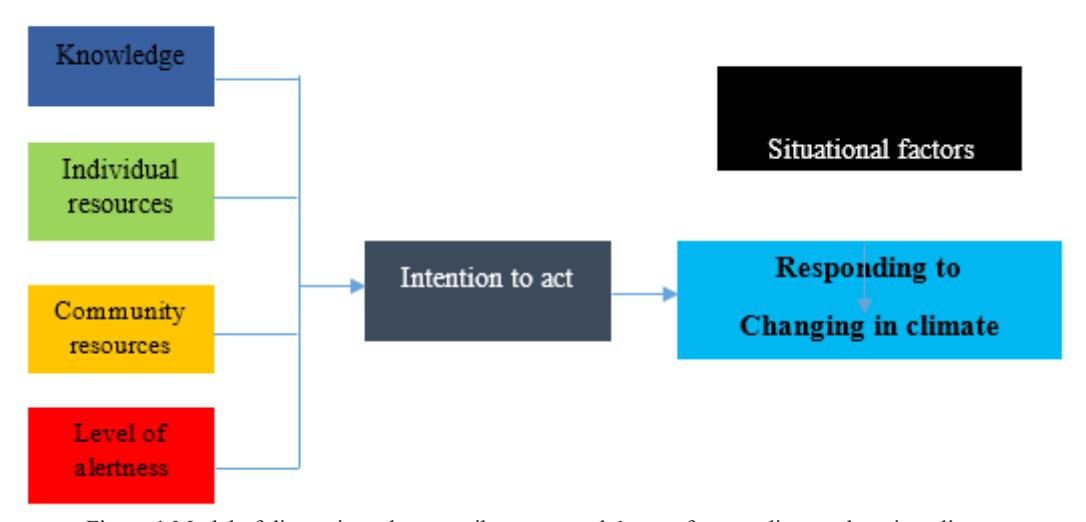
Figure 1 Model of dimensions that contribute to people's act of responding to changing climate (Adaptation from Models of Predictors of Environmental Behavior from Hines et al, 1987 )
behavior. Hines et al. (1986–87) called these 'situational factors', which include economic constraints, social pressures, and opportunities to choose different actions.
This paper will adapt Hines (1987) models of predictors of environmental behavior (figure 1). While Hines mention knowledge of issues, locus of control, attitudes, verbal commitment and individual sense of responsibility, this paper will use knowledge, individual resources, community resources and level of alertness as predictors of why people respond and lead to pro-environmental behavior.
METHOD
To assess people's understanding and responses to climate in greater Jakarta, we used Communication Effectiveness Response Assessment Method (CERAM). This method was a modification of RAPFISH (Rapid Appraisal Technique for Fisheries) developed by Pitcher (1999) for evaluating the sustainability of fisheries. CERAM assesses index and status of responsiveness of each region within Greater Jakarta defined by various dimensions, namely knowledge, individual resources, community resources and level of alertness.
There are 1261 respondents who participated in this research; the data were acquired by Climate Asia research in Greater Jakarta. The quantitative research was carried out during the dry season. If it had been carried out at a different time of the year, it might have produced slightly different results, for instance in perceptions of change in rainfall.
In CERAM, each dimension consists of a list of attributes and scores based on respondents' answer. The score of each attribute used 'good' and 'bad' ordination. Table 1 Shows the list of attributes of each dimension which conveys a different modality of responsiveness.
This study would generate 3 analyses; first analysis is CERAM, containing the result of multidimensional scaling ordination (MDS); second, leverage analysis of each scored attribute and Monte Carlo analysis used to estimate an error (Sia,1986).
F r o m L e v e r a g e a n a l y s i s , within knowledge dimension, the highly influential attribute is taking
TABLE 1 LIST OF DIMENSION AND ATTRIBUTES FROM CERAM
| DIMENSION AND ATTRIBUTE | Scoring | Good | Bad | Notes |
|---|---|---|---|---|
| KNOWLEDGE | ||||
| Having heard the phrase of "climate change" | 1;2;3 | 1 | 3 | yes (1); Yes, but I don't know what it means (2);no(3) |
| Impact perceived | 1;2;3 | 3 | 1 | low (1); medium(2);high(3) |
| Preparedness to face extreme weather event | 1;2;3;4;5 | 5 | 1 | Not at all prepared (1); not very prepared (2); neither|nor (3); quite prepared (4); Very prepared (5). |
| Having disaster preparedness plan | 1;2;3 | 1 | 3 | Already done it (1); yes(2); no(3) |
| Signing up for early learning alert | 1;2;3 | 1 | 3 | Already done it (1); yes(2); no(3) |
| Well informed about climate change | 1;2;3;4;5 | 5 | 1 | Not at all informed (1); not very well informed (2); neither|nor (3); fairly well informed (4); Very well informed (5). |
| Knowledge on existing communication | 1;2 | 1 | 2 | yes (1); no (2) |
| Media coverage on water/food/energy | 1;2;3;4 | 4 | 1 | Not at all well(1); not very well (2); fairly well (3); very well |
| Apathy | 1;2;3 | 1 | 3 | low (1); medium(2); high(3) |
INDIVIDUAL RESOURCES
| DIMENSION AND ATTRIBUTE | Scoring | Good | Bad | Notes |
|---|---|---|---|---|
| Household income | 1;2;3;4;5;6 | 6 | 1 | We don't have enough money, even for food (1); We can afford food but purchasing of clothes is a serious problem (2); We can afford food and clothes, but purchasing of durables such as TV set or a refrigerator is difficult for us (3);We can afford main household appliances, but purchasing a car is beyond our means (4); What we earn is sufficient to buy anything except such expensive purchases as an apartment or house (5); We do not face financial problems. If necessary we can buy an apartment or a house (6). |
| Saving | 0;1 | 1 | 0 | no (1); yes (2) |
| Taking Out Insurance | 0;1 | 1 | 0 | no (1); yes (2) |
| Willingness to change livelihood | 1;2;3 | 3 | 1 | low (1); medium(2);high(3) |
| Willingness to change lifestyle | 1;2;3 | 3 | 1 | low (1); medium(2);high(3) |
| Willingness to recycle water | 1;2;3;4;5 | 5 | 1 | Not at all unlikely (1); not very unlikely (2); neither|nor (3); quite likely (4); Very likely (5). |
| Willingness to use renewable sources of energy | 1;2;3;4;5 | 5 | 1 | Not at all likely (1); not very likely (2); neither|nor (3); quite likely (4); Very likely (5). |
| DIMENSION AND ATTRIBUTE | Scoring | Good | Bad | Notes |
|---|---|---|---|---|
| Willingness to keep food and change diet | 1;2;3;4;5 | 5 | 1 | Not at all Likelihood of doing (1); not very Likelihood of doing (2); neither|nor (3); quite Likelihood of doing (4); Very likely Likelihood of doing (5). |
| Number of response taking | 1;2;3 | 3 | 1 | low (1); medium(2);high(3) |
| COMMUNITY RESOURCES | ||||
| Government regularly listening to people | 1;2;3;4;5 | 5 | 1 | Not at all agree (1); not very agree (2); neither|nor (3); quite agree (4); Very agree (5). |
| Neighborhood working together to solve problems | 1;2;3;4;5 | 5 | 1 | Not at all agree (1); not very agree (2); neither|nor (3); quite agree (4); Very agree (5). |
| Feel involved in decision making | 1;2;3;4;5 | 5 | 1 | Not at all agree (1); not very agree (2); neither|nor (3); quite agree (4); Very agree (5). |
| Talking to others about taking action | 1;2;3;4;5 | 5 | 1 | Never (1); not very often (2); neither|nor (3); quite often (4); Very often (5). |
| Political cynicism | 1;2;3 | 3 | 1 | low (1); medium(2);high(3) |
| LEVEL OF ALLERTNESS | ||||
| Taking Action to response to changes | 1;2;3;4;5 | 1 | 5 | strongly disagree (1); disagree (2); neither|nor (3); agree (4); strongly agree (5). |
| Not knowing to respond | 1;2;3;4;5 | 1 | 5 | strongly disagree (1); disagree (2); neither|nor (3); agree (4); strongly agree (5). |
| DIMENSION AND ATTRIBUTE | Scoring | Good | Bad | Notes |
|---|---|---|---|---|
| Not having access to information | 1;2;3;4;5 | 1 | 5 | strongly disagree (1); disagree (2); neither|nor (3); agree (4); strongly agree (5). |
| Care about the natural environment | 1;2;3;4;5 | 5 | 1 | strongly disagree (1); disagree (2); neither|nor (3); agree (4); strongly agree (5). |
| Feeling guilty when not taking action | 1;2;3;4;5 | 5 | 1 | strongly disagree (1); disagree (2); neither|nor (3); agree (4); |
| Community cohesion | 1;2;3 | 3 | 1 | low (1); medium(2);high(3) |
RESULT AND ANALYSIS
Prior to CERAM model being applied, it was deemed necessary to test its reliability. Thus, parameter of S-stress and value of R-Sq were used. Value of s-stress from each dimension was under 0.25, which means the table is acceptable and reliable to be employed. Based on Pitcher (1999), a model can be admitted as goodness of fit if the stress value is less than or equal to 0,25 And the number (R2) is also high (87,5 % to 93.7 %). According to Kavanagh (2001) if the coefficient is above 80%, then the model is good to be used.
The MDS result is shown in Table 3. Performance of Greater Jakarta's four cities showed that Bogor has had the highest score (61,14) when compared to the other three cities which are relatively below the average (30). However, within the individual resources, Bekasi City holds the highest score up to 71,47, while in community resources Jakarta as a province and Tangerang as a city have had almost the same number (58.82 and 58.81). In the level of alertness, Bogor has had the highest score of 87.26.
TABLE II CERAM TEST
| No | Parameter | Knowledge | Individual Resources | Community Resources | Level of alertness |
|---|---|---|---|---|---|
| 1 | S-Stress | 0.14 | 0.15 | 0.21 | 0.18 |
| 2 | Squared Correlation (RSQ) | 93.64% | 92.87% | 87.49% | 93.64% |
| 3 | Number of iterations | 2 | 3 | 3 | 3 |
| City | Knowledge | Individual Resources | Community Resources | Level of alertness |
|---|---|---|---|---|
| Jakarta | 30.83 | 53.44 | 58.82 | 63.90 |
| Bogor | 61.14 | 56.76 | 63.72 | 87.26 |
| Bekasi | 33.51 | 71.47 | 44.60 | 51.70 |
| Tangerang | 37.48 | 45.78 | 58.81 | 63.95 |
TABLE 3 MULTI DIMENSIONAL SCALING (MDS) RESULT FROM CERAM
out insurance, willingness to change lifestyle, and willingness to change livelihood. In individual resources dimension, meanwhile, the highly influential attribute is signing up for early learning alert, having disaster preparedness plan and knowledge on existing communication. In communal resources dimension, the attribute highly influencing its score result are talking to others about talking action, feeling involved in decision making and neighborhood working together to solve
problems. The last dimension, the level of alertness, responding (not knowing to respond) and care about natural environment have highly contributed to the end result. Based on Kavanagh and Pitcher (2004), Monte Carlo Analysis is used to evaluate the level of uncertainty. As shown in Table 4 the gap between Monte Carlo analysis and MDS values are from 0,04% to 3,81 %. This is used as proof that error in input process has been minimized.
Overall, the index has shown the
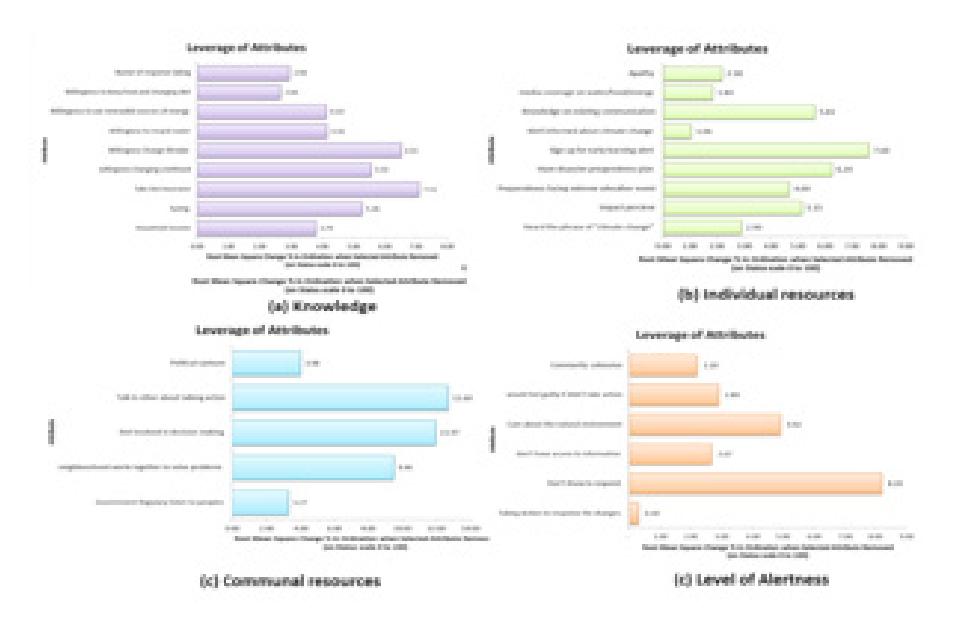
Figure 2 leverage analysis to each dimension
| TABLE IV MONTE CARLO ANALYSIS |
|---|
| Dimension/ Indicator | City | MDS | Monte Carlo | Difference | 96 |
|---|---|---|---|---|---|
| Jakarta | 30.83 | 32.05 | 1.22 | 3.81% | |
| ledg. | Bogor | 61.14 | 60.90 | 0.25 | 0.40% |
| Knowledge | Bekasi | 33.51 | 34.49 | 0.98 | 2.83% |
| 4 | Tangerang | 37.48 | 38.87 | 1.39 | 3.57% |
| - 5 | Jakarta | 53.44 | 53.00 | 0.44 | 0.83% |
| idua urce | Bogor | 56.76 | 55.31 | 1.45 | 2.62% |
| Individual | Bekasi | 71.47 | 69.46 | 2.00 | 2.88% |
| Tangerang | 45.78 | 45.95 | 0.17 | 0.38% | |
| Đ. ia | Jakarta | 58.82 | 59.06 | 0.24 | 0.41% |
| urce | Bogor | 63.72 | 62.86 | 0.86 | 1.36% |
| Community | Bekasi | 44.60 | 44.72 | 0.12 | 0.28% |
| 2 m | Tangerang | 58.81 | 58.79 | 0.02 | 0.04% |
| Level of alertness | Jakarta | 63.90 | 62.96 | 0.94 | 1.49% |
| Bogor | 87.26 | 84.98 | 2.28 | 2.69% | |
| Bekasi | 51.70 | 51.36 | 0.34 | 0.65% | |
| Tangerang | 63.95 | 63.47 | 0.49 | 0.76% |
region is fairly good in responding to climate change, with Bogor responding the most compared to other regions. Looking through each dimension, it is likely to have a variety of index values. Knowledge dimension in Bogor has the highest status of (61.14) and the lowest index within the dimension is Jakarta (30.83). On the individual resources, Bekasi holds the highest rank (71, 47), while Tangerang is the lowest in the dimension (45.78). Community resource in Bogor is high (63, 72) and at the same time Bekasi is the lowest (44.60). On the last dimension, Bogor (87.26) is likely to be more alert, compared to other regions.
The most influencing attributes regarding the index and status response are willingness to take out insurance, willingness to change lifestyle (knowledge); signing up for early warning alerts and disaster preparedness plan (individual resources), talking to others about taking action and feeling involved in the decision making (communal resources) and not knowing to respond and care about natural environment (level of alertness).
Why have Jakartans been less likely to respond to extreme weather? Why do Jakartans not make use of their resources and unite to take action? Latane and Darley (1970) describe this situation in a book titled 'The Unresponsive bystander: Why doesn't he help'. The book describes the five-stage model to understand why people do not help other people in emergency. Using this model, we explore three out of five stages which describe why Jakartans are less likely to respond to extreme weather events.
First stage, noticing the event. Many environmental problems are not particularly noticeable during the calm period. People who are intimately tied to the environment do tend to notice the environmental changes that are taking place. In case of people
living in Jakarta, people are less likely to seek information relevant to potential environmental hazards as people are less likely attached to the specific nature setting.
Second stage, interpreting the need of help. Once people take note of the changes taking places around them, they will realize these changes indeed indicate an emergency. Psychological studies demonstrate that human beings are very skilled at denying that which is inconvenient. This is particularly likely to happen when people are made to be afraid. Current information to make people take action found that communications are designed to motivate action trough fear. Producing attitude of change is far beyond the current communication. Instead of supporting people to take action, it has instead led people to feel anxious and motivated to avoid thinking about the distressing information.
Based on a discussion in North Jakarta, it is shown that optimism is another factor that can lead people to fail to take action. We all agree optimism is a positive trait. However, optimism in case of flood disaster in Jakartans has created lots of leeway. To some extent, people believe that the engineers and the authorities are prepared with an advance technology to overcome flood. Unfortunately, in the situation Jakarta is facing, it seems that the optimism has led to inaction.
Third stage, feeling personally responsible to act. Responsibility to act is subjectively defined and it causes diffusion of responsibility. To take action people need to be motivated. With more individuals saying 'it's not my job' or 'there is the government to clean up the river bank', the psychological barriers added up.
Given the fact that the act to respond to extreme weather event needs a proper precaution, it is an urgent call to develop norms that can be an unspoken guideline for behavior in facing extreme weather events. Reconnecting to nature will be another priority. A fundamental shift is needed towards broader and grater behavioral engagement of Greater Jakartans which provides incremental benefits in addressing
extreme weather events.
CONCLUSION
Based on CERAM, Bogor is leading in most of the dimensions, while Bekasi holds the highest with individual resources. Bogor has the highest status of (61.14) and the lowest index within the dimension is Jakarta (30.83). On the individual resources Bekasi holds the highest rank (71, 47), while Tangerang is the lowest in the dimension (45.78). Community resources in Bogor are high (63, 72) and at the same time Bekasi is the lowest (44.60). On the last dimension, Bogor (87.26) is likely to be more alert, compared to other regions. Oddly, Jakarta as a province is less likely to hold the ladder in each dimension. Its people with less attachment to their natural environment in their daily life may have contributed to the situation.
It has long been known that the prediction of behaviors is an extremely complex process which is based on multitude factors. Each activity to drive pro-environmental behavior that creates an enabling environment for people to respond to the changing climate needs to be more efficacious.
REFERENCE
Agyeman, J. & Angus, B. (forthcoming). Community-based social marketing for sustainability: tools and approaches for changing personal transportation behavior
Copsey, T., Dalimunthe, S., Hoijtink, L. and Stoll, N. (2013). Indonesia: How the people of Indonesia live with climate change and what communication can do. London : BBC Climate Asia
Fuchs, R. (2010). Cities at risk: Asia's coastal cities in an age of climate change. Asia Pacific Issues, No. 96, Honolulu: East-West Center.
Hines, J.M., Hungerford, H.R. & Tomera, A.N. (1987). Analysis and synthesis of research on responsible proenvironmental behavior: a metaanalysis, The Journal of Environmental Education, 18(2), pp. 1–8.
- Hungerford, H.R. & Volk, T.L. (1990) Changing learner behavior through environmental education, The Journal of Environmental Education, 21(3), pp. 8–21.
- Kavanagh, P and T.J Pitcher. (2004). Implementing Microsoft Excel Software For Rapfish: A Technique For The Rapid Appraisal of Fisheries Status. Fisheries Centre Research Reports 12(2). The Fisheries Centre: University of British Columbia.Canada
- Latane, B., & Darley, J. M. (1970). The unresponsive bystander: Why doesn't he help? New York: Appleton-Century-Crofts
- Lorenzoni, I., S. Nicholson-Cole, and L. Whitmarsh. (2007) Barriers perceived to engaging with climate change among the UK public and their policy implications. Global Environmental Change 17 (3-4). 445-459
- Pitcher, T.J. 1999. Rapfish, A Rapid Appraisal Technique and its Application to The Code of Conduct for Responsible
- Fisheries. FAO Fisheries Circular No.947:47 pp
- Rajecki, D.W. (1982). Attitudes: themes and advances. Sinauer Associates
- Sia, A.P., Hungerford, H.R. & Tomera, A.N. (1986). Selected predictors of responsible environmental behavior: an analysis, The Journal of Environmental Education, 17(2), pp. 31–40.
- Stoll-Kleemann, S., T. O'Riordan, and C.C. Jaeger .(2001). The psychology of denial concerning climate mitigation measures: Evidence from Swiss focus groups. Global Environmental Change, 11 (2), 107–18.
- Whitmarsh, L. (2011). Skepticism and uncertainty about climate change: dimensions, determinants and change over time. Global Environmental Change, 21 (2), 690–700.
ACKNOWLEDGEMENT
Paper was presented at The 5th International Conference of Jabodetabek Study Forum. The data use from Climate Asia survey. The data base available as online version and can be retrieved from www.bbc. co.uk/climateasia