
ABSTRACT
Ketidakseimbangan antara sisi sediaan dan permintaan dalam sistem transportasi Kota Bandung telah menjadi penyebab menurunnya kinerja transportasi. Pendekatan sisi sediaan melalui penambahan kapasitas jaringan jalan dipandang tidak efektif karena keterbatasan ruang kota. Di pihak lain, pendekatan sisi permintaan merupakan alternatif solusi yang cukup prospektif. Di antara berbagai pendekatan sisi permintaan, carpooling dipandang sebagai skema yang cukup menjanjikan untuk mengurangi volume lalu-lintas melalui peningkatan rata-rata tingkat keterisian kendaraan. Skema ini dikembangkan dengan menarik sejumlah pelaku pergerakan yang memiliki lokasi tujuan dalam koridor yang sama untuk bergabung dalam satu kendaraan. Riset ini dilakukan untuk memahami kelayakan dari pengembangan skema carpooling dari perspektif preferensi pelaku pergerakan. Berdasarkan studi kasus Kawasan Pemukiman Arcamanik-Kota Bandung, hasil penelitian menunjukkan skema ini cukup potensial untuk diimplementasikan, dengan prosentase awal responden yang bersedia beralih ke skema carpooling sebesar 93%. Namun, setelah mekanisme penyesuaian angkutannya disampaikan, tingkat kebersediaan responden turun menjadi 71% pada kepergian serta 79% pada kepulangan. Penelitian ini lebih lanjut mengidentifikasi beberapa kendala dalam memenuhi preferensi responden pada pengembangan skema carpooling. Kendala tersebut di antaranya sistem penjemputan penumpang dari satu titik ke titik yang lain serta rata-rata jarak berjalan menuju titik penjemputan yang tidak dapat dipenuhi sepenuhnya. Kata kunci:carpooling, kemacetan, preferensi pelaku pergerakan
INTRODUCTION
Kusbiantoro (2009) stated that transportation system consists of three sub-systems, i.e. network system, activity system, and trip system that are closely related to urban activity system (Meyer and Miller, 2001). Various activities are conducted by the community to fulfill their daily needs. These activities stimulate trips from one place to another or to conduct activities in places with different location where they live (Tamin, 2000). A large number of activities in fulfilling daily needs conducted by the community had increased the number of trips. This increase in trips has an implication on the increase of transportation demand. Unfortunately, imbalance transport supply-demand has caused a common problem in urban transportation, traffic
congestion (Herman, et.al, 2002).
Bandung City as one of large cities in Indonesia could not avoid this traffic congestion problem. One reason that causes the imbalanced supply and demand in transportation is the excessive use of private vehicle. As an illustration of the rapidly increased transport problems in Bandung city, in 2013, there were 44 points of congestion identified, an increase of 12 points from 2009 (Masterplan of Bandung Transportation 2013-2033).
Various solutions to reduce congestion have been implemented, beginning from road widening until the enactment of contra flow system. Unfortunately, supply approach is no longer considered as an effective solution. This can be seen from the imbalance percentage between annual road length growth in Bandung which is around 1.29% and annual vehicle growth which is around 9.34% (Master Plan of Bandung City Transportation 2013-2033). The ever increasing traffic burden should be eased by the demand approach, in which the solution is intended to increase the effectiveness of road network instead of providing new road network.
One alternative scheme of demand approach that is considered as prospective to minimize congestion is carpooling. Although carpooling has been implemented in several developed countries, such as Germany, Switzerland, and Great Britain, this mechanism has not been popular in Indonesia, and even more in Bandung. Therefore, to figure out whether or not this carpooling mechanism, particularly the one organized by service provider, is feasible to be implemented in Bandung, a study is needed to investigate potential traveler preference about the prospect of carpooling development in Bandung City.
Literature Review Carpooling
Carpooling is a scheme of traveling together of two or more people who live close to each other in one residential area, and who have a relatively similar trip schedule and destination (Loukakos and Picado, 2000). This resulted in a shift of mode from single-occupant vehicle (SOV) where the passenger in one private vehicle is the driver (with only few passengers), to high-occupant vehicle (HOV) where one private vehicle is operated in its full capacity. Thus, this scheme aims to increase private vehicle occupancy rate to its maximum level.
Carpooling can be well implemented in high density housing area, since the area usually generates higher trip generation compared to other areas. Besides reducing traffic burden, carpooling is also considered as a promising alternative solution that is capable to reduce travel cost for some travelers compared to using private vehicle. Also, the scheme offers travel time reduction for some travelers who usually use public transport because they no longer have to spend time to wait and change modes. The other potential benefit of carpooling scheme is to lower stress level of driving and to be more environmental friendly.
There are several types of carpooling, as follows:
- 1. Designated Driver Carpool (passenger pays the fare to the vehicle owner);
- 2. Alternating Carpool (taking turn using one's vehicle and the fare is paid by the driver);
- 3. Fleet Carpool Program (vehicle belongs to the company of transport operator, operational cost and fare are paid by the passengers).
In this research, the type of carpooling that will be discussed is fleet
carpool program which is later called organized carpooling.
According to Garrison Ward (2000), there are several conditions where individual traveler is willing to use carpooling, i.e.:
- 1. Living close to the route passed;
- 2. Working at the same place or close to each other;
- 3. Working at the same or almost the same time;
- 4. Having round-trip activity with a quite long distance, so it is quite alright when they have to add time to pick up other passenger.
Carpooling Experiences in Europe
Switzerland, for an assortment of reasons, can be known as the country of Car-Sharing. The first modern Car-Sharing service was implemented there. Also, after over 20 years of development, Switzerland – based on the number of population – has achieved a service and customer density level that is unique in the world (Loose, 2009).
Loose (2009) stated that in May 1987, two Car-Sharing associations were established independent of each other in Switzerland: the AutoTeilet Cooperative in Stans and the ShareCom Cooperative in Zurich. After ten years, in March 1997, they consented to a fusion and the present Mobility Cooperative was made. It is the main Car-Sharing supplier in Switzerland today.
By the end of 2008, Mobility had 84,500 clients who had access to 2,200 vehicles in the entire of Switzerland. Car-Sharing services are accessible in 430 cities and communities. This is an amazing level of coverage considering that there are just five cities in Switzerland with the populations of more than 100,000 and just four others with between 50,000 and 100,000 populations. Accordingly, the majority of Swiss towns in which Car-Sharing is offered are of a size at which, in other European nations, basically no Car-Sharing services would be found.
Similarly, considering that Switzerland has a population of just 7.7 million, is the large participant density. Based on the number of population, mobility has seven times more Car-Sharing demand than Germany, which has the highest number of Car-Sharing participants (Loose, 2009).
In early 2009, together, German Car-Sharing providers accounted for 137,000 Car-Sharing members (Loose, 2009). Consequently, 20 years after Car-Sharing was first presented, German Car-Sharing claimed the highest spot in Europe (in view of total number of participants). 3,900 Car-Sharing vehicles were accessible to them. The year 2008 was the second successive year with a net increment of in excess of 20,000 clients (i.e. in the wake of representing the loss of different members throughout the year).
Car-Sharing is offered in 270 German cities and communities. In all urban areas more than 200,000 and in almost all urban areas with in more than 100,000 populations, there is no less than one Car-Sharing provider. The less the number of population, the less the Car-Sharing operations (Loose, 2009).
The provider structure in German Car-Sharing is extremely inhomogeneous and decentralized. There are around 110 providers available, and the transitions from formal Car-Sharing to the informal sharing of cars among neighbors (with closed membership) is to some degree fluid. There is a propensity, particularly among the bigger Car-Sharing providers, toward amalgamation into bigger groups, or at least closer collaborations; in any case, new independent Car-Sharing providers keep on emerging (Loose, 2009).
1. Transport and Environment (2017), based on their article, stated that several researches collectively show the benefits of ride and car sharing schemes. Moreover, it also empowers behaviors which complement and support the use of public transport operations without directly competing with them. It includes: The evidence shows ride-sharing applications reduce the quantities of vehicles on the road and vehicle kilometers driven, and as importantly also support a behavioral shift towards multi-modal, sustainable transport which complement public and non-motorized transport (cycling and walking).
- 2. Car sharing schemes, whether point to point or free floating likewise prompt decreased car ownership based on the studies indicating 5 - 15 cars are replaced for each shared car added to the fleet.
- 3. Long-distance car-sharing services compete with rail and coach services in which they likewise fundamentally increase car occupancy and reduce emissions per kilometer.
Preference
In this research, traveler preference is used to figure out the scheme of carpooling service that can make someone to change mode from private vehicle to this alternative scheme. Preference is a tendency to select something that is more preferable than other choice. Furthermore, preference is part of individual decision making component (Porteus, 1977). There are several basic assumptions on someone preference (Feldman, et.al., 2006), i.e. as follows:
- 1. An assumption stating that people know what they like. They know their preference on various things;
- 2. An assumption stating about logical statement (Axiom) of transitivity. This axiom explains that if an individual states that A is preferable than B,
- then this individual will say that A is preferable than C. This axiom is also used to ensure the presence of an individual internal consistency in making decision;
- 3. An assumption stating that people always choose the best alternative out of the available alternatives.
METHOD
Method used in this research is quantitative method using statistical data to group data based on variable and type of respondents. M eanwhile, the nature of this research is explorative, in which the respondent's initial understanding about carpooling is developed. In addition, a test on the traveler preferences to use carpooling as an alternative mode of transport is conducted.
Data Collection Method
Data collection method in this research consists of literature study, secondary data collection, and primary data collection. The literature study is conducted by collecting and understanding various literatures related to carpooling mechanism. The secondary data collection is conducted by collecting data that assist this research in selecting study area, such as data on population demography. Meanwhile, the primary data collection is conducted by observation and questionnaire. The observation is conducted to figure out the real condition of study area, whereas questionnaire is proceeded to figure out public preferences on the implementation of organized carpooling scheme. The questionnaire distribution is conducted based on the calculation of sample as follows:
\[n = \frac{z^2 \times P(1-P)}{E^2}\]
n = number of sample; Z = confidence level;
P = population variation; E = sampling error
In determining the number of samples, there are several things to be considered, i.e.: (1) the precise population number is unknown; (2) 95% confidence level, so that the value of z is 1.96; (3) population variation is assumed to be heterogeneous with 50:50 proportion; and (4) 10% sampling error. Based on those considerations, the number of sample is obtained, i.e. 96.04 which is then rounded off to 100 respondents.
The method for sample collection is non-probability sampling method where each member of population does not have the same chance to be chosen as part of the sample. Meanwhile, the sample collection technique is purposive technique or with certain consideration, i.e. the respondent should be someone using private vehicle, a car, to go to work to the center of Bandung City and its vicinity. In addition, in this research, stated preference method in the form of open-ended CV method and conjoint rating are also used. The open-ended CV method technique is used to obtain respondent answer on the respondent assessment toward qualitative attribute, such as the desired carpooling service.
Data Analysis Method
Data and information obtained from data collection are analyzed using quantitative analysis method, which includes descriptive statistical analysis and inference statistical analysis.
Descriptive statistical analysis is an analytical technique describing the collected data descriptively, so a general conclusion can be made. This analysis is done by displaying tables of data quantification result in the form of frequency distribution and crosstab, data presentation in the form of diagram, and calculates the central tendency of the obtained data. The data presentation in the form of table and diagram is intended to describe and present the available data better, so it can describe a characteristic condition in the study area. Central condition is done to find the most specific and representative single score in a group; whereas crosstab is used to see the inter-variable that is described through column and row.
Inference statistical analysis is a statistical analysis which is done in an effort to drawing a conclusion based on data obtained, one of which is using chi square test. Chi-square test is used to figure out the correlation or association of the research variables. This analysis only discusses whether or not there is a correlation between the two variables, but not how far the correlation is.
Case Study Overview
Kecamatan Arcamanik is one of the districts located in East Bandung area. According to the Regional Spatial Plan (RTRW) Bandung Year 2011- 2031, District Arcamanik is one of the eight Sub-Region City in Bandung. Arcamanik Sub-Region City with Arcamanik as the sub-service center will serve three districts, namely Kecamatan Arcamanik, Kecamatan Mandalajati, and Kecamatan Antapani. This location was chosen because of some considerations as follows:
- 1. Kecamatan Arcamanik is one of districts with the densest population located in East Bandung Region. In the Regional Spatial Plan (RTRW) of Bandung Year 2011-2031, East Bandung Region has been determined as a residential area;
- 2. Kecamatan Arcamanik shows characteristic of area suitable for carpooling application, which is high density housing;
- 3. The residential area of Kecamatan Arcamanik shows the characteristics of settlements for upper middle class
- society characterized by good quality permanent buildings and the existence of four-wheeled vehicles in most houses;
- 4. To reach the main road network to the city center, the people who live in the housing complexes spread in Kecamatan Arcamanik must use paratransit mode, such as motorcycle taxis. This leads to a relatively high level of private vehicle use in this area because there is a sense of uncomfortable and less practical if it has to be changed several times.
RESULT AND DISCUSSION
Traveler Preference on the Characteristics of Mode and Organized Carpooling Service
In this research, there are several things that need to be identified to figure out traveler preference on carpooling mode.
Figure 2 shows that the majority of respondents with significant percentage, i.e. 85%, prefer mini bus as their carpooling mode. This might happen because this type of vehicle is more flexible with occupancy level of seven persons which is suitable to become a common transport.
To figure out more qualitative community preference, a scale with range of 1-5 is used, where 1 = not very important (weight 0-100), 2 = not important (weight 101-200), 3= quite important (weight 201-300; 4 = important (weight 301-400); 5 = very important (weight 401-500).
Based on Table 1, almost all criteria belong to the quite important, important, and very important categories. Thus, for the implementation of this method, those criteria should be considered. The higher the score obtained, the more important is the criteria to be accommodated. From
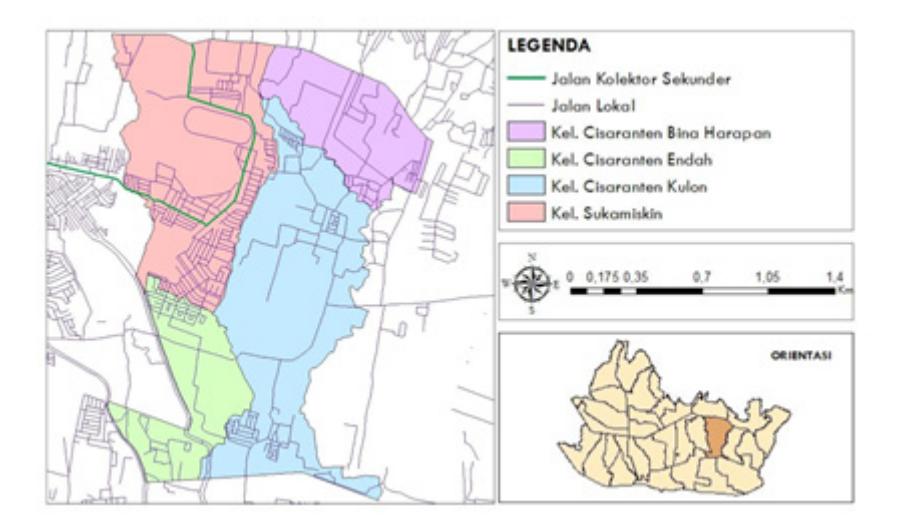
Figure 1 Kecamatan Arcamanik
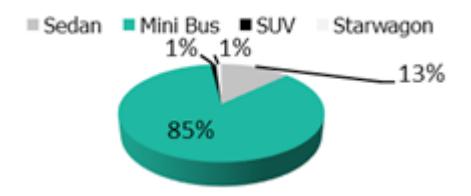
Figure 2 Type of Vehicle
TABLE I RESPONDENT ATTITUDE TOWARD MODE CHARACTERISTIC AND CARPOOLING SERVICE
| Total Score | Category | |
|---|---|---|
| Vehicle Condition | ||
| Vehicle <= 5 year usage | 437 | Very Important |
| Clean and Comfortable Vehicle | 421 | Very Important |
| AC is available | 412 | Very Important |
| Radio/Tape/VCD/DVD are available | 341 | Important |
| Safety belt is available | 411 | Very Important |
| Carpooling Service | ||
| Membership is available | 356 | Important |
| Security and safety guarantees | 398 | Important |
| Specific driver | 375 | Important |
| Other Passenger | ||
| Someone known | 246 | Quite Important |
| Fellow male/female | 173 | Quite Important |
| Not in sick condition | 282 | Quite Important |
| Regulation | ||
| Not allowed to smoke | 427 | Very Important |
| Not allowed to turn on the music loudly | 400 | Important |
| Not allowed to eat and drink | 207 | Quite Important |
| Not allowed to throw the garbage carelessly | 407 | Very Important |
| Incentive | ||
| Special lane is provided | 262 | Quite Important |
| Special parking place | 258 | Quite Important |
| Car Tax credit for participant | 267 | Quite Important |
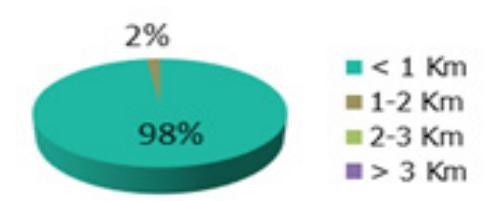
Figure 3 Maximum Distance between Participants
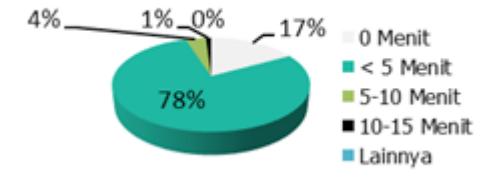
Figure 4 Duration of waiting time
each group, the criteria with the highest score are: the vehicle that has been used for no more than five years, the carpooling service that has security and safety guarantees, the other passengers that are not in sick condition, not smoking, and incentives in the form of car tax credit for carpooling participant who does-not use private vehicle.
Figure 3 and 4 show that the majority of respondent with very significant percentage, i.e. 98%, demanded the maximum distance among the carpooling participant does not exceed 1 km. This is related to the waiting time that can be tolerated by participants if there is another passenger who are late, where the majority of respondent, i.e. 78 %, can only wait no more than 5 minutes.
For the carpooling pick-up system, Table 2 shows that the majority of respondents, with very significant percentage, i.e. 93%, chose point to point pick-up system, where respondents wish to be picked-up at home and taken to the office, and vice versa.
Even if the participants have to assemble in a certain pool, the walking distance they prefer is only 50-100 meters as can be seen in Figure 5.
Acceptance Level of Organized Carpooling
Traveler acceptance toward organized carpooling needs to be identified since basically this traveler acceptance is the main factor of carpooling concept with voluntary nature. This part consists of willingness to be participant, factor related to willingness, and Willingness to Pay (WTP) to become participant.
Figure 6 shows that the majority of respondents with very significant percentage, i.e. 93%, are willing to change mode from private vehicle to carpooling if all preferences can be accommodated. Meanwhile, those who are not willing argue that common
transport, such as this carpooling tends not to be flexible, troublesome because of travelling with other people, and do not want to be bound with other people. The high percentage of respondents who are willing to change mode indicates that the potency of carpooling development in the study area is very significant to be done.
Meanwhile, for factors that are related to traveler willingness to use organized carpooling mode, after chisquare test is done, it is known that income is the only variable that is related with the willingness to change mode.
The significant relation between the willingness to use organized carpooling and income can be seen from significance value inn Table 3. Income shows significance value of 0.008 and since this value is ˂0.05, so H1 is accepted.
In addition to willingness and influential factor to use organized carpooling, the people's willingness to pay in order to use carpooling, should be known, considering that the mechanism provision will be done by private sector.
Table 4 shows that the average cost the traveler is willing to pay to use the mode is Rp. 22,000/person/day. Besides WTP as the result of questionnaire, other WTP can also be assumed, whether it is from transportation cost or monthly income. According to the questionnaire result, the majority of respondents spend transportation cost around Rp. 100,000 – Rp. 150,000. If the highest range is taken, the WTP respondent for transportation is Rp. 30,000/person/day. Meanwhile, for income, the majority of respondents have income around Rp. 5 million – Rp. 10 million. If the highest range is taken with an assumption that the ideal expenditure is 20% from income, and the size of the family is 4 persons with the mother as a housewife, then the WTP respondent for transportation is Rp32.000/person/day.
TABLE 2 PICK-UP SYSTEM
| Pick-up Mechanism | (%) |
|---|---|
| Pick-up at home and deliver to the office, and vice versa | 93 |
| Assemble in a certain pool | 7 |
| Pick-up at a pick-up point between home and office, and vice versa | 0 |
| Total | 100 |
TABLE 3 CHI SQUARE TEST RESULT
| Respondent Characteristics (Independent) | Sig Value. |
|---|---|
| Occupation | 0.432 |
| Income | 0.008 |
| Number of Car Ownership | 0.449 |
| Distance to Work Place | 0.985 |
| Transport Cost | 0.584 |
| Trip Chain | 0.575 |
TABLE 4 WTP TO BECOME CARPOOLERS
| Cost | Amount | Total |
|---|---|---|
| Rp15.000 | 13 | Rp195.000 |
| Rp20.000 | 42 | Rp840.000 |
| Rp25.000 | 32 | Rp800.000 |
| Rp30.000 | 6 | Rp180.000 |
| > Rp30.000 | 0 | Rp0 |
| Total | 93 | Rp2.015.000 |
| Avera | ige | Rp21.667 |
| Roundin | g off | Rp22.000 |
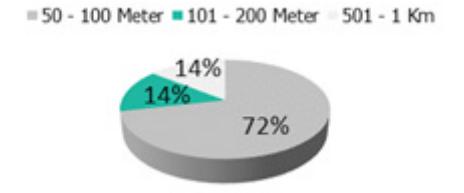
Figure 5 Distance of Walking
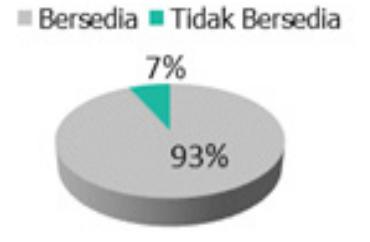
Figure 6 Willingness to Change Mode
The Potency of Organized Carpooling Development
Even though the level of traveler's willingness to change mode is very significant, i.e. 93%, the real potency of development should be identified through ride matching (time pattern and spatial pattern). Based on ride matching result by putting participants in groups, started from two-six persons in accordance with the desired level of car occupancy, there are only 71% of people that are potential to become carpoolers when they are leaving. Meanwhile, when returning home, there are 79% of people that are potential to become carpoolers.
The implementation of carpooling scheme should deal with some constraints. The first constraint is related to point to point pick up system. This system will make respondents time travel on their way home longer (95 minutes) than usual (45-60 minutes). In addition, another constraint is related to walking distance. If in the afternoon the pick-up system is point to point, then the walking distance that should be taken from the farthest is around 300 meters. This is not in line with the traveler preference not willing to walk if walking distance is over 100 meters.
CONCLUSION
The implementation of organized carpooling in Arcamanik, Bandung City, is very potential. This can be concluded based on the high percentage of respondents who are willing to change to this alternative mode, i.e. 93%. However, after ride-matching was analyzed (both time pattern and spatial pattern), potential respondents to become carpoolers decline to only 71% when leaving and 79% on the way back home.
Basically, travelers are willing to change mode from private vehicle to organized carpooling if all the desired preferences can be accommodated. Based on questionnaire analysis results, people preferences on organized carpooling are identified as follows:
- 1. The type of vehicle is mini bus with a capacity of 7 persons. At the same time, this vehicle also accommodates people preference related to vehicle condition that requires the availability of AC, Radio/Tape/VCD/DVD and safety belt for each passenger.
- 2. The vehicle is no more than five years old.
- 3. In terms of organized carpooling service, it requires membership, security and safety guarantee, and special driver.
- 4. In terms of other passenger characteristics, the travelers are not willing to share vehicle with someone who is sick.
- 5. In terms of vehicle regulation, the participants of organized carpooling are not allowed to smoke, turn on music loudly, and throw away the garbage carelessly.
- 6. In terms of incentive, participants wish that the government could provide special land and special parking space for carpooling and tax breaks for the participants who are not using private vehicle for daily travel.
- 7. The desired maximum distance between organized carpooling and their location is less than 1 km with waiting time of less than 5 minutes.
Unfortunately, not all of the preferences can be accommodated. There are constraints in the point to point pickup system and walking distance. If the point to point system is done, the time travel on the way home is 95 minutes which exceeds the usual time travel of 45-60 minutes. Meanwhile, if pool to point is done, the farthest distance must be taken by the participants is 300 meters which is farther than the desired distance of 50-100 meters.
There are things should be taken
- into consideration if this organized carpooling mechanism is implemented including:
- 1. Government should conduct socialization about this mechanism, formulate regulation that guarantees the legality of this mechanism, and formulate policy that can support the continuity of carpooling, such as subsidy and incentive, and cooperation with the office at the central part of Bandung City and its vicinity to develop information system on workers trip.
- 2. Another program is needed to support the existence of this mechanism, such as private vehicle limitation, increase in private vehicle tax, high parking tariff for private vehicle.
To follow up the obtained result of research, several continuing studies are proposed including:
- 1. Further study with bigger number of samples with smaller range of area, so the research will describe more of the traveler opinion.
- 2. Study on the impact of carpooling mechanism implementation of the performance of road network as a result of the decline in the number of vehicles.
- 3. Study on the impact of carpooling mechanism implementation on various aspects, such as social, economics, culture and environment.