
ABSTRAK
Penelitian ini mengkaji hubungan membaca review aplikasi, mencoba aplikasi, sikap, dan niat menggunakan aplikasi komunikasi. Sikap terhadap aplikasi dan niat menggunakan aplikasi berubah sebagai hasil dari review dan mencoba aplikasi. Eksperimen dilakukan di wilayah perdesaan untuk menguji dua belas aplikasi komunikasi dengan 80 partisipan yang bukan pengguna aplikasi komunikasi. Hubungan antarvariabel dianalisis menggunakan regresi statistik. Dari penelitian ini ditemukan perlakuan pada eksperimen tidak memengaruhi sikap maupun niat menggunakan aplikasi. Namun, sikap dapat memprediksi niat menggunakan aplikasi pada level moderat. Niat menggunakan aplikasi komunikasi tidak terhubung dengan review dan mencoba aplikasi tetapi terhubung dengan sikap partisipan. Hasil temuan menunjukkan eksperimen ini tidak cocok untuk mengonfrmasi model teori TAM, TRA, dan TPB. Penelitian selanjutnya yang melibatkan variabel lain (perceived usefulness, perceived ease of use, dsb) diperlukan untuk membuat model komprehensif yang dapat memprediksi niat menggunakan aplikasi.
Kata Kunci: aplikasi komunikasi, smartphone, sikap, niat menggunakan, eksperimen
INTRODUCTION
Communication is the dominant activity on smartphones. Although smartphones have a wide range of functions, more than 30 percent of people's time is spent on communication apps (Ericsson, 2016). Ericsson Consumerlab (2016) also reports that communication apps are 'always on', accessed most frequently and have a higher dependence on mobile broadband. The acceptance of communication apps is an important issue when the number of mobile apps keeps increasing (Hennig, 2014) and the business of mobile apps is flourishing (Yang, 2013).
Recent studies were conducted to understand the acceptance of mobile apps. They have identified the following psychological factors influencing consumer acceptance of mobile apps: perceived usefulness, perceived ease of use (Hassan, Kouser, Abbas, & Azeem, 2014; Yang, 2013), perceived enjoyment (Hassan et al., 2014; Shin, 2012), perceived usability, perceived quality, perceived aesthetic (Shin, 2012), perceived expressiveness, perceived
behavioral control, subjective norms (Yang, 2013), attitude toward mobile apps (Shin, 2012; Yang, 2013), intention to adopt (Hassan et al., 2014) and intention to use (Shin, 2012; Yang, 2013). All of these factors are an extension of the Technological Acceptance Model (TAM) (Davis, 1986), the Theory of Planned Behavior (TPB) (Ajzen, 1991), and the Theory of Reasoned Action (TRA) (Fishbein & Ajzen, 1975). These studies have inspired a considerable amount of empirical technological use. These studies, dominantly used 'shortitudinal' survey design and outcome measures, were taken as a self-reports (Sniehotta, Presseau, & Araújo-Soares, 2014). Meanwhile, experimental tests of these constructs have been surprisingly rare and have not supported the TPB's assumptions (Sniehotta et al., 2014).
The experiment was used in a previous study (Sniehotta, 2009) to test the TPB in the context of health behavior. Participants were randomized and placed in a behavioral-beliefintervention (BBI) group and a non BBI group; a normative-belief-intervention (NBI) group and a non NBI group; and a control-belief-intervention (CBI) group and a non CBI group, following a 2*2*2 experimental factorial design (Sniehotta, 2009). A recent study (Triberti, Villani, & Riva, 2016) also used an experiment to examine the TAM in the acceptance of virtual reality. The experimental session included two phases. In the first phase, each group explored a virtual environment. In the second phase, participants were asked to evaluate the usefulness and the ease of use of the virtual reality product (Triberti et al., 2016).
Most TAM studies assume that the behavioral intention to use technology comes from 'internal' variables. Perceived usefulness and perceived ease of use are conceptualized as opinions or judgments of the evaluated technology. On the contrary, numerous studies applying TAM do not consider possible external variables influencing the evaluation processes (Burton-Jones & Hubona, 2006). External interventions are analyzed in previous studies (Sniehotta, 2009; Triberti et al., 2016), yet they compromise on realism when participants used fictitious stimuli under artificial conditions (Yousafzai, Foxall, & Pallister, 2007).
Therefore, this study involves two external interventions; reading app reviews and trying apps to test the acceptance of communication apps. Users may look for reviews on an app's usability and potential bugs based on other user experience with the apps. The number of reviews in an app store may influence potential users' decisions (Hennig, 2014). Consumer rating and the rating number are also positively related to the number of app downloads (Song, Park, & Kim, 2013). Mobile app reviews are valuable repositories of ideas, comments, evaluations and feature requests coming directly from users (Iacob & Harrison, 2013). Learning to use or trying the computer strongly supports the adoption of novel technology (Bagozzi, Davis, & Warshaw, 1992). The degree to which the potential user possible can try the technology, or trialability, has a significant effect on willingness to use (Conrad, Michalisin, & Karau, 2012). Conrad and colleagues (2012) also reveal that the willingness to use is higher when trialability is high. Trialability also has positive effects on the introduction of new technology or the infusion of knowledge management systems (Hester, 2011). The possibility to try IT innovations is important for early adopters as the ability to try technology will decrease the levels of uncertainty about new ideas (Rogers, 2003). The ability to try novel technology may be a very critical factor and generally more acceptable to individuals than technology that is simply thrust upon them (Conrad, 2013). Based on these assumptions, this study proposes four hypotheses suggest that treatment interventions will positively affect attitudes toward apps and intention to use apps for those who are not communication app users.
Attitude is a person's general feeling of favorableness or 'unfavorableness' toward a stimulus object (Fishbein & Ajzen, 1975). In other words, attitude, simply, is a personal evaluation of behavior (Ajzen, 1991). In this study, attitude is defined as a potential user's overall evaluation of preferences for communication apps. An individual's attitude toward technology determines the intention to use technology, as well as perception that it will lead to positive outcomes (Compeau & Higgins, 1995). Intention is the indicator of an individual's readiness to perform a given behavior (Fishbein & Ajzen, 1975). It is also considered the immediate factor in explaining user behavior. This means that intention predicts actual behavior. In this study, intention to use is defined as an individual's willingness to accept, adopt, and use communication apps.
This study purposely chose noncommunication app users to avoid the interaction of history and treatment effects (Bracht & Glass, 1968). Participants who are daily users of communication apps would react to the treatments based on their memories. The 'extraneous' events would therefore occur during the experiments (Bracht & Glass, 1968). This strategy might reduce the external validity of the experiment research. This study involved an experiment in a rural and sub-urban area since previous studies have focused on the urban environment and university students. The participants of this experiment were probably familiar with specific communication apps but they were not users. This study involved 12 communication apps; (1) BlackBerry Messenger, (2) IMO, (3) Kakao Talk, (4) Kik, (5) Line, (6) Nimbuzz, (7) Tango, (8) Signal, (9) QQ Mobile, (10) Viber, (11) Telegram, and (12) Whats'App. These apps are recognized as the best or the most popular instant messaging apps on various websites. Thus, these hypotheses are proposed based on the TAM and previous studies of mobile apps (figure 1).
H1: Treatments are positively related to non-app user attitudes toward communication apps.
H2: Treatments positively predict the intention to use communication apps.
H3: Attitudes toward communication apps positively predict the intention to use apps.
H4: Treatments and attitudes
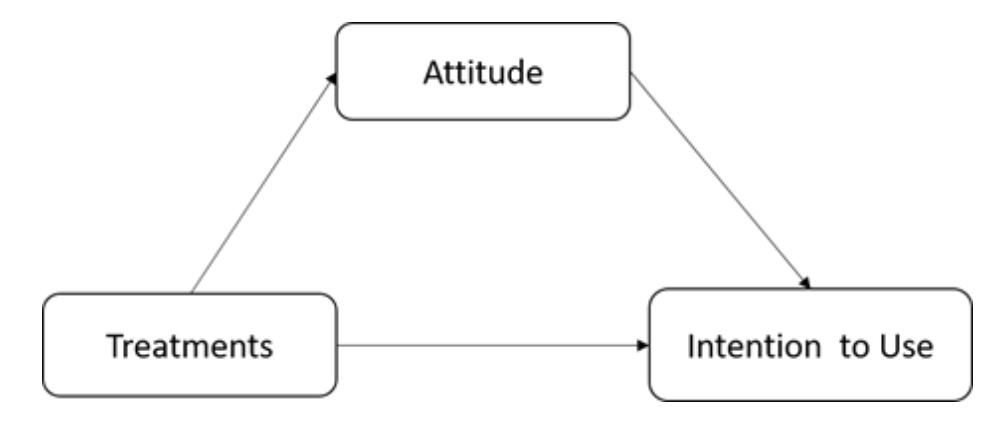
Figure 1 Proposed hypotheses based on the TAM and previous studies
| Yes | Trying apps (Treatment) | ||||
|---|---|---|---|---|---|
| No | |||||
| Reading app reviews | Yes | 1st group | 2nd group | ||
| (Treatment) | No | 3rd group | 4th group | ||
TABLE II INDICATORS OF VARIABLES ATTITUDE AND INTENTION TO USE
| Variables | Indicators | Scale | |
|---|---|---|---|
| Attitude | I have positive feeling toward communication apps | Five point | |
| (Shin, 2012; Yang, | I feel that my life is more interesting with communi cation apps | Likert scale | |
| 2013) | I pass along the electronic messages positively | ||
| I think that passing along the electronic messages is | |||
| good | |||
| Intention to use | I think I will use communication apps | Five point | |
| (Hassan et al., 2014; Shin, 2012; Yang, 2013) | I will recommend it to others | Likert scale | |
| I will visit apps that I like regularly | |||
| I will learn how to use apps | |||
| I will use the apps as long as my friends use them | |||
positively predict the intention to use communication apps.
METHOD
Participants were randomly assigned (Cook & Campbell, 1979) following a 2 (reading app reviews vs. no treatment) * 2 (trying apps vs. no treatment) factorial design with an immediate post-intervention (Scholin & Burns, 2012) measurement of attitude and intention to use.
Eighty participants (51 females, 29 males, between 15-18 years old, mean = 16.43, SD = .883) were recruited. The participants were screened with questions on whether they use communication apps, particularly instant messaging. The gender proportion was not considered because the screening result showed more women who did not use apps. The potential participants who were not users of any type of communication app were asked to participate in the experiment by sending a short message to their contacts. The participants were invited to a Public High School in Palangka Raya (Sekolah Menengah Atas Negeri 6 Palangka Raya). This school is located in the Bukit Batu sub-district and is about 30 km from Palangka Raya's downtown city.
The participants were asked to come to the School Computer Lab. Then, they were randomly divided into four equal groups and placed in different rooms. They were told that the experiment consisted of reading app reviews and/or trying apps and filling out a questionnaire aimed to evaluate their experience. The first group received two treatments which were reading app reviews and trying apps. The second group only read the app reviews. Meanwhile the third group tried the apps and the fourth group did not received any treatment. Then, they
| Constructs | Cronbach α | Variance Explained | VIF | KMO | Bartlett Test |
|---|---|---|---|---|---|
| Attitude | .702 | 52.9% | 1.001 | .674 | 56.818 |
| Intention to | .639 | 65.2% | 1.001 | .631 | 62.075 |
| use |
TABLE III RESULTS OF VALIDITY AND RELIABILITY TEST
were asked to sign an informed consent form to join the experiment.
The reading app reviews treatment consisted of a short-printed explanation about the products, app rating and the newest user comments on the Goggle Play Store. Participants were given 12 app reviews to read. For the trying apps treatment, participants tried 12 apps on an Android smartphone directly. Android smartphones were prepared for the first group and third group. Then, each participant tried the apps on the smartphone as follows. They (1) sent greeting texts, (2) sent a photo from the smartphone's gallery, (3) sent an emoticon sticker and (4) took a picture with the smartphone's camera and sent it to a specific contact. Then each participant got replies to their messages. Participants were also asked to choose two apps that most possibly will be adopted in future. During the experiment, all participants were only allowed to speak to the researcher. The experiment took no longer than two hours. At the end of the experiment, the participants received a t-shirt in appreciation of their participation.
Measurement
Attitude was measured by four indicators and intention to use consisted of five indicators (Table 2). Participants were asked to respond to all item questions as per the 5-point Likert scale from strongly disagree to strongly agree (Hassan et al., 2014).
The data were analyzed using SPSS 22. Relationships among treatments, attitude and intention to use variables were tested using linear regression analyses (Triberti et al., 2016). The reliability of the survey instrument was established by calculating Cronbach's Alpha to measure internal consistency (Hinton, Brownlow, & McMurray, 2004). A minimum requirement for reliability value is .60 (Churchill & Jr., 1979) although some scholars have different recommendations. Cronbach's alpha, exceeding .50 to .70 indicates moderate internal reliability and .70 to .90 indicates high internal reliability (Hinton et al., 2004). An alpha of .65 to .80 is often considered "adequate" by conventional scales used in human dimensions research (Vaske, Beaman, & Sponarski, 2017). Thus, attitude and intention to use are reliable as their values are above .60. In addition, a minimum of 50% variance is required to ensure acceptable reliability (Beavers et al., 2013). In this study, each construct exceeds the recommended level; attitude has 52.9% and intention to use has 65.2%. The variance inflation factor (VIF) test was also conducted to detect multi-collinearity. The VIF of each variable is below 10 (Attitude = 1.001 and Intention to Use = 1.001) and there is no evidence of severe multi-collinearity (Yang, 2013).
The construct validity was measured by calculating KMO (Kaiser-Meyer-Olkin Measure of Sampling Adequacy) and conducting the Bartlett Test of Sphericity (Kayisoglu, 2015). KMO's critical value is .5 and factor analysis can be conducted above this value. The variables in this study, attitude
TABLE IV DEMOGRAPHIC DATA OF THE PARTICIPANTS
| No | Variable | F | % | Mean | SD |
|---|---|---|---|---|---|
| 1 | Gender | ||||
| Male | 29 | 36.35% | |||
| Female | 51 | 63.75% | |||
| 2 | Age | ||||
| 15 | 12 | 15% | 16.43 | 0.883 | |
| 16 | 31 | 38.75% | |||
| 17 | 28 | 35% | |||
| 18 | 9 | 11.25% | |||
| 3 | Monthly Allowance | ||||
| Rp50.000 – 150.000 | 32 | 40% | Rp248.400 | 110.836 | |
| Rp150.001 – 250.000 | 15 | 18.8% | |||
| Rp250.001 – 350.000 | 21 | 26.3% | |||
| Rp350.001 – 450.000 | 12 | 15% | |||
| 4 | Monthly telecommunications cost | ||||
| Rp5.000 – 15.000 | 30 | 37.5% | Rp24.300 | 16.784 | |
| Rp15.001 – 25.000 | 20 | 25% | |||
| Rp25.001 – 35.000 | 8 | 10% | |||
| > Rp 35.001 | 22 | 27.5% | |||
| 5 | Starting learn computer | ||||
| Never | 2 | 2.5% | |||
| 2010 | 3 | 3.75% | |||
| 2011 | 4 | 5.0% | |||
| 2012 | 17 | 21.25% | |||
| 2013 | 25 | 31.25% | |||
| 2014 | 16 | 20.0% | |||
| 2015 | 7 | 8.75% | |||
| 2016 | 6 | 7.5% |
and intention to use, show a KMO value above .5. The Bartlett Sphericity Test score for the attitude variable is calculated as 56.818 (df = 6) and significant at .000 level. Meanwhile, the intention to use variable's value of the Bartlett Test is 62.075 (df=10) and significant at .000 level.
RESULTS AND DISCUSSION
The descriptive statistics of 80 participants are described in Table 3. This study showed that 63.75% of the participants were female. Participants'
TABLE V PARTICIPANT'S CHOICE OF MOST POSSIBLY ADOPTED COMMUNICATION APPS
| The First Choice (%) | The Second Choice (%) | ||
|---|---|---|---|
| BBM | 72.4 | Line | 50.0 |
| KakaloTalk | 6.2 | 10.0 | |
| Line | 5.0 | IMO | 8.7 |
| Telegram | 5.0 | BBM | 5.0 |
| 5.0 | Tango | 5.0 | |
| IMO | 2.5 | Telegram | 5.0 |
| Kik | 1.3 | Viber | 5.0 |
| Tango | 1.3 | KakaoTalk | 3.7 |
| Viber | 1.3 | Kik | 1.3 |
| Nimbuzz | 0 | Nimbuzz | 1.3 |
| Signal | 0 | Signal | 0 |
| QQ Mobile | 0 | QQ Mobile | 0 |
| No response | 0 | No response | 5.0 |
TABLE VI RESULTS OF HYPOTHESES TESTING
| Hypotheses | R | R Square | Sig | Results |
|---|---|---|---|---|
| H1 | .038 | .001 | .737 | Not Support |
| H2 | .024 | .001 | .823 | Not Support |
| H3 | .470 | .221 | .000 | Support |
| H4 | .471 | .221 | .000 | Support |
average age was 16.43 years old and they received an average monthly allowance from their parents of Rp 248,400 (equal to 18.61 USD). They regularly spent Rp 24,300 (equal to 1.82 USD) for communication via cell phone credit each month. In 2013, the highest percentage of use participant to use computer (31.25%), however there were two participants who had never learnt or used computer or laptop between 2010 and 2016.
BBM or BlackBerry Messenger is still preferred to be used in the future that majority of participants chose it as the first choice of communication apps (72,4%). In another hand, Line is considered as the second choice of communication apps that is probably
adopted (50.0%).
The relationship among experiment treatments, attitude and intention to use was found by conducting regression analysis (Table 4). Regression analysis allows prediction or estimation of the value of one variable (dependent variable) from one or more predictor variables (Tompkins, 1993). The R value represents the correlation between variables (Evans & Over, 1996). The regression test showed that H1 and H2 indicate a weak correlation while H3 and H4 indicate moderate correlation.
The R Square explains the total variation or variability of the dependent variable. The treatment variable can only explain 0.1% of attitude and intention to use. Attitude explained 22.1% of the intention to use (H3). In addition, H4 indicates that the treatments and attitude contribute 22.1% of intention to use. The sig column indicates the statistical significance of the regression model. The p value is less than .05 and shows that the regression model significantly predicts the dependent variable. In other words, it is a good fit for the data. The p values of H1 and H2 show more than .05. Meanwhile, H3 and H4 demonstrate less than .05. This means that H3 and H4 are a good fit and H1 and H2 are not.
This study tested four hypotheses to describe the relationship among treatments, attitude and intention to use. A regression test supported H3 and H4, which revealed a moderate correlation coefficient. The findings support previous studies (Shin, 2012) that also prove that attitude positively affects smartphone intention and usage. Users who have positive attitudes toward smartphones are more likely to use their services. Shin (2012) concludes that the effect of attitude on intention is significant. On the other hand, attitude explained only 22.1% of intention to use. This indicates that 77.9% of intention to use can be explained by other variables. Other variables should be considered such as perceived usefulness, perceived ease of use or perceived enjoyment when trying new apps. Previous research confirms that perceived ease of use is the main reason of why the LINE app is accepted in Indonesia (Aditya & Wardhana, 2016).
On the contrary, this study revealed that treatments have a weak correlation with attitude and intention to use. Probably, participants found negative comments when reading the app reviews. App reviews were dominated by user complaints related to problems that occurred during app usage (Ernungtyas & Irwansyah, 2016). Therefore, negative comments on app reviews could produce minor likability for participants that lead to the acceptance.
Difficulties while trying the communication apps may have also contributed to the weak correlation. Participants did not have any experience and they needed to learn new technology in a short time. This finding clarifies how people who will use technology can be predicted by their first experience with this technology (Bagozzi et al., 1992). Meanwhile, positive trialability suggests an individual's willingness to use a new technology (Conrad, 2013). In this case, reading app reviews and trying apps did not produce a positive evaluation from the participants.
This study also confirmed Sniehotta's (2009) criticism of the TPB. The theory does not account for the findings on behavioral change in this experimental study, as it does not address how people translate their intention into behavior nor provide an accurate theory of behavior (Sniehotta, 2009).
CONCLUSION
This experiment demonstrates that the treatment interventions did not fit with the TAM, the TRA or the TPB theories. It contributes to both method and theory, particularly in communication studies. The experiment interventions proved that reading app reviews and/or trying apps could be independent variables explaining the communication apps acceptance in order to add new concepts in the TAM, TRA/ TPB constructs. However, this study confirms that attitude is an important variable to predict intention to use. This study highlights that attitude was not affected either by reading app reviews or trying new apps. Intention to use communication apps was not related to treatment interventions but related to participants' attitudes. The findings also show that participants might have already had positive attitudes toward apps and thus the treatments did not affect the participant attitudes or intention to use. This study suggests the need to involve more variables which could potentially describe intention to use in future experiments.