
ABSTRAK
Kelincahan merupakan kemampuan dasar yang sangat dibutuhkan seorang atlet. Shuttle run merupakan salah satu metode yang dapat digunakan untuk mengukur kelincahan seorang atlet. Penelitian ini bertujuan untuk merancang dan mengembangkan alat shuttle run dengan data tersimpan berbasis Arduino. Instrumen shuttle run ini digunakan untuk menilai kecepatan dan daya tahan seseorang, dengan hasil disimpan dalam database dan kemudian dikirim ke situs web. Metode penelitian rekayasa diadopsi dalam penelitian ini. Pada instrumen ini, Arduino diprogram sebagai pengatur waktu yang dikendalikan oleh sensor untuk menghitung waktu lari seorang atlet, Sensor fotodioda mendeteksi atlet yang melewati shuttle, dan modul ESP8266 menghubungkan Arduino ke database. Data yang dikumpulkan oleh Arduino disimpan dalam database dan dapat diakses melalui internet. Keakuratan dan ketepatan pengatur waktu instrumen shuttle run diselidiki. Sepuluh siswa mengikuti tes untuk mengevaluasi kinerja instrumen shuttle run. Hasil pengukuran menunjukkan akurasi dan presisi instrumen yang diperoleh masing-masing 80,8% dan 99,5%. Berdasarkan hasil pengukuran, instrumen shuttle run akurat dan presisi untuk pengoperasian dalam penilaian kelincahan.
Kata kunci: shuttle run, kelincahan, photodioda, database
INTRODUCTION
Sport is no longer for fitness; it has progressed into a profitable industry (McDonald, Mihara, & Hong, 2001; McGrath, Cuneen, & Tobar, 2017). Each country competes to show its athletes' best talents. The success of athletes in various signing events can popularize a nation. The progression of sports is accompanied by the advancement of knowledge and technology in the sports. The breakthroughs of knowledge and technology can be seen in training (di Fronso et al., 2021; Rasmussen, Østergaard, & Glăveanu, 2019), competition instruments (Loland, 2002), and athlete fitness assessment (Blank, Sylvia, Garza, & Wade, 2014; Gabbett & Domrow, 2007). Apart from knowledge, there are numerous principles and techniques that influence athletes' performance in achieving their goals. Disciplines in sports science such as sport technology, anthropometry, and performance analysis all play a significant role in a competition (Jenkins, 2005).
In addition to the competition strategy, the athlete's skills and physical condition will determine the outcome of the match. Athletes' fundamental abilities are speed of movement agility, strength, endurance, and flexibility (Pate, 1983). Agility is one of the fundamental skills that an athlete should possess. The value of agility was shown in a person's ability to change position and direction as quickly as possible in response to a particular situation (Arshi, Nabavi, Mehdizadeh, & Davids, 2015).
Till now, agility measurements have been done manually by measuring an athlete's ability to run from one point to another in a set amount of time (shuttle run). A shuttle run is an exercise that requires you to change your body movements from one direction to another (Ramsbottom, Brewer, & Williams, 1988). In previous work, the shuttle run test is performed manually using a stop watch and manual counting (Léger, Mercier, Gadoury, & Lambert, 1988). instrument was developed. Furthermore, since the developed tool can only measure one person at a time, assessing a large group of people will take a long time.
To overcome the limitations of past findings, a shuttle run test instrument with stored data and multiple paths was developed in this study. Shuttle run was developed on Arduino and utilizes sensors to detect athlete movement. Arduino has several advantages when used in digital instruments (Ihsan, Yulkifli, & Yohandri, 2017). Several of the instruments being developed today have been Arduinobased (Handayani, Komaini, & Yohandri, 2020). Meanwhile, a photodiode sensor is used in this work to detect the athlete's movement and control the Arduino's timer. Photodiode sensors have a number of advantages compare to other sensors (Yotter & Wilson, 2003). The Arduino's measurement data will then be sent to the website's database. Data storage on online databases allows users to access data at any location and at any time.
Based on previous work, the objective of this research is to design and develop a shuttle run instrument with recorded data based on Arduino. The engineering research method was adopted in this work to investigate the performance of the instrument. Design and developed instrument are presented in the result. Moreover, the accuracy and precision of the instrument are also reported in the result section.
METHOD
Engineering research methods were adopted in this study. Several steps are used in the method, including describing the tool's specifications and designing the tool's modelling (Nallaperumal, 2014). The characteristics of the sensors are examined in this work. Furthermore, the accuracy and precision of the shuttle run system was investigated. This study includes the results of performance testing of an agility assessment. Ten students participated in the examination of the system's performance.
The shuttle run instrument was built using several modules and circuits, namely photodiode sensors, Arduino, power supplies, and LCD displays. In general, the block diagram of shuttle run instrument is presented in Figure 1.
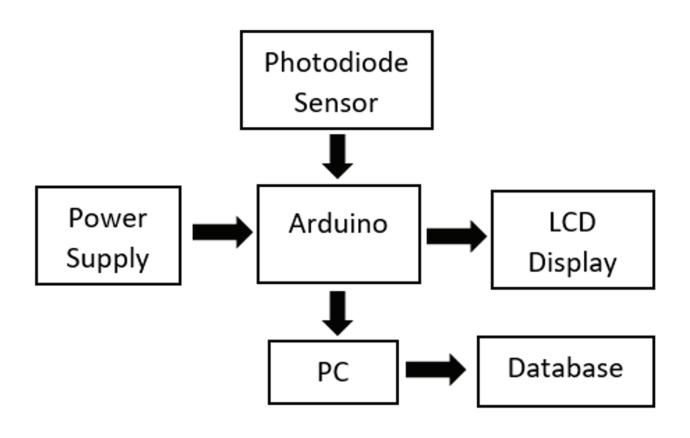
Figure 1 Block diagram of shuttle run instrument based on Arduino
Based on Figure 1, a personal computer (PC) is operated for delivering data to online database. Photodiode sensor is operated to detect the movement of the athlete. Schematic of the shuttle run test is presented in Figure 2.
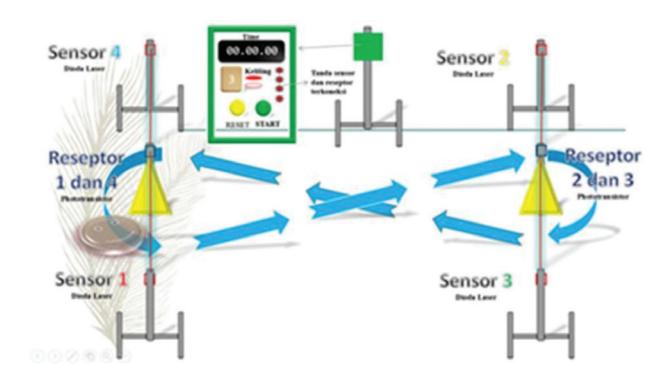
Figure 2 The schematic shuttle run test
The design of the Arduino Uno software begins with the development of software and flowcharts, as well as programming in such a way that the machine operates correctly. Figure 3 is a flowchart that depicts the design.
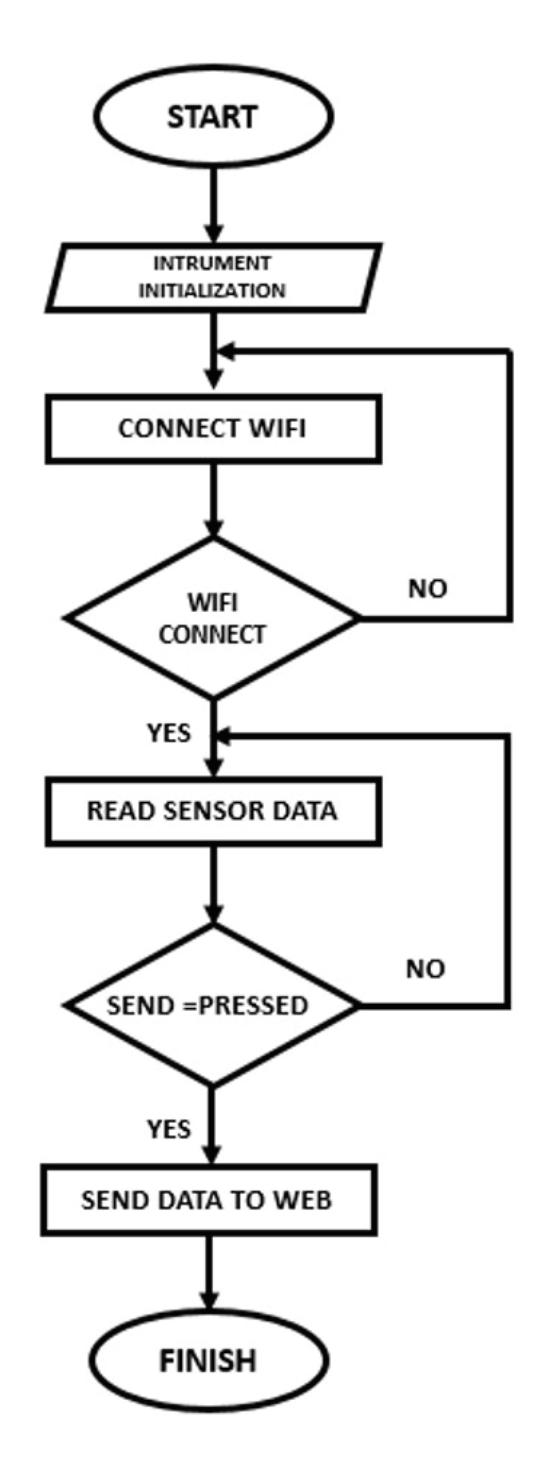
Figure 3 The shuttle run instrument flowchart
This programming begins with the tool's implementation, followed by its connection to Wi-Fi (if it is not attached, the process will be repeated), and finally, the sensor data will be read, stored in the database, and forwarded to a website for completing the process.
RESULTS AND DISCUSSION
This research includes researching instrument literature, defining measuring devices, deciding measuring instrument specifications, developing equipment designs which included installing electronic components one by one from each block diagram, programming the microcontroller according to the flowchart template, and producing hardware and mechanical machine tools. Then, an Arduino-based shuttle run unit, as well as the tool's accuracy and precision, are completed.
In a report, the data collected by analysis has a major effect since tSince the data must have precision and thoroughness derived from the test findings. This precision is determined by comparing its findings to those obtained from a conventional measuring instrument such as a stopwatch. A stopwatch was used as the traditional measurement device, and data was collected from ten students of various ages, races, body sizes, and weights. In addition, the precision data is collected during the shuttle run from ten different readings based on student performance at different periods and stages of exhaustion.
Efficiency Requirements for Shuttle Run
The duties of each are included in the performance requirements of the shuttle run instrument, which must be tested and analyzed. The data collected are the speed values; to make it simpler, the data from the shuttle run tool are stored in an Arduino-based database.
In the circuit board, there is an LCD and two manually operated buttons, including the start and reset buttons. There are also photodiode and infrared sensor poles in addition to the circuit board, where the sensor's measurement effects will be reflected on the LCD, as well as on the PC. At this stage the data will be saved in the database and sent automatically to a website. Figure 4 shows how to mount photodiode and infrared sensors.
Figure 4 Photodiode and infrared sensor installation
Since the runner's subject blocks infrared light, the first photodiode sensor can begin measuring the runner's speed without pressing the circuit box's start button. Similarly, as the runner returns to the sensor at the finish line, the sensor will automatically switch off the time calculation, and the measurement results will be shown on the LCD as seen in Figure 5.
Figure 5 Mechanical appearance of the shuttle run instrument from the outside
Meanwhile, as seen in Figure 6, the mechanical monitor appears in the circuit box attached to a PC.
Figure 6 Mechanical view of the circuit board.
The electronic circuit of the machine maker can be seen in Figure 6. The Arduino Uno, ESP8266, and LCD are all included inside the circuit board. The LCD, photodiode sensor, and ESP8266 are all powered by Arduino. The photodiode sensor reads the speed in seconds, which is programmed on Arduino. therefore The value shown on the LCD is written in seconds even if the measurement has taken a minute.
Properties of Photodiode Sensors
As exposed to light, a photodiode adjusts its resistance at the anode and cathode terminals. A method for detecting light intensity is the photodiode characteristic. The photodiode's operating theory is that as light is absorbed, the photons move and emit a pair of electron holes on the two safe sides of the electrons towards the (+) source and the holes towards the (-) source, allowing current to flow throughout the circuit.
When the photodiode is not exposed to light, the resistance value is high or can be assumed as infinite in this shuttle run instrument. Infrared light is caught by photodiodes, which are light catchers. The size of the infrared radiation determines the amount of voltage or electric current produced by the photodiode. The farther the runner's feet are from the photodiode pole, the more difficult it would be for the photodiode sensor to catch the reaction while beginning to run. Photodiode and infrared responses are also less sensitive when conditions are bright.
Accuracy of Shuttle Run
By comparing the measurement data read by the sensor with the measurement results on the normal measuring instrument, namely the stopwatch, the precision of the speed and agility measurement can be determined. Calculations may be used to measure the ratio of accuracy and error. Table 1 shows the measurement data.
| No | Student | Suttle Run (sec) | Stopwatch (Sec) | Accuracy | %Relative error |
|---|---|---|---|---|---|
| 1 | Student 1 | 11.25 | 12.43 | 0.89 | 9.5 |
| 2 | Student 2 | 13.23 | 12.54 | 0.95 | 5.5 |
| 3 | Student 3 | 10.78 | 10.48 | 0.97 | 2.9 |
| 4 | Student 4 | 10.52 | 10.72 | 0.98 | 1.9 |
| 5 | Student 5 | 14.66 | 16.71 | 0.86 | 12.3 |
| 6 | Student 6 | 11.91 | 11.39 | 0.96 | 4.7 |
| 7 | Student 7 | 11.86 | 11.70 | 0.99 | 1.4 |
| 8 | Student 8 | 11.75 | 12.46 | 0.94 | 5.7 |
| 9 | Student 9 | 10.88 | 10.80 | 1 | 0.7 |
| 10 | Student 10 | 16.39 | 15.95 | 0.98 | 2.8 |
| Average | 0.808 | 4.74 |
Data measurement fromd the sensor and the data collection using a stopwatch were taken from different individuals with different starts and finishes. Table I shows that there is a very high number of errors. From the smallest error of 0.7 percent to the highest error of 12.3 percent, with an average error of 4.74 percent. The overall accuracy is 0.808 percent (seconds).
Instrument Precision for Shuttle Run
This precision data came from a study of one of the students, in which the same student's measurements were taken ten times. Table II shows the measurement data.
Table II shows that the overall precision value is 0.995 seconds, with an average device measurement of 11.33 seconds and a stopwatch measurement of 11.25 seconds. In the meantime, the error rate is 3.24 percent. Table III displays the calculation data that were submitted to the website servers. Table III shows that a person's speed and stamina isare vary depending on his/ her age, body type, weight, gender, and degree of fatigue. For women, a strong agility rating is 16.00. whereas for men it is 17.4. The test participant was recruited from elementary school (SDN 15) 2X11 Kayutanam.
TABLE II THE PRECISION OF THE SHUTTLE RUN TIMER
| No | Shuttle Run (Sec) | Stopwatch (Sec) | Standar deviation | Precision | KR% |
|---|---|---|---|---|---|
| 1 | 10.89 | 10.37 | 0.33 | 1.04 | 4.7% |
| 2 | 10.42 | 10.82 | 1.07 | 3.8% | |
| 3 | 11.25 | 11.57 | 1 | 2.8% | |
| 4 | 13.23 | 12.8 | 0.83 | 3.2% | |
| 5 | 9.79 | 10.09 | 1.13 | 3% | |
| 6 | 10.15 | 10.59 | 1.10 | 4.3% | |
| 7 | 11.66 | 11.35 | 0.97 | 2.6% | |
| 8 | 12.37 | 11.91 | 0.90 | 3.7% | |
| 9 | 11.51 | 11.12 | 0.98 | 3.3% | |
| 10 | 12.09 | 11.96 | 0.93 | 1% | |
| Rata-rata | 11.33 | 11.25 | 0.33 | 0.995 | 3.24% |
TABLE III SHOWS THE RESULTS OF THE SPEED MEASUREMENT
| No | Student | Grade | Sex (M/F) | Speed Test |
|---|---|---|---|---|
| 1. | Student 1 | 4 | F | 11.25 |
| 2. | Student 2 | 4 | M | 13.23 |
| 3. | Student 3 | 6 | F | 10.78 |
| 4. | Student 4 | 6 | M | 10.52 |
| 5. | Student 5 | 3 | F | 14.66 |
| 6 | Student 6 | 4 | F | 11.91 |
| 7 | Student 7 | 4 | F | 11.86 |
| 8 | Student 8 | 4 | M | 11,75 |
| 9 | Student 9 | 4 | M | 10,88 |
| 10 | Student 10 | 3 | F | 16,39 |
The findings should be consistent with the research priorities based on the work completed. The requirements and output of the shuttle run tool configuration were identified by the identification role of each type of the device, and the data were stored in an Arduino-based database. Measurements and data processing also show the design's requirements. The shuttle run tool working method is as follows: When a runner crosses the first sensor as a start time and races to the second sensor, it turns, and heads to the third sensor, turns again to the fourth sensor, and turns again to the first sensor as the finish and stops.
The data will be dynamically viewed on a PC that has already been wired to Wi-Fi and will be stored directly in the database, with the calculation results in seconds in the box displayed on the LCD. Everyone can view the data contained in this archive, making it easy for testers and runners to see the calculation effects while taking pace tests and stamina to read the results.
This evaluation involves assessing the speed and stamina of a group of pupils. Measurements were taken in Padang Pariaman Regency's 2x11 Kayutanam District. Measurements were taken to see how this tool should be used in comparison to traditional measurement instruments, as well as to see if the tool's effects are appropriate for its intended use.
Because of its compact scale, this instrument is easy to transport; it merely needs enough room to cover the distance between the first and second sensors, as long aswhich is 5 meters. The fourth sensor is five meters away from the second sensor, which is two meters away from the third sensor. Sensor features, precision, and operational checking of measurement instruments are also part of the shuttle run tool configuration requirements, which are contained in an Arduino-based database.
The accuracy and precision obtained by comparing the velocity values on the sensor and the regular measuring instrument, namely the stopwatch, are the second result. The measurement tool's precision can be high or low since the measuring tool starts immediately as the runner blocks the infrared on the photodiode. Meanwhile, to time accurately, the stopwatch depends on the accuracy of the stopwatch holder as soon as the runner starts. The loss was 4.74 percent of the time, with a relative precision of 0.808 seconds. Meanwhile, the tool's overall precision value is 11.33 seconds, and the stopwatch is 11.25 seconds, meaning that the tool is close to the value of the measuring instrument while internal and external errors are considered. The instrument can be operated to make measurements with a low margin of error (Chatburn, 1996).
The benefit of this tool is that it is not overly large and can be moved to any place with enough space. The calculation reports are submitted directly to a database on the internet, which everyone may use or access it. There are some flaws in this research. That is, a cable that is too long snaps on the track, requiring the use of tape to prevent the runners from being troubled. Furthermore, the instrument still uses seconds, and eveneven though one minute has passed, the shown time will only be in seconds.
CONCLUSION
Some observations are drawn based on the findings of the tests and data interpretation, as well as on a discussion of the shuttle run tool with data stored based on an Arduino. There are two aspects of the shuttle run performance specification: mechanical design and electronic design. A photodiode and infrared sensor, a circuit board, and a PC make up the mechanical configuration. The electronic architecture involves an Arduino circuit with a photodiode, LCD, and ESP8266, as well as a shuttle run compiler circuit. Precision, accuracy, and practicality of the shuttle run tool calculation are three parts of the shuttle run tool concept specification performance. The tool's accuracy is 0.808 seconds with a 4.74 percent error presentation and 0.995 seconds with a 3.24 percent error presentation, and a favorable practical evaluation of 10.52 seconds and an unfavorable test of 16.39 seconds.
REFERENCES
- Arshi, A. R., Nabavi, H., Mehdizadeh, S., & Davids, K. (2015). An alternative approach to describing agility in sports through establishment of a relationship between velocity and radius of curvature. Journal of Sports Sciences, 33(13), 1349–1355. https://doi.org/10.1080/02640414.2014.9 90481
- Blank, M., Sylvia, B. G., Garza, J. G., & Wade, B. R. (2014). Sapper-Athlete-Warrior Program: An Integrated Approach To Periodized Warrior Fitness. Journal of Sport Psychology in Action, 5(2), 73–87. https://doi.org/10.1080/21520704.2014.8 92912
- Chatburn, R. L. (1996). Evaluation of instrument error and method agreement. Respiratory Care, 41(12), 1092–1099.
- di Fronso, S., Montesano, C., Costa, S., Santi, G., Robazza, C., & Bertollo, M. (2021). Rebooting in sport training and competitions: Athletes' perceived stress levels and the role of interoceptive awareness. Journal of Sports Sciences, 1–8. https://doi.org/10.1080/02640414.20 21.2004679
- Gabbett, T. J., & Domrow, N. (2007). Relationships between training load, injury, and fitness in sub-elite collision sport athletes. Journal of Sports Sciences, 25(13), 1507–1519. https://doi. org/10.1080/02640410701215066
- Handayani, S. G., Komaini, A., & Yohandri. (2020). Development of Coordination Test Tools. 460(Icpe 2019), 181–184. https:// doi.org/10.2991/assehr.k.200805.050
- Ihsan, N., Yulkifli, & Yohandri. (2017). Development of Speed Measurement System for Pencak Silat Kick Based on Sensor Technology. IOP Conference Series: Materials Science and Engineering, 180(1), 12171. https://doi. org/10.1088/1757-899X/180/1/012171
- Léger, L. A., Mercier, D., Gadoury, C., & Lambert, J. (1988). The multistage 20 metre shuttle run test for aerobic fitness. Journal of Sports Sciences, 6(2), 93–101. https:// doi.org/10.1080/02640418808729800
- Loland, S. (2002). Technology in sport: Three ideal-typical views and their implications. European Journal of Sport Science, 2(1), 1–11. https://doi. org/10.1080/17461390200072105
- McDonald, M., Mihara, T., & Hong, J. (2001). Japanese spectator sport industry: Cultural changes creating new opportunities. European Sport Management Quarterly, 1(1), 39–60. https://doi. org/10.1080/16184740108721886
- McGrath, R., Cuneen, J., & Tobar, D. (2017). Sport Industry Research and Analysis: An Approach to Informed Decision Making. Sport Management Review, 20(2), 240–241. https://doi.org/10.1016/j. smr.2016.06.003
- Nallaperumal, K. (2014). Engineering Research Methodology A Computer Science and Engineering and Information and Communication Technologies Perspective.
- Pate, R. R. (1983). A New Definition of Youth Fitness. The Physician and Sportsmedicine, 11(4), 77–83. https://doi.org/10.1080/009 13847.1983.11708509
- Ramsbottom, R., Brewer, J., & Williams, C. (1988). A progressive shuttle run test to estimate maximal oxygen uptake. British Journal of Sports Medicine, 22(4), 141 LP – 144. https://doi.org/10.1136/ bjsm.22.4.141
- Rasmussen, L. J. T., Østergaard, L. D., & Glăveanu, V. P. (2019). Creativity as a developmental resource in sport training activities. Sport, Education and Society, 24(5), 491–506. https://doi.org/10.1080/1 3573322.2017.1403895
- Yotter, R. A., & Wilson, D. M. (2003). A review of photodetectors for sensing light-emitting reporters in biological systems. IEEE Sensors Journal, 3(3), 288–303. https:// doi.org/10.1109/JSEN.2003.814651