
INFO ARTIKEL
Kata kunci:
Niat Konsumen, Mobile payment, SEM PLS, UTAUT
ABSTRAK
Pesatnya perkembangan teknologi dan sistem informasi telah menyebabkan munculnya berbagai inovasi, khususnya yang berkaitan dengan financial technology (fintech) dalam rangka memenuhi kebutuhan masyarakat, termasuk di bidang jasa sistem pembayaran. Indonesia memiliki beberapa pemain utama di fintech, namun transaksi nontunai melalui fintech hanya 1.66% dari perputaran uang di Indonesia. Menurut Mckinsey, penetrasi fintech di Indonesia baru mencapai 5%. Angka tersebut jauh lebih rendah daripada negara lain. Mobile payment atau disingkat M-Payment adalah sistem
pembayaran yang memanfaatkan ponsel (mobile phone) sebagai sarana pembayaran. Teknologi pembayaran seperti LinkAja, Go-Pay, OVO, dan DANA diharapkan dapat menyasar pengguna fintech di Indonesia. Akan tetapi, masih banyak penduduk Indonesia yang masih menggunakan telepon selular biasa dan belum memiliki akses terhadap internet. Data statistik menunjukkan estimasi pengguna smartphone di Indonesia baru baru mencapai 28% dari jumlah total penduduk Indonesia pada tahun ini. berdasarkan data tersebut dapat kita asumsikan bahwa sebenarnya potensi pasar untuk mobile money di Indonesia cukup besar, namun penetrasi pasarnya masih rendah. Berdasarkan latar belakang tersebut, maka dapat dilihat niat adopsi terhadap mobile payment masih sangat rendah. Adapun faktor-faktor yang berpengaruh terhadap keinginan mengadopsi teknologi adalah performance expectancy, effort expectation, social influence, perceived risk, dan perceived cost. Tujuan dari penelitian ini adalah untuk melihat bagaimana pengaruh performance expectancy, effort expectation, social influence, perceived risk, dan perceived cost terhadap niat menggunakan mobile payment di Indonesia. Penelitian ini diharapkan dapat memberikan manfaat bagi peneliti dengan topik sejenis untuk lebih mudah dalam mengembangkan studi kasus berdasarkan hasil penelitian saat ini. Riset ini menggunakan Structural Equation Model analysis (SEM PLS), dengan 400 responden.
https://doi.org/10.5614/sostek.itbj.2022.21.1.2
Introduction
Technological innovation has a huge impact on today's life, and it cannot be denied that it brings about tangible benefits to all of us. For example, cell phones that were previously used to make phone calls and send text messages have now been transformed into internet-based smart phones which can be used for shopping, ordering food, ordering public transportation, ordering massage artisans and even paying for it all at once.
Bank Indonesia Regulation No.18/40/PBI/2016 states that the immense growth of technology and information systems have led to the birth of innumerable innovations in financial technology (fintech) to fulfil the needs of the society. This includes payment system services, i.e., instruments payment transaction processing operators, mechanisms, and infrastructure (www.bi.go.id). Financial technology (fintech) industry is one of the financial services that has been continuously gaining popularity in today's digital era. Technology-based payment systems are deemed one of the most developed sectors in the fintech industry in Indonesia. The government and society have put high expectation in this sector to encourage more people to have access to financial services (Sukma, 2016).
Payment Clearing and Settlement is one of the Fintech industries that is widely used by residents in Indonesia today. This type of fintech is engaged in the payment sector, whether organized by regular banks or by Bank Indonesia. The existence of this fintech can clearly make it easier for users to make payment transactions that are practical, fast, safe, and comfortable. Fintech e-wallet services such as GoPay, OVO, and T-Cash allow users to save money in the application to be used for transactions whenever it is needed. Using e-wallets is easy hence users do not have to use cash payment instruments and dealing with changes.
Mobile payment is a payment method using a mobile phone or cell phone as the facility (dictio.id). Payment penetration using Mobile payment in Indonesia has almost reached 30%, being in the fourth position for digital payments after ATM transfers, debit cards, and internet banking. In line with this, Mckinsey, states that fintech penetration in Indonesia has only reached 5%. This figure is much lower than that of other countries such as China which is in the first rank with a percentage of 67%. Mckinsey said the fintech penetration rate could continue to grow, even reaching 15 percent or it could compete with Australia which had already touched 17%, especially with the existence of payment applications such as Gopay and OVO (republika.co.id). From this data it can be said that the public awareness of using digital payments is still very small, and shows that the Indonesian people still do not understand much about fintech services that are widely available and can therefore be used to make it easier for them to make transactions using only mobile phones (Mobile payment). This knowledge will affect people's attitudes and perceptions of mobile payments, and this phenomenon is a challenge for fintech industry owners to increase market penetration of the use of mobile payments in Indonesia.
To meet these challenges, it can be seen from how consumers intend to adopt services Mobile payment with a model that explains user behavior towards information technology called UTAUT (Unified Theory of Acceptance and Use of Technology). In this model, there are four variables that significantly affect users' acceptance and usage behavior, i.e., performance expectancy, effort expectancy, social influence, and facilitating conditions (Venkatesh et al. 2003; Zhou Lu and Wang, 2010; Parameswaran Kishore and Li, 2015). The behaviors of consumers and factors determining the their intention to adopt technology are performance expectancy, effort expectation, social influence, perceived risk, and perceived cost. (Abrahão et al. 2016).
Performance Expectancy is the extent to which someone believes that using Mobile payment such as GoPay, OVO, Link Aja and Dana will provide positive benefits and impacts in its use. Effort Expectancy describes the level of convenience associated with the use of the system. It stems from three existing model constructs: perceived ease of use (TAM/TAM2), complexity (MPCU), and ease of use (IDT) (Abrahão et al. 2016). The extent to which members of social networks, such as family and friends influence each other's behavior in using Mobile payment is understood as social influence. Perceived risk is a technology user concern about the uncertainty that may occur because of using Mobile payment. Perceived cost is how to consider the time and needs of consumers by using Mobile payment.
Based on the above background, the researcher is interested in observing user interest with the title "The Effect of Performance Expectation, Effort Expectancy, Social Influence, Perceived Risk, and Perceived Cost on Intention of Using Mobile payment in Indonesia". This research has the following research objectives:
- 1. How are Performance Expectation, Effort Expectancy, Social Influence, Perceived Risk, Perceived Cost, and behavioral intention of mobile payments in Indonesia?
- 2. Is there an influence of Performance Expectation, Effort Expectancy, Social Influence, Perceived Risk, Perceived Cost on Interest in Using Mobile payment in Indonesia?
Venkatesh et al. (2003) integrated eight theories regarding technology acceptance, namely Theory of Reasoned Action (TRA), Technology Acceptance Model (TAM), Motivational Model (MM), Theory of Planned Behavior (TPB), Combined TAM and TPB, Model of PC Utilization (MPTU), Innovation Diffusion Theory (IDT), and Social Cognitive Theory (SCT), all called as UTAUT. Based on research conducted by Venkantesh et al. (2003), the new model provides an important managerial tool for the evaluation and construction of strategies in introducing new technologies. In UTAUT, the purpose of using information technology can be determined by three points, namely performance expected, effort expectancy, and social influence.
In the research of Abrahao et al. (2016), overall, the variable performance expectancy; effort expectancy; Social influence and perceived risk, explain 76.2% (R2) of the variant intention to adopt cellular payments. After the elimination of the perceived cost from the performance expectancy model, it is shown that there is a positive relationship with the intention to adopt mobile payments. Perceived risk has a negative relationship, namely, the higher the perceived risk, the lower the intention to adopt a new product. This finding is in line with the result of the research that shows the two main variables determining the intention to adopt and use technology (Martins et al., 2014; Zhou, Lu, & Wang, 2010).
Perceived risk is present, but without major emphasis. It is different from the security provided by traditional payment methods, such as credit and debit cards. As for effort expectancy (EE), the results also show a positive relationship with behavioral intention (BI) in this study. The same effect is also evident in previous studies conducted by Chong (2013), Barbosa and Zilber (2013), Oye et al. (2014) and Martins et al. (2014), where it is considered one of the most significant determinants of intention to adopt technology. It is however different from the work of Gouveia and Coelho (2007), whose research
results show this variable as a relevant factor. The analysis on social influence factors (SI) has proven to be relevant and shows a positive relationship with behavioral intention (BI). It is line with the studies by Gouveia and Coelho (2007), Oye et al. (2014), and Martins et al., (2014)
Based on the results of these studies, a hypothesis is proposed that the dimensions of performance expectation, effort expectation, social influence, perceived risk, and perceived cost have a significant positive effect on the intention to adopt payments through mobile payments.
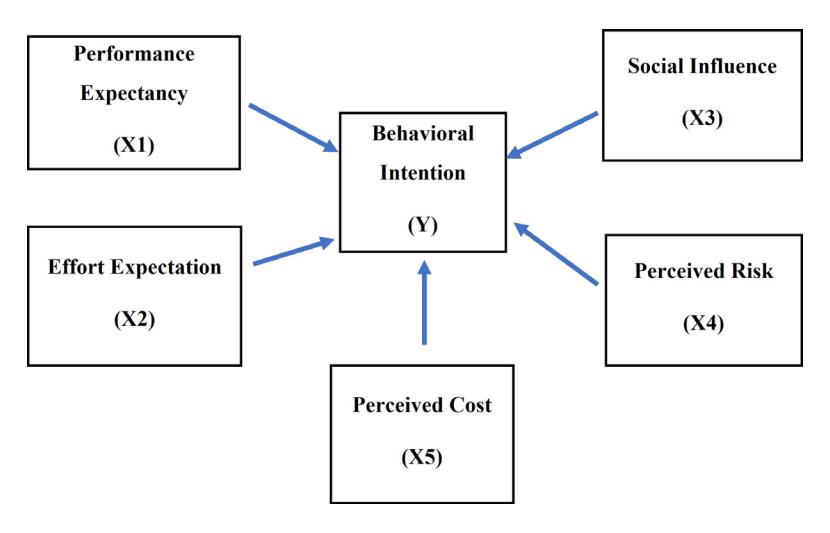
Figure 1 Framework
Literature Review
- a. Performance expectancy is described as an individual's belief that using the system can help them complete their work and improve their performance. Meanwhile, Venkatesh et al. (2003) defines performance expectation as the level at which an individual believes that using the system will help them improve their performance.
- b. Effort expectancy can be said as follows. Each individual will believe that where there is easiness in using a system that can save energy and time, and there will be interest too in doing their work. According to the theory, effort expectancy is the level of easiness of using the system that might decrease the effort of individual energy and time in performing their work.
- c. Social influence is defined as the degree to which an individual feels that other people convince them that they should use the new system (Venkatesh et al., 2003).
- d. Hsu and Chiu in Lusiana (2015) define perceived risk as the perceived risk of uncertainty and the consequences that one will face after carrying out certain activities. Perceived risk includes an evaluation of the negative possibility that will occur. Perceived risk leads to beliefs about advantages and disadvantages beyond consideration of purchase intentions (Mayer et al, cited in Lusiana, 2015). Perceived risk according to Schierz et al., (2010) is an expectation of loss. Higher expectations owned by consumers will make the level of risk felt by consumer also high.
- e. Perceived cost is a collection of perceived costs that customers will incur to obtain goods and services.
- f. Dharmmesta (2008) defines behavioral intention as a behavior or attitude of consumers who have a desire to use service continuously. Behavioral intention, according to Saha and Theingi (2009), is defined as the possibility of customers to perform a certain behavior, such as positive word of mouth about a service provider to others, repurchase intentions and loyalty to service providers. Saha and Theingi (2009)
Method
This study was conducted to determine the intention, use and adoption behavior of electronic money services in Indonesia by using a modification of The Unified Theory of Acceptance and Use of Technology (UTAUT), based on previous research conducted by Venkatesh, et al., (2003).
In this study, researchers used quantitative methods with descriptive research types with causal relationships. Quantitative methods can be defined as research methods that try to make accurate measurements of behavior, knowledge, opinions, or attitudes. Quantitative methods are widely used in various studies because of their suitability to test models or hypotheses (Indrawati, 2015). The causal method is conducted if the researcher wants to describe the causes of a problem (either carried out through experiments or non-experiments) Indrawati (2015)
Based on the involvement of researchers, this study did not interfere with the data, because in this case the researcher did not manipulate or intervene with the data (Indrawati, 2015). Looking at the data collected from each individual and making the response of each individual as a source of individual data (Sekaran, 2006), the unit of analysis is an individual, namely a person who knows or has used Mobile payment.
Population, namely all people, events, objects that attract researchers to study (Indrawati, 2015). In this study, the population used was an unknown number of users using Mobile payment. If the population is large, it is impossible for the researcher to study everything in the population. Then the researcher used a sample taken from that population. The researcher determined the sample using the following criteria:
- 1. Knowing about Mobile payment.
- 2. Make a payment using Mobile payment more than once.
Operational Variable
Sugiyono (2018), states that variables are essential in any form determined by the researcher to study so that information is obtained about it, and conclusions drawn. There are three research variables used in this study, including:
- a. Independent variable (X), which is the variable that affects or causes the change or the emergence of the dependent variable (Sugiyono, 2018). The independent variables referred to in this study are performance expectation (X1), effort expectancy (X2), social influence (X3), perceived risk (X4), and perceived cost (X5).
- b. Dependent Variable (Y). according to Sugiyono (2018) the dependent variable is a variable that is influenced or becomes a result because of the independent variable. The dependent variable referred to in this study is the intention to adopt (Y).
Table I Operational Variables
| Variables | Indicator | Number |
|---|---|---|
| Performance expectation (X1) | I am sure that mobile payment will be a useful service on the Internet for my daily activities. | 1 |
| Performance expectation is the extent to which an individual believes that using the system will help the individual to achieve an advantage in his or her | Using a mobile payment will make my financial transactions faster | 2 |
| job performance (Venkatesh, V, et al, 2003) | Using a mobile payment will save time so I can do other activities | 3 |
| Mobile payment will make me more comfortable | 4 |
| Variables | Indicator | Number | ||||
|---|---|---|---|---|---|---|
| My interaction with the mobile payment service will be clear and easy to understand | 5 | |||||
| Effort expectation (X2) Effort Expectancy is defined as the level of ease in | It would be easy for me to develop skills to use mobile payment services. | 6 | ||||
| using the system. (Venkatesh, V, et al, 2003) | I believe that mobile payment is easy to use | 7 | ||||
| Learning to use the mobile payment system will be easy for me. | 8 | |||||
| Social Influence (X3) | People who influence my behavior will think I should use mobile payment | 9 | ||||
| Social Influence is defined as the extent to which an individual views that the importance of the existence | People who are important to me will think that I should use mobile payment | 10 | ||||
| of others in using the new system will influence the individual in using the new system as well | People who are important to me can help me in using mobile payments | 11 | ||||
| (Venkatesh, V, et al, 2003) | In the future, organizations that offer mobile payment services will ensure that they function properly | 12 | ||||
| Perceived Risk (X4) | I wouldn't feel completely safe by giving out personal information via a mobile payment system | 13 | ||||
| Perceived Risk is defined as the degree to which consumers of cellular services believe that they may be exposed to certain types of financial, social, | I am worried about the use of the mobile payment service in the future, because other people may be able to access my data | 14 | ||||
| psychological, physical, or time risk (Zhang et al. 2012) | I don't feel protected when sending confidential information via mobile payment | 15 | ||||
| The likelihood that something will go wrong with the mobile payment system is high | 16 | |||||
| I believe the mobile payment service will be very expensive. | 17 | |||||
| Perceived Cost (X5) Perceived costs refer to the initial costs, subscription | I will have financial barriers (e.g., mobile phone purchase and communication time fees) to use the mobile payment service. | 18 | ||||
| fees, transactions, and communications that consumers believe they will be able to collect in the future (Shafinah et al., 2013) | I believe I have to do a lot of effort to get the information that will make me feel comfortable about adopting mobile payment. | 19 | ||||
| It took time to go through the process of moving to a new means of payment. | 20 | |||||
| Behavioral Intention (Y) | If I have access to the mobile payment service, I want to have it | 21 | ||||
| Behavioral intention refers to the effective intentions | I will actually use the mobile payment service | |||||
| used by consumers for future products or services (Venkatesh et al., 2003) | I thought it would be a waste for me to adopt mobile payment | 23 | ||||
| The likelihood that something will go wrong with the mobile payment system is high | 24 | |||||
Source: Processed Data, 2019
Structural Equation Modeling (SEM)
In the current research, the author uses the PLS-SEM type because according to Tenanhaus et al. cited in Abdilah et al. (2015). PLS is a reliable tool for testing various assumptions and can be used to predict models that have weak theoretical foundations; it can also be used on data that experience classical assumptions which can be used for small sample sizes, and can be used for formative and reflective constructs.
PLS is a type of structural equation analysis (SEM) that may evaluate both the measurement and structural models at the same time. Validity and reliability are tested using the measurement model, whereas causality is tested using the structural model, i.e., hypothesis testing with predictive models.
Results and Discussion
In accordance with the observations that researchers have made, the following sampling procedures in this study are shown in Table II below:
Table II Sampling Procedure
| Information | Number | 0/0 |
|---|---|---|
| Number of questionnaires distributed | 400 | 100 |
| Number of questionnaires that were not returned | 0 | 0.00 |
| Number of damaged questionnaires | 0 | 0.00 |
| Number of questionnaires processed | 400 | 400 |
Source: Observation of Questionnaire 2019
Descriptive Analysis
The purpose of descriptive analysis is to identify the description of 400 respondents on the variables of performance expectation, effort expectancy, social influence, perceived risk, and perceived cost on behavioral intention to use Mobile payment, which is comprised of 24 statements.
Table III Responses to the Performance Expectancy variable
| • | • | |||||||||
|---|---|---|---|---|---|---|---|---|---|---|
| No | Statement | Strongly Disagree | Disagree | Undecided | Agree | Strongly Agree | Total Score | At 0% | Ideal Score | Result |
| 1 | Mobile payment will be a useful service in my daily activities | 2 | 24 | 156 | 884 | 565 | 1631 | 81.55% | 2000 | Good |
| 2 | Using Mobile payment will make my financial transactions faster | 2 | 2 | 204 | 700 | 770 | 1678 | 83.9% | 2000 | Good |
| 3 | Using Mobile payment will save time so I can do other activities | 0 | 16 | 129 | 812 | 730 | 1687 | 84.35% | 2000 | Very Good |
| 4 | Mobile payment provides more comfortable | 8 | 40 | 252 | 616 | 670 | 1586 | 79.3% | 2000 | Good |
| Total | · | · | 6579 | 82.27% | 8000 | Good |
Source: Result of Data Processing, 2019
Based on Table III, it can be explained that the survey conducted on the respondents gives an overview of the responses to the performance expectancy variable getting an average total score of 6579 or 82.27% and is classified into the good category.
In this study, two other variables also have processing results that are included in the good category, namely the Effort Expectancy and Social Influence variables. The results of processing these variables can be seen on the Table IV:
Table IV Responses to the Effort Expectancy Variable
| No | Statement | Strongly Disagree | Disagree | Undecided | Agree | Strongly Agree | Total Score | At 0% | Ideal Score | Result |
|---|---|---|---|---|---|---|---|---|---|---|
| 1 | Interaction with Mobile payment services is clear and easy to understand | 0 | 34 | 351 | 568 | 620 | 1573 | 78.65% | 2000 | Good |
| 2 | Can use and develop skills to use the Mobile payment service | 0 | 96 | 369 | 504 | 515 | 1484 | 74.2% | 2000 | Good |
| 3 | Believe that Mobile payment is easy to use | 1 | 40 | 234 | 604 | 750 | 1629 | 81.45% | 2000 | Good |
| 4 | Using a mobile system payment Mobile payment is easy to learn | 3 | 18 | 264 | 852 | 435 | 1572 | 78.6% | 2000 | Good |
| _ | Total | 6258 | 78.22% | 8000 | Good |
Source: Result of Data Processing, 2019
Table V Responses to the Social Influence Variable
| No | Statement | Strongly Disagree | Disagree | Undecided | Agree | Strongly Agree | Total Score | At 0% | Ideal Score | Result |
|---|---|---|---|---|---|---|---|---|---|---|
| 1 | People who influence my behavior (friends and family) think I should using Mobile payment | 16 | 104 | 315 | 592 | 395 | 1422 | 71.1% | 2000 | Good |
| 2 | People who are important to me (friends, family) think I should use go-pay | 17 | 110 | 372 | 468 | 435 | 1402 | 70.1% | 2000 | Good |
| 3 | People important to me (friends, family) can help me in using Mobile payment | 9 | 142 | 270 | 464 | 570 | 1455 | 72.75% | 2000 | Good |
| 4 | In the future, Mobile payment will guarantee its proper function | 12 | 110 | 198 | 556 | 640 | 1516 | 75.8% | 2000 | Good |
| Total | 5795 | 72.43% | 8000 | Good |
Source: Result of Data Processing, 2019
Meanwhile, the results of processing the Perceived Risk variable fall into the Fair category with detailed results as shown in the table below:
Table VI Responses to the Perceived Risk Variables
| No | Statement | Strongly Disagree | Disagree | Undecided | Agree | Strongly Agree | Total Score | At 0% | Ideal Score | Result |
|---|---|---|---|---|---|---|---|---|---|---|
| 1 | I really feel unsafe providing personal information via Mobile payment | 43 | 150 | 303 | 464 | 325 | 1285 | 64.25% | 2000 | Fair |
| 2 | I am worried about using the Mobile payment service in the future, because other people might be able to access my data | 17 | 124 | 351 | 476 | 425 | 1393 | 69.65% | 2000 | Good |
| 3 | I don't feel protected when sending confidential information via cell phone to Mobile payment | 26 | 156 | 399 | 416 | 295 | 1292 | 64.6% | 2000 | Fair |
| 4 | I feel like something will go wrong with Mobile payment | 17 | 134 | 528 | 344 | 270 | 1293 | 64.65% | 2000 | Fair |
| Total | 5263 | 65.78% | 8000 | Fair |
Source: Result of Data Processing, 2019
The same results also apply to the perceived cost variable which is included in the Satisfactory category with the details of the results as shown in Table VII below:
Table VII Responses to the Perceived Cost Variables
| No | Statement | Strongly Disagree | Disagree | Undecided | Agree | Strongly Agree | Total Score | At 0% | Ideal Score | Result |
|---|---|---|---|---|---|---|---|---|---|---|
| 1 | I believe the mobile payment service Mobile ayment will be very expensive | 60 | 142 | 324 | 496 | 185 | 1207 | 60.35% | 2000 | Satisfactory |
| 2 | I will have financial barriers (eg purchase of mobile phones and communication time costs) to use the service | 68 | 136 | 375 | 376 | 225 | 1180 | 59% | 2000 | Satisfactory |
| 4929 | 61.61% | 8000 | Satisfactory | |||||||
|---|---|---|---|---|---|---|---|---|---|---|
| 4 | It takes time and process to move to a new means of payment | 45 | 138 | 390 | 416 | 260 | 1249 | 62.45% | 2000 | Satisfactory |
| 3 | I believe I have to put a lot of effort into getting information that will make me feel comfortable using Mobile payment | 41 | 80 | 459 | 468 | 245 | 1293 | 64.65% | 2000 | Satisfactory |
Source: Result of Data Processing, 2019
The Behavioral Intention variable also shows satisfactory results, as well as the Perceived Risk variable. This is influenced by the number of respondents who state "it would be futile to adopt Mobile payment" in questions about the respondent's behavioral intention. Descriptions of all respondents' answers can be explained according to the table below:
Table VIII Responses to the Behavioral Intention Variables
| I | - to the ben | |||||||||
|---|---|---|---|---|---|---|---|---|---|---|
| No | Statement | Strongly Disagree | Disagree | Undecided | Agree | Strongly Agree | Total Score | At 0% | Ideal Score | Result |
| 1 | If I have access to services, I will have an interest use it | 2 | 60 | 285 | 904 | 235 | 1486 | 74.3% | 2000 | Good |
| 2 | I will actually use the Mobile payment service | 5 | 72 | 321 | 664 | 430 | 1492 | 74.6% | 2000 | Good |
| 3 | I think it will be a waste for me to adopt Mobile payment | 41 | 130 | 130 | 508 | 345 | 1318 | 65.9% | 2000 | Fair |
| 4 | Probabilities in having troubles when the usage system is high | 12 | 132 | 132 | 544 | 400 | 1406 | 70.3% | 2000 | Good |
| Total | 5702 | 71.2% | 8000 | Fair |
Source: Result of Data Processing, 2019
Descriptive Research Result
a. Performance Expectancy
Based on the results of the descriptive analysis, the performance expectancy variable falls into either category with a total score of 6579 or 82.27%. Of all the statements of the performance expectancy variable, the one that has the lowest value is "payment using Mobile payment gives me convenience in transacting". This proves that there are still respondents who feel uncomfortable making payment transactions using Mobile payment as is stated by Annisa on kompas.com (2018) that payment using Mobile payment should have been easier, but some customers are not comfortable using Mobile payment. The reason is that they are not yet accustomed to it hence using cash as payments gives them more comfort than using Mobile payment.
b. Effort Expectancy
Based on the results of the descriptive analysis, the overall effort expectancy variable falls into either category with a total score of 6258 or 78.22%. Of all the statements of the effort expectancy variable, the one that has the lowest value is "it's easy for me to develop skills using Mobile payment (such as: knowing all its features)". This proves that there are still respondents who do not know the features in Mobile payment such as there is an OTP code (account verification) feature via SMS that cannot be shared with anyone due to Mobile payment balance security, and currently there are rampant frauds asking for the OTP code for Mobile payment balance theft due to the lack of consumer knowledge about the OTP code (kompas.com, 2019).
c. Social Influence
Based on the results of the descriptive analysis, the social influence variable falls into the good category with a total score of 6258 or 72.43%. Of all the statements of the social influence variable, the one with the lowest score is "my closest people think I should use Mobile payment". This proves that there are still respondents who think that their closest people do not think they should not use Go-pay. This is in line with the ingrained individual mindset of urban people, and it is even difficult to change this behavior so that individualism causes indifference to others (kompasiana.com, 2017).
d. Perceived Risk
Based on the results of the descriptive analysis, the overall perceived risk variable falls into the Fairly Good category with a total score of 5263 or 65.78%. This proves that there is still fear of mobile payments among users about the risks that they have to face, such as the alleged mode of fraud and balance theft (cnnindonesia, 2019).
e. Perceived Cost
Based on the results of the descriptive analysis, the overall perceived cost variable falls into the Fairly Good category with a total score of 4929 or 61.61%. This proves the complaints raised by a number of mobile payments users on Twitter about high Mobile payment rates (kumparan.com, 2018).
f. Behavioral Intention
Based on the results of the descriptive analysis, the overall behavioral intention variable falls into either category with a total score of 5702 or 71.27%. Of all the behavioral intention variable statements, the one with the lowest score was "I thought it would be useless for me to adopt Mobile payment". This proves that the majority of Indonesians still prefer cash as a payment method. However, the percentage comparison is getting thinner with non-cash payment alternatives (kompas.com, 2019).
Conclusion
Based on the results of the data analysis that has been carried out, the following conclusions can be drawn:
- 1. Based on the results of descriptive analysis, overall performance expectancy, effort expectancy, social influence and behavioral intention are in the good category. Meanwhile, the perceived risk and perceived cost are in quite good category.
- 2. The variable performance expectancy has a significant influence on behavioral intention on mobile payments.
- 3. The effort expectancy variable has a significant effect on the behavioral intention variable on mobile payments.
- 4. Social influence variable has a significant influence on behavioral intention on mobile payments.
- 5. Perceived risk variable has a significant influence on behavioral intention on mobile payments.
- 6. Perceived cost variable has a significant influence on behavioral intention on mobile payments. Based on the above conclusions, the authors can provide suggestions or input as follows:
- a. Increase promotion of the benefits and use of mobile payments so that all levels of society can use this service properly.
- b. Companies must be able to provide certainty of financial, social, psychological, physical, or time security in order to increase confidence.
- c. Always improve the quality of access and ease of application services frequency of consumers increasingly using the application.
References
- Abdillah, W. & J. Hartono. (2015). Partial Least Square (PLS): Alternatif Structural Equation Modeling (SEM) Dalam Penelitian Bisnis. Yogyakarta: Andi.
- Abrahao, R., Moriguchi, S., & Andrade, D. (2016). Intention of Adoption of mobile payments: An Analysis in the Light of the Unified Theory of Acceptance and Use of Technology (UTAUT). IMR. RAI 21, 1-10.
- Barbosa, R. C. O., & Zilber, M. A. (2013). As características competitivas que impactam a adoção de inovação: um estudo sobre sistemas de pagamentos móveis. RAI Revista de Administração e Inovação, 10(3), 89-114.
- BI. (2018). Peraturan Bank Indonesia No. 18/40/PBI/2016 tentang Penyelenggaraan Pemrosesan Transaksi Pembayaran. Retrivied April 2019, from http://bi.go.id
- Chong, A.Y.L. (2013). Understanding mobile commerce continuance intentions: An empirical analysis of Chinese consumers.
- Dharmmesta. 2008. Manajemen Pemasaran, Analisis Perilaku Konsumen, Edisi pertama. BPFE-Yogyakarta. Yogyakarta.
- Indrawati. (2015). Metode Penelitian Manajemen dan Bisnis Konvergensi Teknologi Komunikasi dan Informasi. (Cetakan 1). Bandung PT. Refika Aditama
- Indrawati. (2017). Perilaku Konsumen Individu dalam Mengadopsi Layanan Berbasis Teknologi Informasi dan Komunikasi. Bandung: Refika Aditama
- Kotler, P., & Keller, K. L. (2016). Marketing Management, 15th Edition, Pearson Education, Inc
- Lusiana, L. (2015). Anteseden Keputusan Pembelian Online Di Indonesia. Jurnal Sains Pemasaran Indonesia (Indonesian Journal of Marketing Science), vol. 14, no. 2, pp. 158 – 183
- Martins, C; Oliveira, T., & Popovic, A. (2014) Understanding the Internet banking adoption: A unified theory of acceptance and use of technology and perceived risk application. International Journal of Information Management 34(1):1-13
- Natakusumah, F.A. (2015). Pengaruh Bauran Pemasaran terhadap Keputusan Pembelian (Studi pada Ina Cookies Bandung). Skripsi pada Universitas Telkom. Bandung.
- Oye, N. D., Lahad, N., Rahim, N. Z. (2014). The history of UTAUT model and its impact on ICT acceptance and usage by academicians. Education and Information Technologies 19(1):251-270
- Parameswaran, S., Kishore, R., & Li, P. (2015). Within-study Measurement Invariance of the UTAUT Instrument: An Assessment with User Technology Engagement Variables. Information & Management.
- Petrova, K. & Wang, B. 2013. Retailer Adoption of mobile payments, journal of Electronic Commerce in Organizations,11(4),70-89. Priambada, A. (2016). Evaluasi Sebulan Penerapan Go-Pay. Retrivied April 2019, from dailysocial.id
- Pryanka, A. & Zuraya, N. (2019). McKinsey: Penetrasi Fintech di Indonesia Baru LimaPersen. Retrivied April 2019, from http://republika.co.id
- Rosiana, G. (2018). Booming Fintech, Ini Segmen yang Akan Berkembang. Retrivied April 2019, from http// cnbcindonesia.com
- Saha G. C, & Theingi, H. (2009). Service quality, satisfaction, and behavioural intentions: a study of lowcost airline carriers in Tailand.
- Schierz, P. G., Schilke, O., & Wirtz, B. W. (2010). Understanding consumer acceptance of mobile payment services: An empirical analysis. Electronic commerce research and applications, 9(3), 209-216.
- Sekaran, Uma. 2006. Metodologi Penelitian Untuk Bisnis. Jilid 1 dan 2, Edisi 4. Jakarta: Salemba Empat.
- Setyowati, D. (2018). Transaksi Non Tunai Bank Dominasi E-Commerce, Lewat FinTech Baru 1,7%. Retrivied April 2019, from http://katadata.co.id
- Shafinah, K., Sahari, N., Sulaiman, R., Yusoff, M., & Ikram, M. (2013). Determinants of User Behavior Intention (BI) on Mobile Services: A Preliminary View. Procedia Technology. 11, 127-133.
- Social Influences, and Personal Traits. Computers in Human Behavior 28, 129-142.
- Solomon, Michael. R. (2015). Consumer Behavior: Buying, Having and Being, 11th Edition. New Jersey: Prentice-Hall.
- Sugiyono. (2018). Metode Penelitian Kuantitatif. Bandung: Alfabeta
- Sukma, D. (2016). Fintechfest, mempopulerkan teknologi finansial di Indonesia. Retrieved April 2019, from https://arenalte.com
- Taiwo, A. A. & Downe. A.G., 2013. The theory of user acceptance and use of technology (UTAUT): A metanalytic review of empirical findings.
- Teknologi Dompet Elektronik Go-Pay. Jurnal Siasat Bisnis Vol.21 No.1.88-160 (2019).
- Mudahnya Transaksi Dengan GO-PAY Gojek, Begini Ulasannya.Retrieved April,2019, from https:// finansialku.com
- Venkatesh, V., Morris, M. G., Davis, G. B., & Davis, F. D. (2003). User Acceptance of Information Technology: Toward a Unified View. MIS Quarterly. 27(3), 425-478.
- Yang, S., Lu, Y., Gupta, S., Cao, Y., & Zhang, R. (2012). Mobile payment Services Adoption Across Time: An Empirical Study of the Effects of Behavioral Beliefs,
- Zhang, L., Zhu, J., & Liu, Q. (2012). A Meta-analysis of Mobile Commerce Adoption and the Moderating Effect of Culture. Computers in Human Behavior. 28, 1902-1911.
- Zhou, T., Lu, Y., & Wang, B. (2010). Integrating TTF and UTAUT to explain mobile banking user adoption. Computers in Human Behavior, 26, 760– 767. doi: 10.1016/j.chb.2010.01.013