
INFO ARTIKEL
Kata kunci:
keberlanjutan sosial, SEM-PLS, kinerja perusahaan, dampak ekonomi Covid-19, resiliensi
ABSTRAK
Penelitian ini menguji secara empiris bagaimana budaya organisasi dan kepemimpinan demokratis memengaruhi loyalitas karyawan pada Usaha Kecil dan Menengah (UKM) studio musik. Metode yang digunakan yaitu metode kuantitatif dengan pendekatan deskriptif kausal. Sampel penelitian diambil dari populasi karyawan pada UKM studio musik di Bandung. Teknik analisis data yang digunakan analisis deskriptif dan regresi berganda . Penelitian ini memiliki batasan pada sampel yang digunakan dan pengumpulan data yang terbatas pada UKM. Hasil penelitian ini mengindikasikan
bahwa budaya klan dan kepemimpinan demokratis secara positif dan signifikan memengaruhi loyalitas karyawan secara parsial dan simultan. Hubungan antarbudaya klan dan kepemimpinan demokratis terhadap loyalitas karyawan menunjukkan angka hubungan 70 persen, sementara 30 persennya dipengaruhi oleh faktor lain.
https://doi.org/10.5614/sostek.itbj.2022.21.3.11
Introduction
The impact of COVID-19 pandemic that has hit the world has also had a serious economic impact on the Indonesian business world. Businesses are required to continue to be able to provide products with many variants but in small volumes (due to decreased demand). As a result, some of the weakest suppliers experience problems managing production, cost management, employee, productivity, and delivery. The same thing happened in the object of this research, a two-wheeled automotive supply chain that experienced a 50% decrease in demand. There was an increase in supplier terminations from 1 supplier in 2019 to 5 suppliers in 2021 (increase of 500%). Doing so can harm their businesses as a whole, especially if the supplier relies on special processes and materials that are not available from the replacement supplier. Based on the supplier rating categories namely: (1) Financial Stability, (2) Management Commitment, (3) Loyalty, (4) Quality, (5) Delivery and (6) Capability, it is concluded that the root cause of the supplier termination problem is the lack of management commitment and financial support. Zorzini et al., (2015) stated that measuring the correlation of management commitment and financial support together on work situation, work comfort and employee social rights will have a positive impact on employee morale and productivity. Strengthened by Alqudah et al., (2022) who stated that management's expertise in implementing Human Resource Management strategies that place employees as long-term investments can make employees inbound with the company and have an obligation to pay back to the company in the form of dedication and performance improvement. Govindan et al., (2021) state that the management of social sustainability in upstream suppliers needs to be expanded, especially in developing countries. According to Venkatesh Mani et al., (2018a) the implementation of social sustainability has a direct positive effect on supply chain performance, supplier performance and operational performance. Added to this is research Yuan & Woodman, (2010) proves that the adoption of social sustainability in the supply chain contributes to increasing competitive advantage throughout the supply chain and also increases market share by improving the work environment, employee comfort, and company performances.
Most researchers evaluate the company's performance based on the factors of efficiency, profitability, and financial ratios (Tan & Wang, 2010). Social sustainability has not gained as much attention as environmental and economic sustainability (Yawar & Seuring, 2017). The same condition also occurs in implementation, where most managers give both more priority than social sustainability (Kusi-Sarpong et al., 2019). This is because most managers frame social sustainability as a one-dimensional disruption involving regulations, additional costs, and obligations (Shen et al., 2015). Whereas, according to Marshall et al. (2015), the success of social sustainability is as important as environmental and economic sustainability, and most advanced companies consider these three aspects. Govindan et al., (2021) suggest further research to better understand problems that arise in emerging economies and multi-tiered supply chains. Understanding them would help business practitioners design a socially sustainable supply chain (Abbasi, 2017).
Over the years, social sustainability and a sustainable circular supply chain have attracted the attention of researchers and practitioners (Savitz, 2014). Environmental, social, and economic dimensions are three important pillars of supply chain sustainability (Govindan et al., 2020). The successful integration of economic, environmental, and social sustainability goals has been at the forefront of leading supply chain and operations management (Fahimnia et al., 2015). Adoption of social sustainability in the supply chain contributes to increasing competitive advantage throughout the supply chain (Yuan & Woodman, 2010).
Improve operational performance (Venkatesh Mani et al., 2020). The labor category is the main focus in implementing social sustainability (Bubicz et al., 2019). Therefore, it is so fundamental for companies to measure how the three pillars of sustainability impact company performance (Margolis et al., 2012). In contrast to other dimensions, researchers state that social sustainability contains some subjective factors. There is no consensus on which criteria and perspectives can be adopted to define social sustainability (Landorf, 2011). Many researchers use different indicators according to their research objectives, including those put forward by the Global Reporting Initiative and the United Nations Commission on Sustainable Development. Unlike in the world, where research on social sustainability is numerous, reaching thousands per year, research like this is very rare in Indonesia. Researchers in Indonesia are still focusing on economic sustainability (efficiency, cost reduction, capacity expansion, optimalization, and etc.), and environmental sustainability.
To obtain a pattern for successful implementing social sustainability, this research aims at companies that have managed to survive during the pandemic. The question that arises is: what indicators are appropriate in this study and how to determine the effect of management commitment and financial support on company performance, either directly or through social sustainability mediation? Therefore, this research is important to examine the effect of implementing social sustainability on company resilience during the pandemic, and to get patterns and strategies for human resource m management to employees in Indonesia, especially on the manufacturing side. This study uses a variance-based Structural Equation Modelling technique (SEM-Partial Least Square) which has the advantage of being able to model many variables (complex models) in accordance with this study to test and estimate the causal relationship between constructs from a predictive model.
Method
This quantitative research is confirmatory to test the hypothesis of the relationship between the research variables described in the model below:
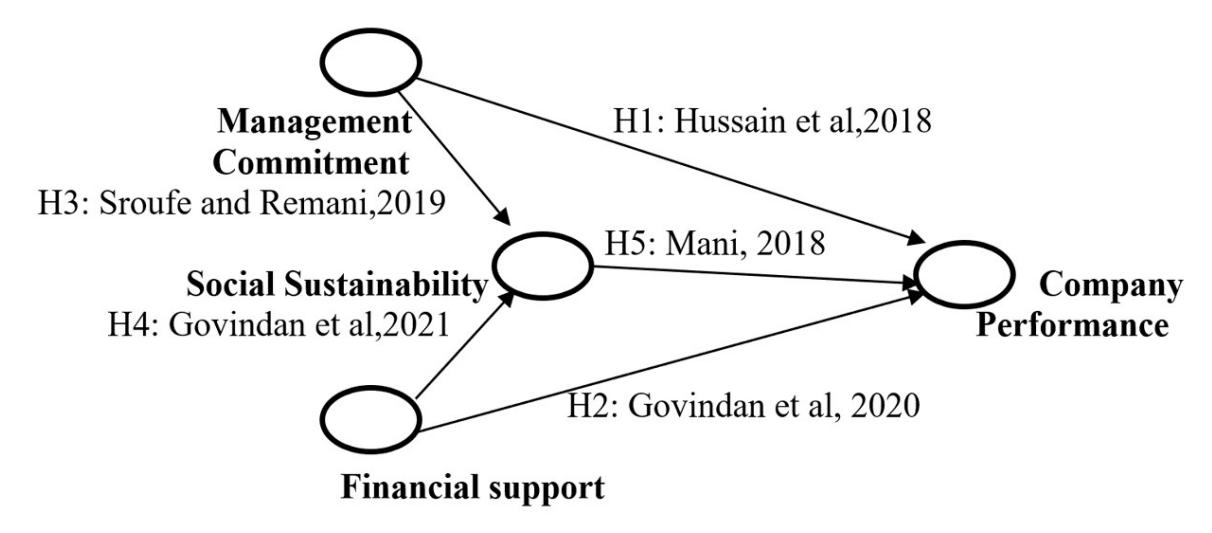
Figure 1 Hypothetical Model
Where the associative hypothesis that is built are:
- H1: Management commitment has a positive effect on Company Performance (Hussain et al., 2018).
- H2: Financial Support has a positive effect on Company Performance (Govindan et al., 2020).
- H3: Management commitment has a positive effect on Company Performance through Social Sustainability implementation (Sroufe & Gopalakrishna-Remani, 2019).
- H4: Financial Support has a positive effect on Company Performance through Social Sustainability implementation (Govindan et al., 2021).
- H5: Social Sustainability has a positive effect on Company Performance (Venkatesh Mani et al., 2018a).
Data were collected through a questionnaire containing structured questions using a Likert scale with an unstratified random sampling method using a variability level of 5% on 250 respondents from 160 suppliers from one motorcycle supply chain that can withstand the impact of pandemic. Data collection starts in December 2021 until June 2022. Considering the very limited literature of similar research in Indonesia, the authors adopt indicators of social sustainability based on researchers in foreign journals as follows:
Table I Research Indicator
| No. | Variables | Code | Indicators | Reference |
|---|---|---|---|---|
| K1 | Clear vision | (Walker & Jones, 2012) | ||
| Management Commitment | K2 | Social Sustainability practice | (Govindan et al., 2020) | |
| 1 | K3 | Employee development | (Govindan et al., 2021) | |
| K4 | Performance improvement | (Kumar & Rahman, 2017) | ||
| F1 | Working environment | (Lion et al., 2016) | ||
| F2 | Cost reduction pressure | (Shen et al., 2015) | ||
| 2 | Financial Support | F3 | Appropriate salary | (Shen et al., 2015) |
| F4 | External capital | (Chi, 2011) | ||
| F5 | Stable profit | (Shen et al., 2015) | ||
| S1 | Employee participation | (Staniškienė & Stankevičiūtė, 2018) | ||
| S2 | Employee cooperation | (Staniškienė & Stankevičiūtė, 2018) | ||
| S3 | Equal opportunities | (Staniškienė & Stankevičiūtė, 2018) | ||
| 3 | Social Sustainability | S4 | Employee development | (Staniškienė & Stankevičiūtė, 2018) |
| S5 | Health | (Staniškienė & Stankevičiūtė, 2018) | ||
| S6 | Safety | (Staniškienė & Stankevičiūtė, 2018) | ||
| S7 | External partnership | (Staniškienė & Stankevičiūtė, 2018) | ||
| P1 | Cost management | (Bowersox et al,2013) | ||
| P2 | Financial goal | (Bowersox et al,2013) | ||
| P3 | Customer satisfaction | (Bowersox et al,2013) | ||
| 4 | Company Performance | P4 | Product quality | (Bowersox et al,2013) |
| P5 | Delivery time | (Bowersox et al,2013) | ||
| P6 | Productivity | (Bowersox et al,2013) | ||
| P7 | Operational performance | (Bowersox et al,2013) |
Source: Author own elaboration
Before the questionnaire was distributed, a questionnaire testing procedure involving 50 respondents was carried out to measure the validity (face validity and content validity) and reliability of the questionnaire questions. Then, using the SEM-PLS tools, hypothesis testing is carried out in this study. The research framework is described as below:

Figure 2 Research Framework
In this study the practice of social sustainability is translated into 20 activities as follows:
Table II Social Sustainability Indicators
| No. | Indicator | Reference |
|---|---|---|
| 1 | Employee nutrition | (V. Mani et al., 2016) |
| 2 | Appropriate and timely payrolls | (Shen et al., 2015) |
| 3 | Support for social activity | (Hutchins & Sutherland, 2008) |
| 4 | Public and health facility | (Staniškienė & Stankevičiūtė, 2018) |
| 5 | Comfortable working atmospheres | (Lion et al., 2016) |
| 6 | Employee training and development | (Staniškienė & Stankevičiūtė, 2018) |
| 7 | Potential employee development | (Staniškienė & Stankevičiūtė, 2018) |
| 8 | No racist and discrimination | (Eizenberg & Jabareen, 2017) |
| 9 | Internal promotion priority | (Staniškienė & Stankevičiūtė, 2018) |
| 10 | Regular training for employee | (Staniškienė & Stankevičiūtė, 2018) |
| 11 | Openness to employee input | (Zorzini et al., 2015) |
| 12 | No child labor | (Venkatesh Mani et al., 2018a) |
| 13 | Employee reward | (V. Mani et al., 2016) |
| 14 | Safety protection & regulation | (Awan et al., 2019) |
| 15 | Safety protection & regulation | (Staniškienė & Stankevičiūtė, 2018) |
| 16 | Hiring employee from neighborhood | (Venkatesh Mani et al., 2018a) |
| 17 | General health insurance | (Yawar & Seuring, 2017) |
| 18 | General Pension insurance | (Venkatesh Mani et al., 2018b) |
| 19 | Personal protective equipment | (V. Mani et al., 2016) |
| 20 | Recruit according to skills and abilities | (Eizenberg & Jabareen, 2017) |
Source: Author own elaboration
Result And Discussion
The model of relationship between the research variables in the SEM-PLS is described below:
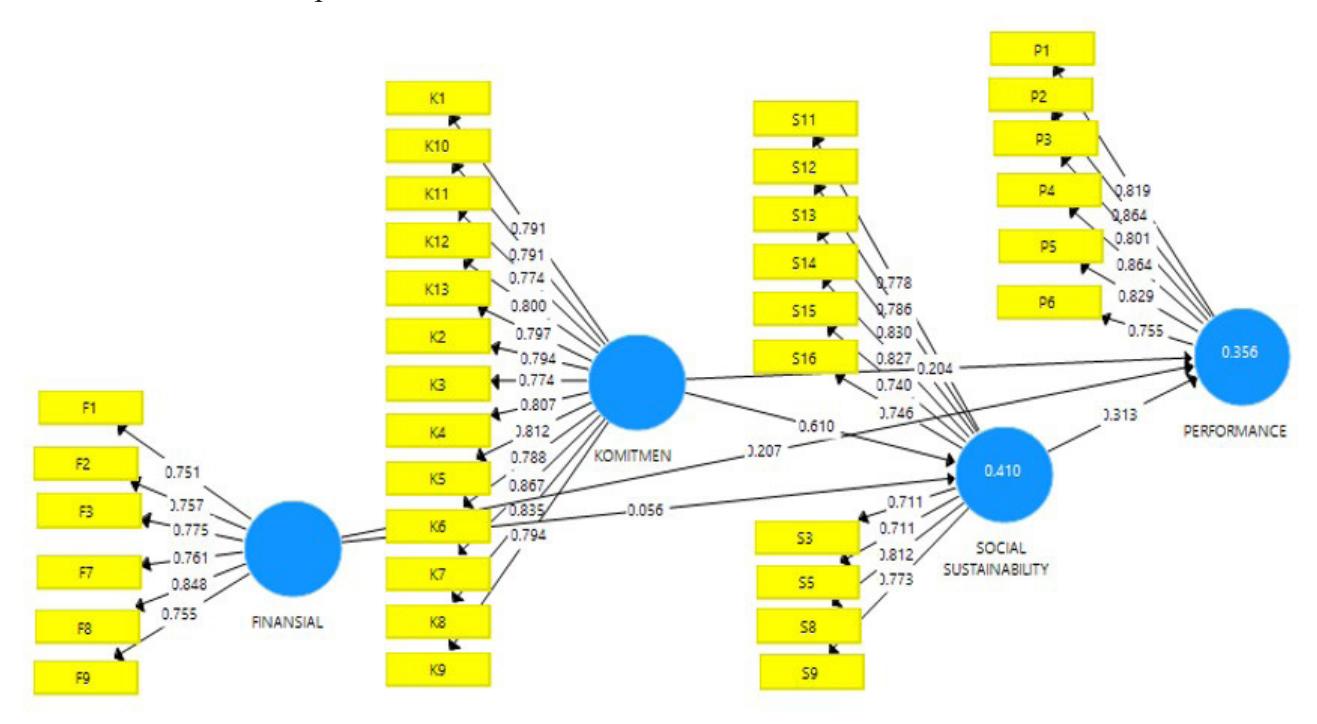
Figure 3 Research Model Source: SmartPLS3 output
The outer loading value of all the indicators that make up the research model above has a correlation > 0.7, which means it is acceptable and valid to measure the variables studied (Hartono et al., 2020). Referring to the respondent's assessments in this study, the social sustainability activities that are considered meaningful are as follows:
Table III Meaningful Social Sustainability Activities
| No. | Code | Activity |
|---|---|---|
| 1 | S3 | Social activities budget support |
| 2 | S5 | Comfortable working atmospheres |
| 3 | S8 | No Racist and Discrimination |
| 4 | S9 | Internal promotion |
| 5 | S11 | Open to employee input |
| 6 | S12 | Do not employ underage employee |
| 7 | S13 | Outstanding employee awards |
| 8 | S14 | Pay attention to work safety |
| 9 | S15 | Facilitate employee improvement |
| 10 | S16 | Hiring employee from the neighborhood |
Source: Author own elaboration
Outer Model Test
Convergent and discriminant validity in this study are as follows:
Table IV Outer Model Test Result
| RELL | ABILITY | FORNELL-LARCKER | |||||
|---|---|---|---|---|---|---|---|
| Cronbach's Alpha | Composite Reliability | Validity | Variables | Financial Support | Management Commitment | Company Performance | Social Sustainability |
| 0.868 | 0.900 | 0.601 | Financial | 0.775 | |||
| 0.954 | 0.959 | 0.643 | Commitment | 0.518 | 0.802 | ||
| 0.904 | 0.926 | 0.677 | Performance | 0.429 | 0.511 | 0.823 | |
| 0.925 | 0.937 | 0.597 | Sustainability | 0.372 | 0.639 | 0.520 | 0.773 |
Source: Data processed, 2022
Convergent validity is measuring the validity of the indicator as a measure of the variable. The value is reflected in the outer loading of each indicator. In this study, all variables have a value of AVE > 0.5, which indicates good convergent validity (Hartono et al., 2020). This means that all variables are valid, and it can explain the diversity of the indicators, whereas Discriminant validity relates to the principle that different construct metrics should not be highly correlated. Fornell-Larcker's value on discriminant validity, which is greater for the variable itself compared to other variables, illustrates that the latent construct predicts the size of their block better than other blocks. As a conclusion, the validity of this study has met the requirements for a powerful measuring tool to measure what should be measured.
Reliability is defined as an index that shows the extent to which a measuring instrument can be trusted and relied on. Reliability in this study is reflected by Cronbach's Alpha and Composite Reliability. All variables show numbers > 0.7, which means that all variables in this study are reliable (Hartono, 2020).
As a conclusion, the indicators used in this study are valid and reliable, which means they can explain and represent the measured variables and have good accuracy, precision, and consistency in measuring the measured variables.
Inner Model Test
The structural model in PLS is evaluated using R<sup>2</sup> for the dependent construct and the path coefficient values and T-values for the significance test between constructs in the structural model (Ghozali, 2021). The value of R<sup>2</sup> obtained in this study is as follows:
Table V Research R<sup>2</sup> Value
| VARIABLE | \(\mathbb{R}^2\) | Adjusted R2 |
|---|---|---|
| Company Performance | 0.356 | 0.348 |
| Social Sustainability | 0.410 | 0.405 |
Source: Data Processed, 2022
This R2 value gives an idea of how strong the exogenous construct is in explaining the endogenous construct. Adjusted R2 is the value of R2 that has been corrected based on the standard error value. This value is stronger in providing an overview when assessing exogenous constructs than in explaining endogenous constructs (Hartono et al, 2020).
On the variable of "Company Performance," the value of the adjusted R2 is 0.348, which explains that the exogenous constructs together affect the company's performance by 34.8% while the remaining 65.2% is influenced by other factors that are not included in this study. Likewise, the social sustainability variable is affected by 40.5%, while remaining 59.5% is influenced by other factors that are not included in this study.
It is illustrated that there are many other endogenous constructs that are not included in this study, and this can be an opportunity and challenge for future research (Landorf, 2011). As an example, there are many other variables that affect performance. This is because the indicators in the questionnaire explain the meaning of the company's performance variables within the framework of implementing social sustainability, not specifically indicators of company's performance from a business perspective. Taking reference from Nguyen et al. (2021), which examined 400 companies from 12 different industries, it was stated that the company's performance showed a correlation between the outputs and resources (inputs) used in the company's business processes, where the variable that was commonly represented was the Return value On Assets (ROA), Return On Equity (ROE) and Return On Investment (ROI). In addition to financial variables as stated before, there are 3 other variables according to Hubbard (2009) , namely the internal processes variable (consisting of: productivity, labor turn over, average unit production, working capital/sales, capacity utilization), learning and development variables (consisting of : new product developed, new market entered, R&D spend/sales, training spend/sales, investment/total assets), and the last variable customer/market (consisting of: market share, number of new customer, product return rate, defect, and order cycle time).
Referring to Landorf's, (2011) research on social sustainability, it is indeed challenging research because it is different from other dimensions. The researcher states that social sustainability contains many subjective factors, and it has many social indicators, and there is no consensus on which criteria can be adopted to define it. For example, Huq & Stevenson (2020) identified health, safety (worker's health, working and environmental conditions, occupational disease, fatalities, and readiness in urgent conditions), worker's quality of life (work stress, overtime, duration of working hours, low wages and job satisfaction), worker's rights (forced labor, including forced additional working time, freedom of association, humane treatment, paid leave, and maternity) as social indicators that must be considered.
Observation Research Value and Model Fit
Table VI Predictive Relevance Value
| Variables | SSO | SSE | Q2 | Model Saturated | Model Estimated |
|---|---|---|---|---|---|
| Company Performance | 1500.000 | 1151.093 | 0.233 | ||
| Social Sustainability | 2500.000 | 1923.677 | 0.231 | ||
| NFI | 0.791 | 0.791 |
Source: Data Processed ,2022
The predictive relevance value (Q2) of the 2 (two) endogenous variables is > 0 indicating this study has a good observation value (Ghozali, 2021) while for the FIT model the value of the Normed Fit Index is 0.791 which according to (Jonathan, 2010) means that the hypothesized model can explain 79.1% of the actual model (79.1% FIT model).
Hypothesis Testing
Table VII Path Coefficient and T statistic
| Correlation | Original sample | Average sample | Deviation Standard | T Statistic | P Values |
|---|---|---|---|---|---|
| F P | 0.207 | 0.206 | 0.072 | 2.874* | 0.004* |
| F S | 0.056 | 0.061 | 0.060 | 0.938 | 0.349 |
| C P | 0.204 | 0.205 | 0.102 | 2.006* | 0.045* |
| C S | 0.610 | 0.606 | 0.065 | 9.442* | 0.000* |
| S P | 0.313 | 0.313 | 0.095 | 3.302* | 0.001* |
The Testing Effect of Social Sustainability... | Bowie, Sumarsono, Sawarni, Herry
| F S P | 0.018 | 0.020 | 0.022 | 0.793 | 0.428 |
|---|---|---|---|---|---|
| C S P | 0.191 | 0.188 | 0.056 | 3.427* | 0.001* |
F = Financial Support P = Company Performance S = Social Sustainability C = Management Commitment
*=significant at 0.05 level
Source: Data processed, 2022
Based on table 3.5 above then the hypotheses built in this research can be concluded as follows:
- 1. Management commitment has a positive effect on company performance (Path Coefficient 0.204 > 0) and significant (T Statistic 2.006 > 1.96 and P Values 0.045 < 0.05). Conclusion: H1 is accepted. This is in accordance with Hussain et al., (2018) research.
- 2. Financial Support has a positive effect on company performance (Path Coefficient 0.207 > 0) and significant (T Statistic 2.874 > 1.96 and P Values 0.004 < 0.05). Conclusion: H2 is accepted. This is in accordance with Govindan et al., (2020) research.
- 3. Management commitment has a positive effect on company performance through social sustainability implementation (Path Coefficient 0.191 > 0) and significant (T Statistic 3.427 > 1.96 and P Values 0.001 < 0.05). Conclusion: H3 is accepted. This is in accordance with Sroufe & Gopalakrishna-Remani, (2019) research. This also shows that the mediating effect of social sustainability is partial mediation.
- 4. Financial support has a positive effect on company performance through social sustainability implementation (Path Coefficient 0.018 > 0), but it is not significant (T Statistic 0.793 < 1.96 and P Values 0.428 > 0.05). Conclusion: H4 is rejected. This is not according to Govindan et al., (2021), but according to research by Venkatesh Mani et al. (2020), and Sroufe & Gopalakrishna-Remani (2019). This also shows that the mediating effect of social sustainability, which changes the direct positive and significant effect of financial support to be insignificant is full mediation.
- 5. Social Sustainability has a positive effect on company performance (Path Coefficient 0.313 > 0) and significant (T Statistic 3.302 > 1.96 and P Values 0.001 < 0.05). Conclusion: H5 is accepted. This is in accordance with Venkatesh Mani et al. (2018a).
On H4, financial support is positively correlated, but if seen, the correlation is weak (the path coefficient value of an indirect relationship specific is 0.018 > 0), so the correlation is not significant. The direct correlation between financial support is 0.207; it drops to 0.018 if it is mediated by social sustainability. This can be explained because of a direct relationship between financial support and social sustainability, which is also low (path coefficient 0.056) and not significant (T statistic 0.968 < 1.96 and P values 0.334 > 0.05). From this data, it can be concluded that the mediating effect of social sustainability weakens the correlation off financial support with Company Performance.
Conclusion
Based on the results of the research conducted, the following conclusions can be drawn: First, there are 10 (ten) significant social sustainability activities identified that were carried out by companies that survived the pandemic. Second, this research has obtained results and proves correlation between variables studied. Implementation of social sustainability is one of the variables that supports the company's resilience to the economic impact of the COVID-19 pandemic, as well as paving the way for further research on social sustainability in Indonesia, which has not been done much.
We acknowledge the limitations of this study, which uses only a small number of social variables that affect company performance, and it is carried out in certain sectors and under certain conditions. Research on Social Sustainability is a challenging research where in Indonesia not many researchers
have done it. Hopefully research like this can be expanded with different variables, indicators, and conditions to complement, enrich knowledge, and have a positive effect on research on the three pillars of sustainability (economic, environmental, and social).
Acknowledgment
We would like to thank PT Astra Honda Motor, especially the procurement g general m manager who has given permission, and the companies in the supply chain for sharing and providing valuable information in this research.
References
- Abbasi, M. (2017). Towards socially sustainable supply chains themes and challenges. European Business Review, 29(3), 261–303. https://doi.org/10.1108/EBR-03-2016-0045
- Alqudah, I. H. A., Carballo-Penela, A., & Ruzo-Sanmartín, E. (2022). High-performance human resource management practices and readiness for change: An integrative model including affective commitment, employees' performance, and the moderating role of hierarchy culture. European Research on Management and Business Economics, 28(1), 100177. https://doi.org/10.1016/j. iedeen.2021.100177
- Awan, U., Sroufe, R., & Kraslawski, A. (2019). Creativity enables sustainable development: Supplier engagement as a boundary condition for the positive effect on green innovation. Journal of Cleaner Production, 226, 172–185. https://doi.org/10.1016/j.jclepro.2019.03.308
- Bowersox et al. (2013). Supply Chain Logistics Management. Fourth Edition. McGraw-Hill Education, 2 Penn Plaza, New York, NY10121.
- Bubicz, M. E., Barbosa-Póvoa, A. P. F. D., & Carvalho, A. (2019). Incorporating social aspects in sustainable supply chains: Trends and future directions. Journal of Cleaner Production, 237. https://doi.org/10.1016/j.jclepro.2019.06.331
- Chi, T. (2011). Building a sustainable supply chain: An analysis of corporate social responsibility (CSR) practices in the Chinese textile and apparel industry. Journal of the Textile Institute, 102(10), 837– 848. https://doi.org/10.1080/00405000.2010.524361
- Eizenberg, E., & Jabareen, Y. (2017). Social sustainability: A new conceptual framework. Sustainability (Switzerland), 9(1). https://doi.org/10.3390/su9010068
- Fahimnia, B., Sarkis, J., & Davarzani, H. (2015). Green supply chain management: A review and bibliometric analysis. In International Journal of Production Economics (Vol. 162). Elsevier. https://doi.org/10.1016/j.ijpe.2015.01.003
- Govindan, K., Rajeev, A., Padhi, S. S., & Pati, R. K. (2020). Supply chain sustainability and performance of firms: A meta-analysis of the literature. Transportation Research Part E: Logistics and Transportation Review, 137(March), 101923. https://doi.org/10.1016/j.tre.2020.101923
- Govindan, K., Shaw, M., & Majumdar, A. (2021). Social sustainability tensions in multi-tier supply chain: A systematic literature review towards conceptual framework development. Journal of Cleaner Production, 279, 123075. https://doi.org/10.1016/j.jclepro.2020.123075
- Gozali, Imam. (2021). Structural Equation Modelling dengan Metode Alternatif Partial Least Squares (PLS). Badan Penerbit Undip, Semarang
- Hartono, J., Abdillah, W., Usman, B. (2020). Edisi kedua Cetakan Pertama. Konsep dan Aplikasi Structural Equation Modelling Berbasis Varian dalam Penelitian Bisnis. UPP STIM YKPN. Yogyakarta55581
- Hubbard, G. (2009). Measuring organizational performance: Beyond the triple bottom line. Business Strategy and the Environment, 18(3), 177–191. https://doi.org/10.1002/bse.564
- Hussain, M., Ajmal, M. M., Gunasekaran, A., & Khan, M. (2018). Exploration of social sustainability in healthcare supply chain. Journal of Cleaner Production, 203, 977–989. https://doi.org/10.1016/j. jclepro.2018.08.157
- Hutchins, M. J., & Sutherland, J. W. (2008). An exploration of measures of social sustainability and their application to supply chain decisions. Journal of Cleaner Production, 16(15), 1688–1698. https:// doi.org/10.1016/j.jclepro.2008.06.001
- Huq, F. A., & Stevenson, M. (2020). Implementing Socially Sustainable Practices in Challenging Institutional Contexts: Building Theory from Seven Developing Country Supplier Cases. Journal of Business Ethics, 161(2), 415–442. https://doi.org/10.1007/s10551-018-3951-x
- Jonathan, S. (2010). Pengertian Dasar Structural Equation Modeling (SEM). Jurnal Ilmiah Manajemen Bisnis Ukrida, 10(3), 98528
- Kumar, D., & Rahman, Z. (2017). Analyzing enablers of sustainable supply chain: ISM and fuzzy AHP approach. Journal of Modelling in Management, 12(3), 498–524. https://doi.org/10.1108/JM2-02- 2016-0013
- Kusi-Sarpong, S., Gupta, H., & Sarkis, J. (2019). A supply chain sustainability innovation framework and evaluation methodology. International Journal of Production Research, 57(7), 1990–2008. https:// doi.org/10.1080/00207543.2018.1518607
- Landorf, C. (2011). Evaluating social sustainability in historic urban environments. International Journal of Heritage Studies, 17(5), 463–477. https://doi.org/10.1080/13527258.2011.563788
- Lion, A., Macchion, L., Danese, P., & Vinelli, A. (2016). Sustainability approaches within the fashion industry: The supplier perspective. Supply Chain Forum, 17(2), 95–108. https://doi.org/10.1080/1 6258312.2016.1176752
- Mani, V., Agarwal, R., Gunasekaran, A., Papadopoulos, T., Dubey, R., & Childe, S. J. (2016). Social sustainability in the supply chain: Construct development and measurement validation. Ecological Indicators, 71, 270–279. https://doi.org/10.1016/j.ecolind.2016.07.007
- Mani, Venkatesh, Gunasekaran, A., & Delgado, C. (2018). Enhancing supply chain performance through supplier social sustainability: An emerging economy perspective. International Journal of Production Economics, 195, 259–272. https://doi.org/10.1016/j.ijpe.2017.10.025
- Mani, Venkatesh, Jabbour, C. J. C., & Mani, K. T. N. (2020). Supply chain social sustainability in small and medium manufacturing enterprises and firms' performance: Empirical evidence from an emerging Asian economy. International Journal of Production Economics, 227(July 2019), 107656. https:// doi.org/10.1016/j.ijpe.2020.107656
- Margolis, J. D., Elfenbein, H. A., & Walsh, J. P. (2012). Does it Pay to Be Good...And Does it Matter? A Meta-Analysis of the Relationship between Corporate Social and Financial Performance. SSRN Electronic Journal, 1–68. https://doi.org/10.2139/ssrn.1866371
- Marshall, D., McCarthy, L., McGrath, P., & Claudy, M. (2015). Going above and beyond: How sustainability culture and entrepreneurial orientation drive social sustainability supply chain practice adoption. Supply Chain Management, 20(4), 434–454. https://doi.org/10.1108/SCM-08-2014-0267
- NGUYEN, V., NGUYEN, T., NGUYEN, V., & DO, D. (2021). Internal Factors Affecting Firm Performance: A Case Study in Vietnam. The Journal of Asian Finance, Economics and Business, 8(5), 303–314. https://doi.org/10.13106/jafeb.2021.vol8.no5.0303
- Savitz, A. W. (2014). the Triple Bottom Line. 28(9), 2–9.
- Sekaran,Uma., & Bougie, Roger. (2017). Research Methods for Business, 6th ed. John Wiley & Sons, Inc. 111 River Street Hoboken,Nj07030, USA
- Shen, L., Govindan, K., & Shankar, M. (2015). Evaluation of barriers of corporate social responsibility using an analytical hierarchy process under a fuzzy environment-A textile case. Sustainability (Switzerland), 7(3), 3493–3514. https://doi.org/10.3390/su7033493
- Sroufe, R., & Gopalakrishna-Remani, V. (2019). Management, social sustainability, reputation, and financial performance relationships: An empirical examination of U.S. firms. In Organization and Environment (Vol. 32, Issue 3). https://doi.org/10.1177/1086026618756611
- Staniškienė, E., & Stankevičiūtė, Ž. (2018). Social sustainability measurement framework: The case of employee perspective in a CSR-committed organisation. Journal of Cleaner Production, 188, 708–719. https://doi.org/10.1016/j.jclepro.2018.03.269
- Sugiyono. (2019). Metode Penelitian Kuantitatif ,Kualitatif dan R&D. Cetakan ke-1 September 2019. Penerbit Alfabeta.Bandung
- Tan, J., & Wang, L. (2010). Flexibility-efficiency tradeoff and performance implications among Chinese SOEs. Journal of Business Research, 63(4), 356–362. https://doi.org/10.1016/j.jbusres.2009.04.016
- Walker, H., & Jones, N. (2012). Sustainable supply chain management across the UK private sector. Supply Chain Management, 17(1), 15–28. https://doi.org/10.1108/13598541211212177
- Zorzini, M., Hendry, L. C., Huq, F. A., & Stevenson, M. (2015). Socially responsible sourcing: Reviewing the literature and its use of theory. International Journal of Operations and Production Management, 35(1), 60–109. https://doi.org/10.1108/IJOPM-07-2013-0355
- Yawar, S. A., & Seuring, S. (2017). Management of Social Issues in Supply Chains: A Literature Review Exploring Social Issues, Actions and Performance Outcomes. Journal of Business Ethics, 141(3), 621–643. https://doi.org/10.1007/s10551-015-2719-9
- Yuan, F., & Woodman, R. W. (2010). Innovative behavior in the workplace: The role of performance and image outcome expectations. Academy of Management Journal, 53(2), 323–342. https://doi. org/10.5465/amj.2010.49388995