
Keywords:
waste bin, persuasive, household, design thinking
The increase in population causes an increase in the amount of public consumption, increasing the amount of waste. Based on databoks.katadata.co.id, households are known to be waste contributors. Then, based on the Katadata Insight Center (KIC) survey in 2019, it was found that 50.8% of households did not sort waste. The behavior of households is an important problem to be solved because mixed waste cannot be separated and recycled again. Seeing these conditions, it is necessary to design a waste bin to persuade households to perform waste-sorting activities. The waste problem is considered wicked, and design thinking is the appropriate method to approach it. Research with design thinking is carried out through understanding, observing, defining, creating ideas, prototyping, and testing stages. In testing the prototype, the persuasive level of the waste bin design was assessed using the Perceived Persuasiveness Questionnaire (PPQ). This research results in a waste bin consisting of four boxes equipped with an adjustable bulkhead, QR-Code, and removable sorting card that can make a sound when not throwing garbage.
INFO ARTIKEL
Kata kunci:
tempat sampah, persuasif, rumah tangga, design thinking
ABSTRAK
Peningkatan populasi masyarakat menyebabkan peningkatan jumlah konsumsi yang berdampak pada meningkatnya jumlah sampah. Berdasarkan databoks.katadata. co.id rumah tangga merupakan penyumbang sampah terbanyak. Berdasarkan survei Katadata Insight Center (KIC) pada tahun 2019, sebanyak 50,8% rumah tangga tidak memilah sampah. Perilaku rumah tangga tersebut menjadi permasalahan yang penting untuk diselesaikan karena sampah yang sudah tercampur tidak dapat dipilah dan didaur ulang kembali. Berdasarkan kondisi tersebut, perlu perancangan tempat sampah yang dapat mengajak rumah tangga untuk memilah sampah dan memudahkan aktivitas pemilahan sampah. Permasalahan sampah merupakan wicked problems, sehingga metode yang sesuai untuk menyelesaikannya adalah design thinking. Penelitian dengan metode design thinking dilakukan melalui tahapan understand, observe, define, ideate, prototype, dan test. Dalam pengujian prototipe, tingkat persuasif rancangan tempat sampah dinilai dengan menggunakan Perceived Persuasiveness Questionnaire (PPQ). Rancangan yang dihasilkan penelitian ini adalah tempat sampah yang terdiri atas empat kotak, dilengkapi sekat adjustable, QR-Code, kartu pemilahan lepas pasang, dan mengeluarkan suara ketika ada yang hendak membuang sampah.
Introduction
According to the World Health Organization (WHO), waste is goods originating from human activities that are no longer used, either not used, disliked, or thrown away. Article 1 of Indonesian Law No. 18 of 2008 defines waste as the solid residue of daily human activities and/or natural processes. The law also explains that waste generators are everyone and/or the result of natural processes that produce waste.
Over the years, the population of Indonesia has continued to increase. Based on data from the Central Statistics Agency (BPS) on the website of the Cabinet Secretariat of the Republic of Indonesia, from 2010 to 2020, Indonesia's average population growth rate was 1.25% per year. More population has an impact on the amount of public consumption. Based on BPS data on the databoks website, Indonesian household consumption will grow by 2.02% in 2021. The increase in public consumption increases the amount of waste produced. Based on data from the Ministry of Environment and Forestry (KLHK) on the databoks.katadata.co.id website, in 2020, Indonesia produced a total of 67.8 million tons of waste, with an average increase in the amount of waste from 2015 to 2020 of 1.04% per year. Of all the waste generated in 2020, households will be the most significant waste producers, at 37.3%. In addition to these data, there are also known statistics related to the number of households that carry out waste segregation. Launching from katadata.co.id, based on the results of the Katadata Insight Center (KIC) survey in 2019, it was found that 50.8% of households out of 354 respondents did not sort waste. Of the 50.8%, 79% said they did not sort their waste because they did not want to.
Sorting waste according to its type is essential because segregated waste is easier to manage and reuse. According to the Special Region of Yogyakarta Environment and Forestry Service (2019), to minimize waste problems, there must be waste management at the source, where one of the sources is households. Then, according to Rismayanti and Asmarani (2021), if all types of waste are disposed of altogether, everything becomes waste. However, if the waste is sorted according to its kind, it cannot be seen as waste. According to the Special Region of Yogyakarta Environment and Forestry Service (2019), waste can be divided into two categories based on its nature, namely, organic and inorganic. Organic waste is a material that can quickly decompose so that it can be processed into compost. Meanwhile, inorganic waste is a material that is difficult to decompose, so its management involves recycling it into something new and useful again. Waste can also be divided into two groups based on how it looks: solid waste and liquid waste. Solid waste is a material other than human waste that humans dispose of, and liquid waste is a material that is no longer used and disposed of.
Households only need to sort waste and transfer it to waste managers and recyclers for collection. This is because in Indonesia, there are already quite a few waste banks, industries, organizations, and communities that are engaged in helping the community and government collect and recycle waste. Based on data from the Ministry of Industry of the Republic of Indonesia, the population of the plastic recycling industry in Indonesia includes around 600 large and 700 small enterprises. Then, based on data from the Ministry of Environment and Forestry (KLHK), there are 1446 waste banks spread throughout Indonesia. Each waste bank, industry, organization, and community can manage waste management and collect it for further management or recycling according to its type. From here, the role of the community in sorting and collecting waste from agents, companies, and organizations becomes vital.
Persuasive technology can be one of the things that can be done to overcome problems in household behaviors that do not sort waste. Persuasive technology is known as a technique that can influence and change user behavior. Fogg (2003) defined 'persuasive' as an attempt to change the attitude or behavior. In the application of persuasive technology, a processing product can act as a tool (the computer as a tool), a medium (the computer as a medium), or a social actor (the computer as a social actor).
The waste problem is complex, or often defined as a wicked problem. According to Kumar (2017), the wicked problem is a problem that is ambiguous, complex, and has no absolute and clear correct solution. One method that can be used to overcome this wicked problem is design thinking. One trait of design thinking is accepting complexity (Lewrick et al., 2018). This means that we can explore complex systems, accept uncertainty, and acknowledge that complex systems demand complex solutions.
Based on the conditions previously described, it is known that households are the biggest waste producers. The behavior of households that do not sort waste makes it difficult to manage and recycle this waste. This behavior occurs because households do not want to bother managing waste. On the other hand, several waste banks, industries, organizations, and communities are willing to collect and recycle waste from households only when the waste has been sorted. Therefore, this research aims to design a persuasive waste bin that can facilitate waste sorting in the household sector through the application of design thinking.
Method
Design thinking is a human-centered approach to innovation that draws from a designer's tools to integrate people's needs, technological possibilities, and requirements for business success (Lewrick et al., 2020). Several thinking frameworks need to be applied when applying design thinking to solve a problem. The first stage is to focus on people, build empathy, and carefully explore user needs. The second stage is driven by curiosity, being open, continuously asking questions, and changing perspectives to see things from different points of view. The third stage is to accept complexity by exploring complex systems, tolerating uncertainty, and embracing the fact that complex systems demand complex solutions. The fourth stage is to use visualizations, stories, and simple language to share findings with the team and create a clear value proposition for users. The final stage is iteratively building and testing prototypes to understand, learn, and solve problems in the user's context. According to Lewrick et al. (2020), there are seven stages of the design thinking micro-cycle. The first three stages become the problem space (i.e., understand, observe, and define the point of view); the following three stages are the solution space (i.e., ideate, prototype, and test); and the process ends with reflection.
Result and Discussion
Understand and Observe
The initial stage in the design thinking method is to understand the problem and observe user needs. Understanding the problem is carried out by studying potential users, their needs, and the tasks that must be completed. Then observing user needs is conducted by searching, studying, and identifying the needs of potential users. The tools used to understand problems and observe user needs in this research are explorative interviews, persona creation, empathy maps, AEIOU, and customer journey maps.
Explorative interviews are conducted to study potential users in more depth. This study conducted explorative interviews with ten participants by asking them the questions in Table I. There are two categories of participants: users who have performed waste sorting and those who have not. In conducting explorative interviews, three stages start from introducing the user, understanding the waste management carried out by the user, concluding the results of the user's answers, and asking the user's expectations regarding waste segregation.
Table I Explorative Interview Questions
| Introduction | |
|---|---|
| 1. | Where do you live? |
| 2. | Who are the occupants of your home or place of residence? |
| 3. | What does the waste bin used in your home look like? |
| Get to know the entire story | |
| 4. | What are your habits and those of your household when it comes to managing waste at home? |
| 5. | What is the waste disposal process that is currently being done at home? |
| 6. | What is the reason for your family to choose this habit? |
| 7. | In your opinion and that of the other occupants, how is the habit currently being carried out? |
| 8. | Does every occupant have the desire to change the habit of managing waste at home that they are currently running? |
| 9. | Do you and other occupants know that specific waste categories can be recycled and that waste banks/industry, organizations, communities, are willing to collect and process them? |
| 10. | Has your home ever used their services? What is the reason? |
| 11. | What equipment or tool does your house need or use to manage waste at home? |
| 12. | Are you and other occupants comfortable with the equipment or tool you are currently using? |
| 13. | What is the biggest challenge for your family to start or run waste sorting at home? |
| 14. | Which occupant in your home makes it difficult to sort waste? |
| 15. | What does your home need to be able to support and perform waste sorting at home? |
| 16. | According to you and other occupants, how important is it to sort waste at home? |
| Conclusion | |
| 17. | Based on your views and experiences and those of other occupants, what are the biggest obstacles to sorting waste at home? |
| 18. | What are your wishes regarding waste sorting at home? |
(Source: Author's own elaboration)
From the results of explorative interviews, users conveyed their problems and wishes regarding waste segregation at home. Table II is a collection of the main obstacles to start waste sorting at home and the wishes users want regarding waste sorting at home.
Table II Users' Obstacles and Wishes
| Obstacles to waste segregation at home | Wishes regarding waste segregation at home |
|---|---|
| Starting and getting used to doing new habits consistently | Practical waste bins that are space-saving and can store several categories of waste at once |
| Understanding waste segregation categories, providing adequate tools to sort from scratch, and changing habits | Waste bins that already support sorting from the start, can be adjusted in size and provide clear information about sorting. |
| Setting up adequate waste sorting bins and maintaining behaviors to consistently sort waste | Wanting to make the activity of disposing and sorting waste easy and fun for all occupants |
| Knowledge about waste sorting still needs to be improved, especially for the older generation, who are at home even though they are the ones who decide whether to sort waste at home or not. | A "super user" who can become very knowledgeable about sorting waste at home to make it easier for him to sort waste at home. |
| Get rid of the lazy feeling of separating plastic bottles | A tool that facilitates waste sorting |
| and walking to a particular plastic bottle waste bin. | At each location of the waste bin, there are several places to sort waste at once. |
| understanding a clearly segregated waste management system. | a clear explanation of the waste management system from start to finish, so that time and effort to sort waste are well-spent. |
| Maintaining discipline in sorting waste. | Waste bins that automatically sort without thinking can reduce the smell of waste |
(Source: Author's own elaboration)
Based on the results of explorative interviews, it was also found that there were three categories of households. The three categories are households that do not sort waste at all, households that sort waste from scratch, and households that sort waste when cleaning out waste bins (every occupant does not sort waste, and the occupant who oversees cleaning trash bins will sort waste from each place). Each identified household category is then described as a persona, as seen in Figure 1.
Along with conducting explorative interviews, observations of user needs were also carried out. Observations were made of the trash bins used by the user at home and the user's activity in managing waste at home. The observation results were first portrayed in an empathy map (Figure 2). Creating an empathy map helps to understand the users by better understanding their feelings and empathizing with their actions. Furthermore, a customer journey map (Figure 3) is also described based on observations of user needs. This map contains the user's journey in managing waste at home, which consists of the phases before, during, and after waste disposal. By describing this map, researchers can walk from the user's point of view and understand users in depth regarding their experience in managing waste at home. The results of observations of user needs are also included in the AEIOU (Figure 4), which stands for activities, environment, interaction, objects, and users. The names of the tools show that they are used to learn and see more about activities, the environment, the interactions that occur in the activities carried out, the objects involved with the user, and the users involved in the activity.
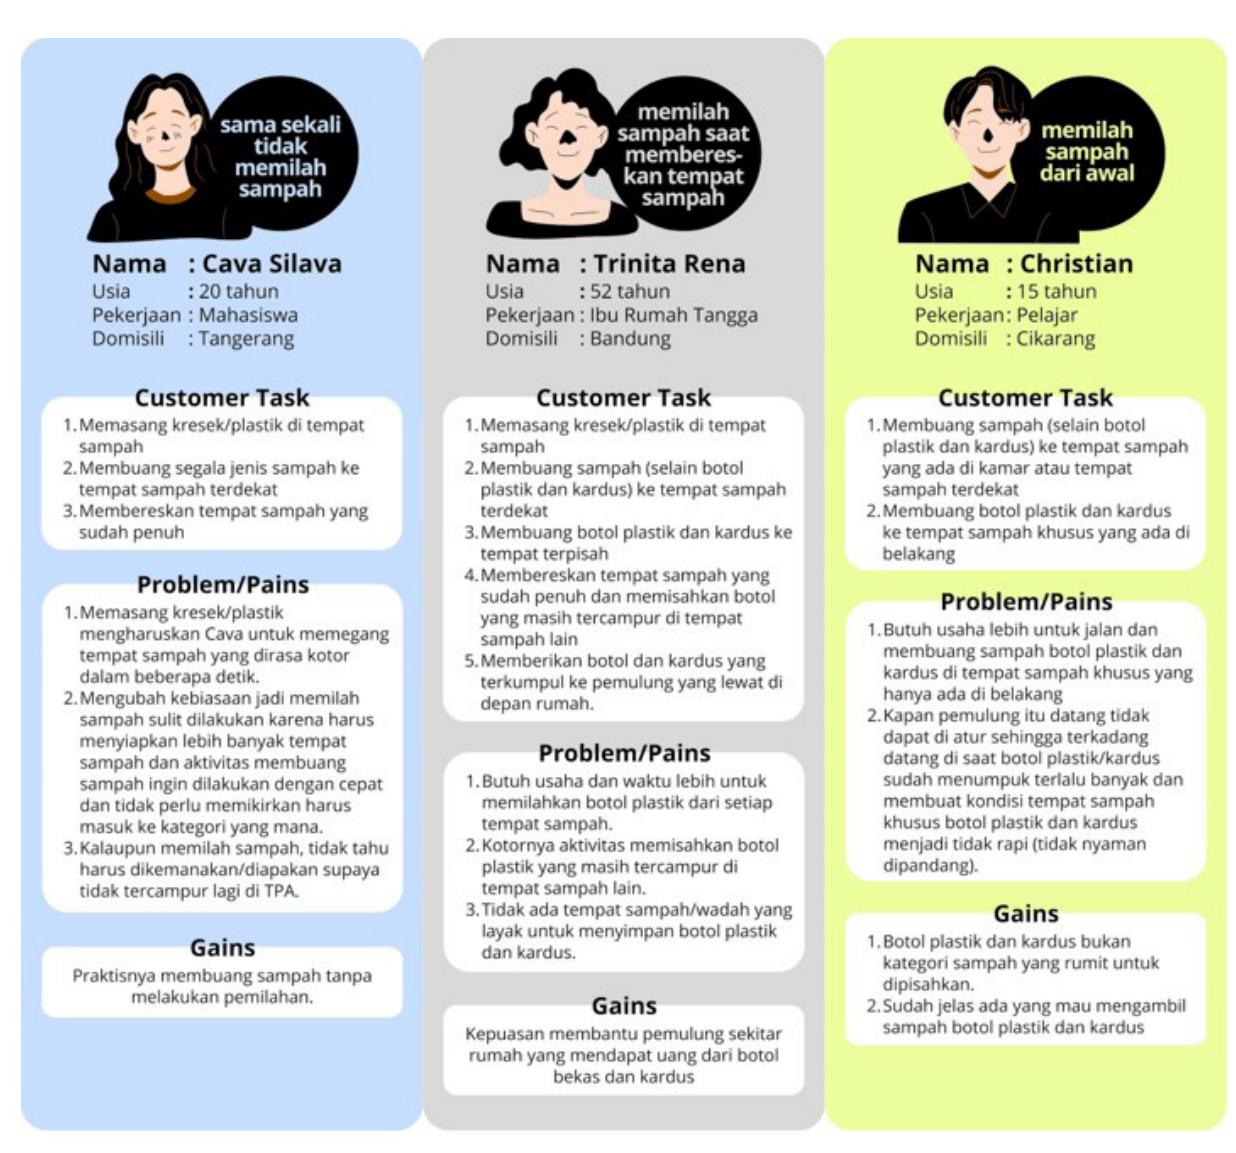
Figure 1 User Persona
We obtained some insights from the understand and observe phases by employing all the tools used. Each tool provides different understandings regarding the results of interviews and observations of user needs. Table III summarizes the insights obtained from the understand and observe stages based on the three tools previously used.
Table III Insights on Users
| Tools | Insight |
|---|---|
| The user needs a way of sorting waste that is as practical as not sorting waste. | |
| Helping waste collectors by providing segregated plastic bottles and cardboard can bring pleasure and satisfaction to users. | |
| Empathy Map | The user needs a pick-up system for the segregated waste at home so that households do not have to bother going to hand it over. |
| There is an opportunity for segregated waste to be handed over to the right party to reduce waste piles in landfills and generate income. | |
| The user needs an easy method of installing temporary waste disposal bags to minimize direct contact with the dirty parts of the waste bin. | |
| Customer | Each waste bin in the house needs to be able to separate several categories of waste at once so that users do not have to walk far to dispose of any waste. |
| Journey | Create a system/method/tool to speed up cleaning disposal bags/waste bins. |
| Map | An appropriate form of bin is needed to store the particular category of sorted waste. |
| The user needs a system, means, or tools that can ensure that waste sorting activities are consistently carried out. | |
| A waste bin is needed to facilitate sorting at home from the start. | |
| A waste bin is needed to accommodate several categories of waste at once. | |
| Segregated waste collection services need to be introduced. | |
| AEIOU | There is a need to create or make parties or tools that can persuade users to sort waste consistently. |
| There is a need to provide education regarding waste sorting at home, especially for waste other than plastic bottles and cardboard. | |
| There is a need for information regarding the waste categories that can be collected at segregated waste collection services. |
(Source: Author's own elaboration)
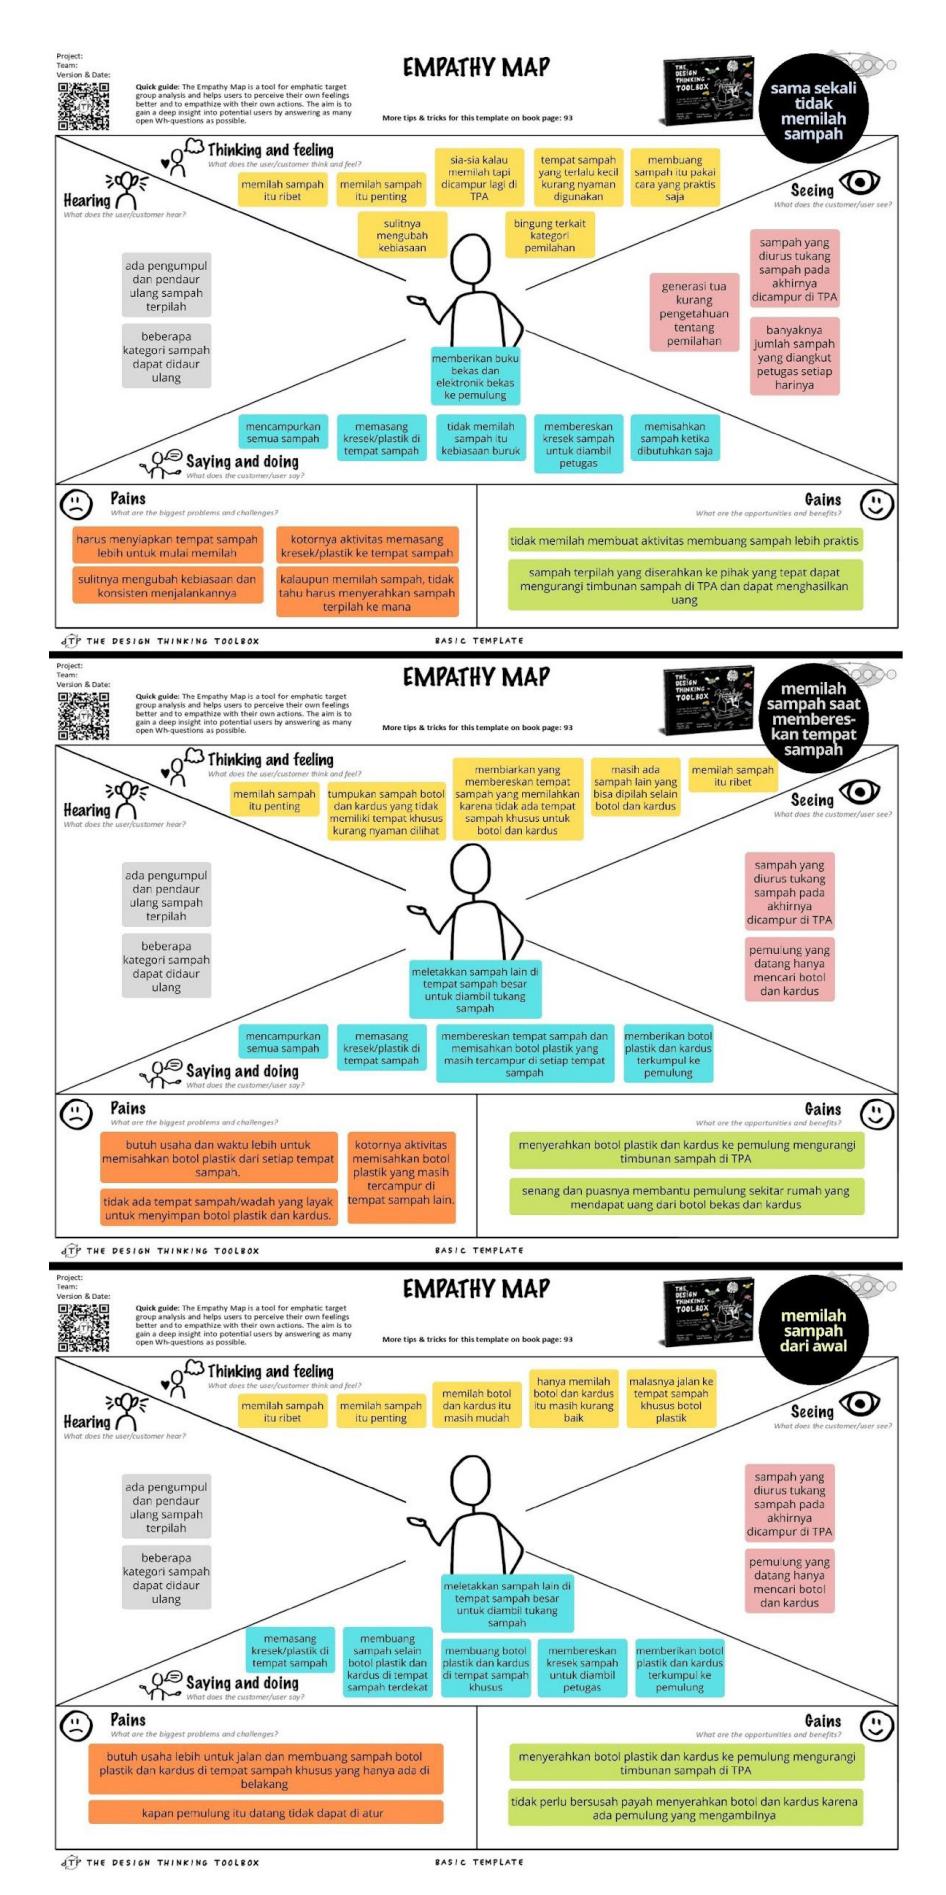
Figure 2 Empathy Map
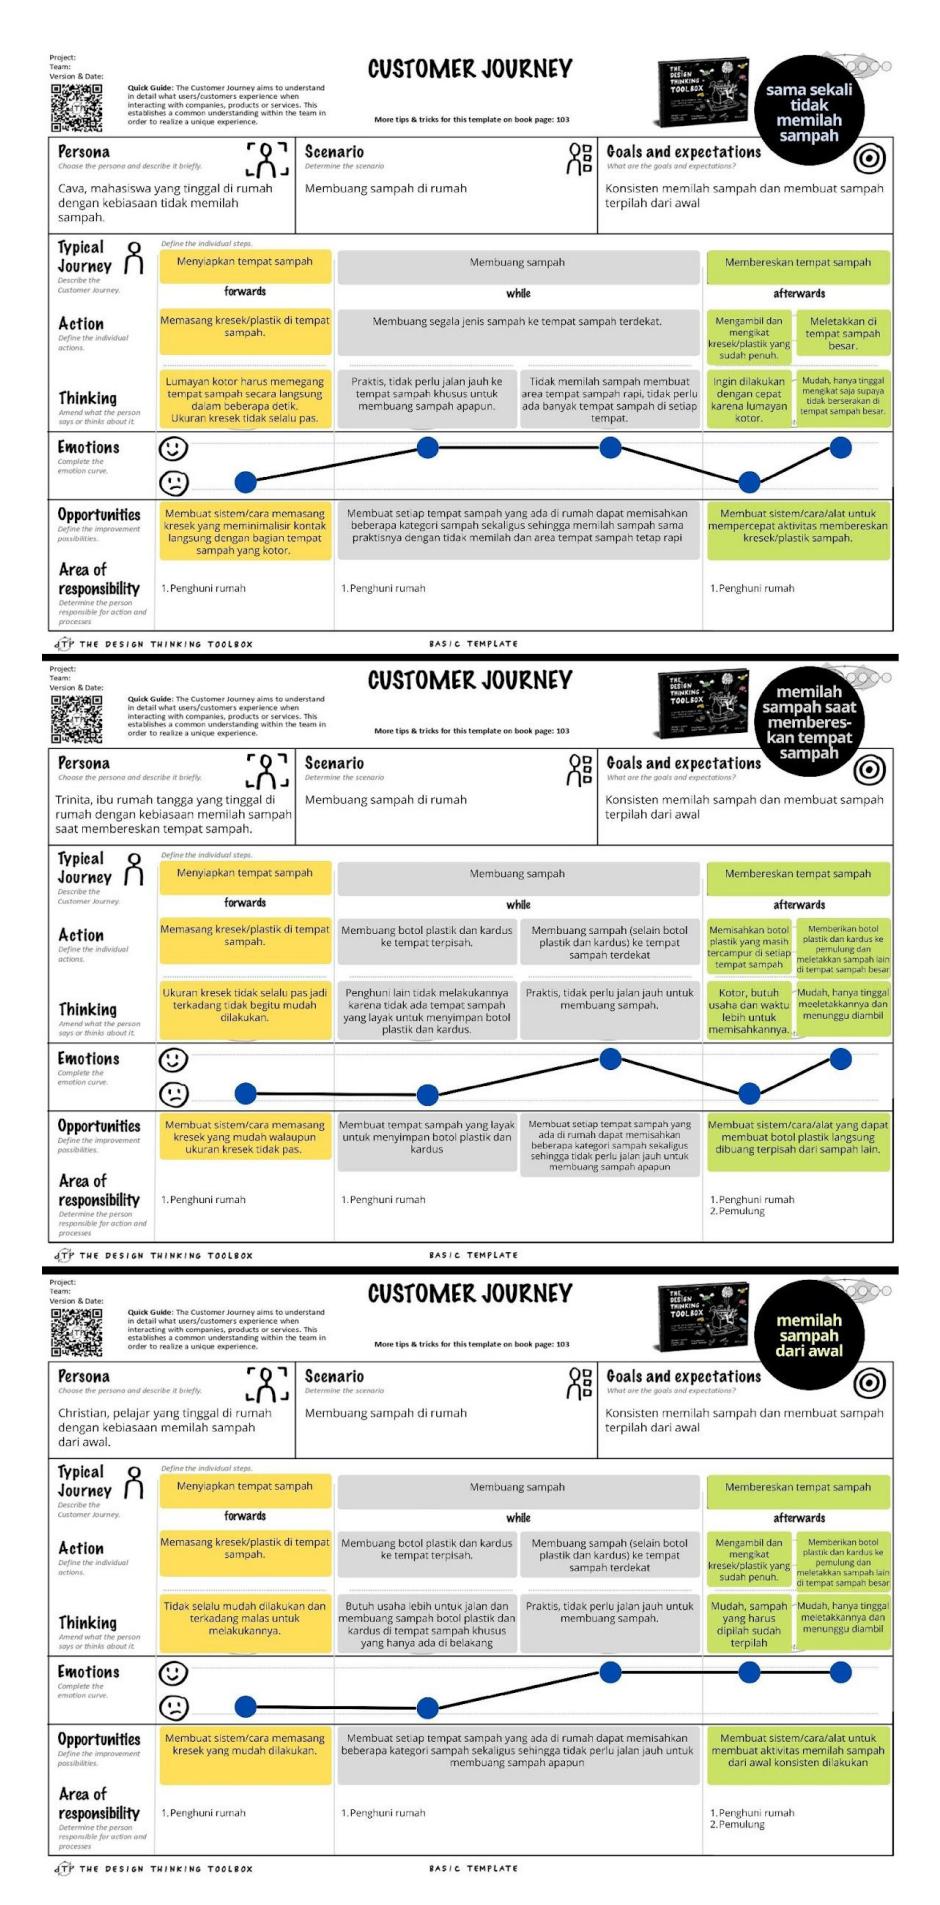
Figure 3 Customer Journey Map
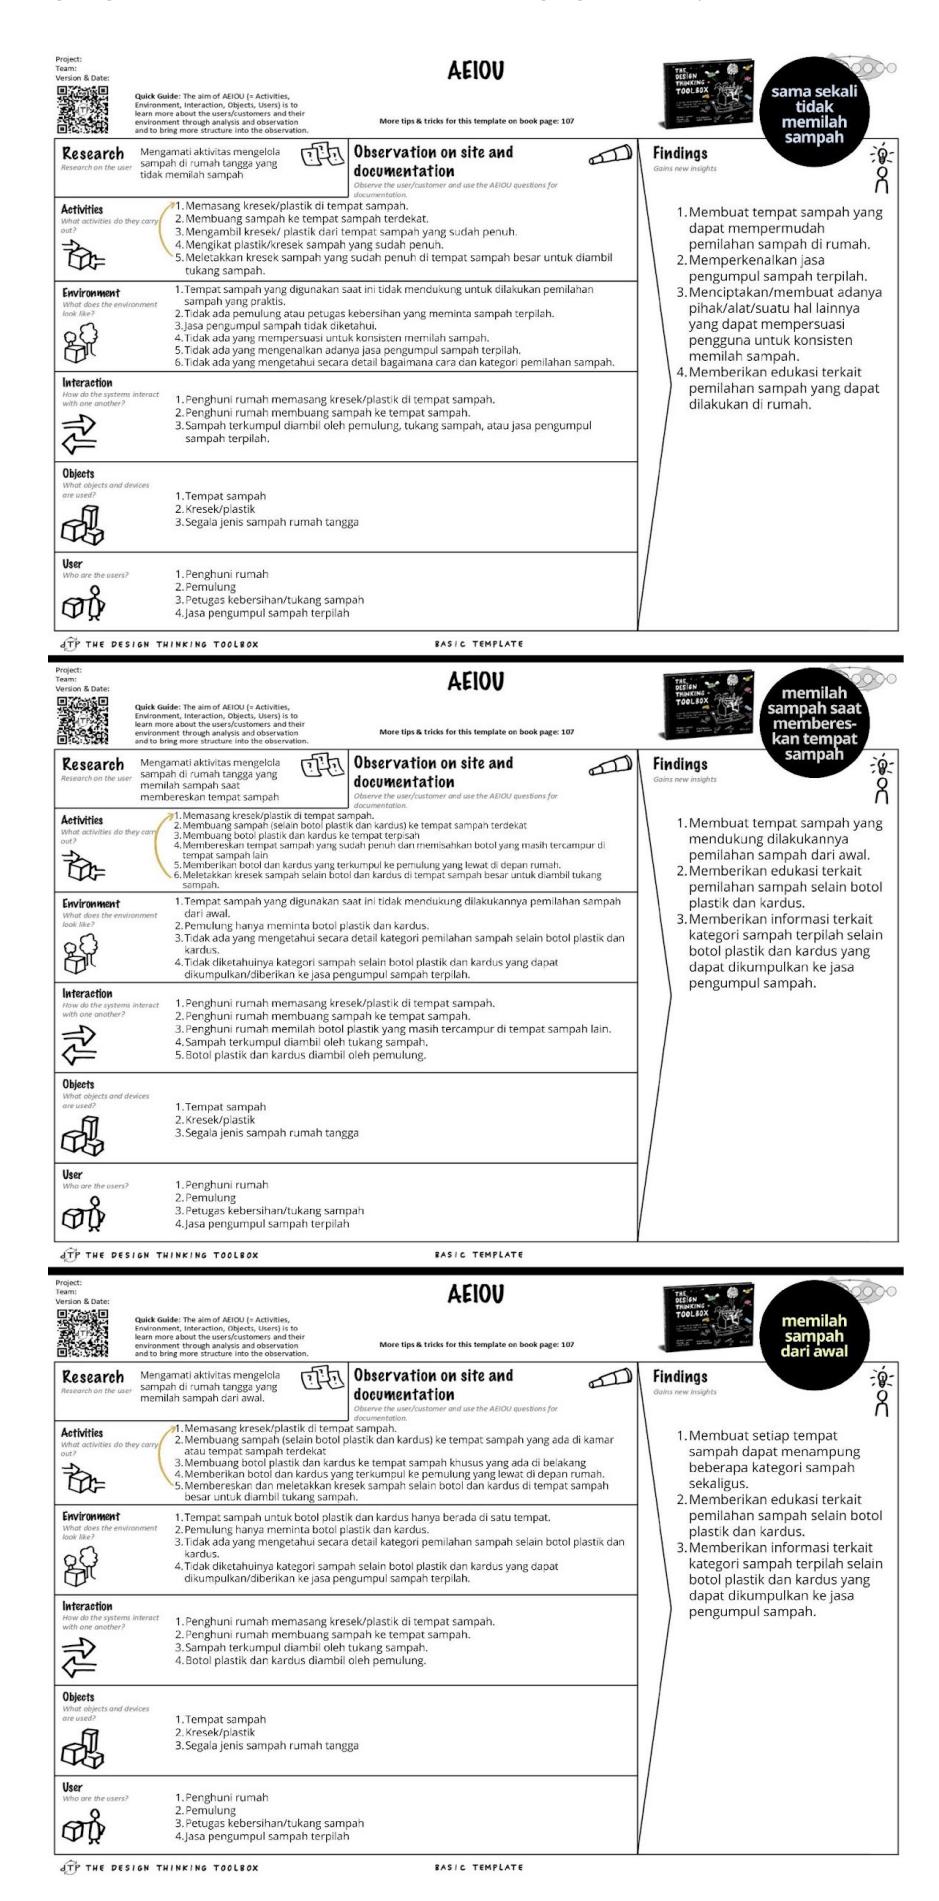
Figure 4 AEIOU
Define Point of View
After conducting interviews and observing user needs, a summary of the insights obtained becomes an input for determining the researcher's point of view regarding user needs. In formulating perspectives, information from the previous stage was processed using the How Might We Question tool (further referred to as HMW). HMW is used to formulate questions to be used in the ideation stage as tools to carry them out in a way that is appropriate to the target.
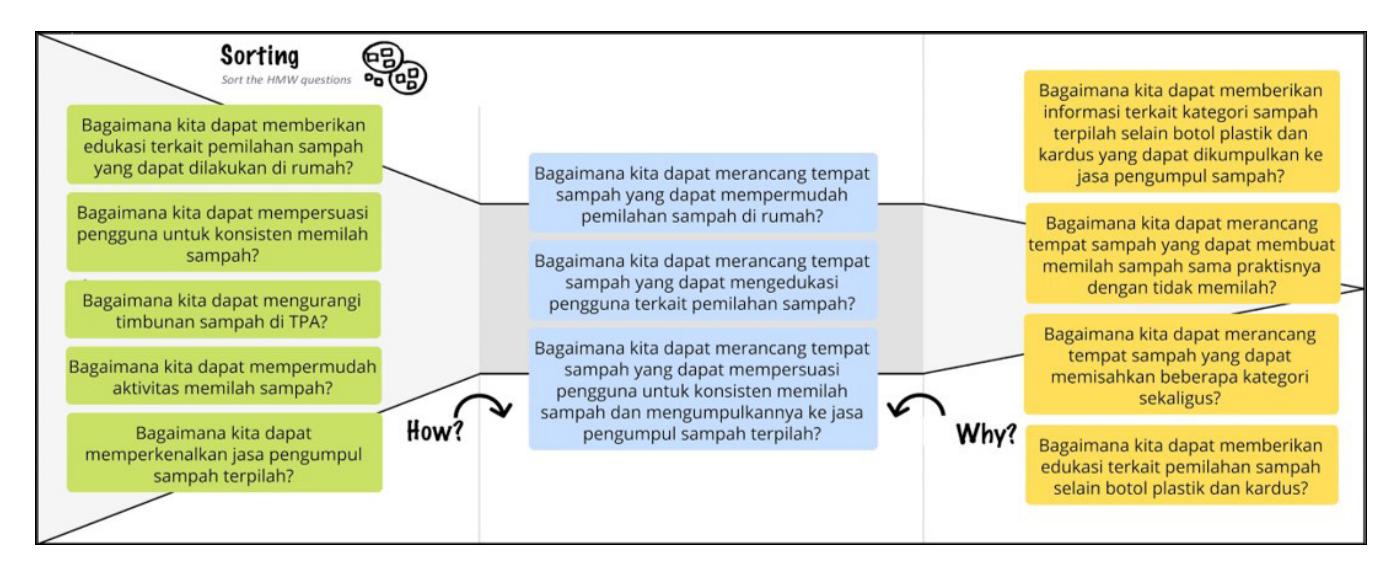
Figure 5 How Might We Question
The formulation of HMW questions (Figure 5) is done by analyzing user needs. Three of all the questions generated fall into the just right category (middle part), and were then used in the ideate stage.
Ideate
In the ideation stage, an idea search was carried out using the brainstorming method. We aimed to generate as many ideas as possible from the ideation process. The number of ideas generated was then grouped using a 2x2 matrix, and the best ideas were selected using the dot voting method.
Brainstorming is an ideation technique that can be done quickly and generate as many ideas as possible, whereas in this technique, quantity is prioritized in finding ideas. In this study, brainstorming was conducted with six participants, and each participant took part in three brainstorming sessions. In each brainstorming session, one formulated How Might We question was asked as a guiding question to initiate the idea-searching process. Table IV depicts the result of the brainstorming sessions for the three "How Might We" questions formulated in this study.
Table IV Brainstorming Results
| Question 1: How can we design a waste bin that can simplify waste sorting at home? | Question 2: How can we design a bin that can educate users about waste sorting? | Question 3: How can we design a bin that can persuade users to sort and collect waste to segregated waste collection services consistently? | |||
|---|---|---|---|---|---|
| No. | Idea | No. | Idea | No. | Idea |
| 1 | Each house provides several waste bins with different colors according to the sorting category. The colors are uniform for everyone in the area to make it easier for cleaning workers. | Each category of waste is given a different color of disposal/ plastic bag, the title of the category, and the types of waste that fall into that category. | 1 | An interactive waste bin where the waste bin interacts with the user through the sound it emits. The sound comes out when it is detected that someone is about to throw away the trash and reminds them to put their trash in the correct category. | |
| 2 | Provide trash bins with different uses according to their location (a trash bin in the kitchen specifically for the disposal of wet waste, a trash bin in the bedroom for the disposal of dry waste, etc.) | 2 | Waste bin with removable sorting category cards. Each card contains the title of the waste sorting category and an image, and a description of what waste is in that category. These cards can be installed in each partition of the waste bin (for example, the user can place two cards in a trash bin that separates two categories or consists of two compartments), and the cards to be installed can be selected or adjusted to the sorting done at the user's home. For example, there is an organic waste card (it has a title and pictures of waste that fall into that category), a plastic bottle waste card, and so on. | 2 | Provide information regarding the location of segregated waste collection services in their trash bins, so users don't have trouble finding them. |
| 3 | A waste bin with several partitions, sensors, or other automation technology can automatically sort the waste thrown into it. | 3 | A waste bin has a sorting sensor, so the user has to scan the garbage they want to dispose of. Then, the system will ask what kind of waste they want to dispose of and which category they want to dispose of. | 3 | The waste bin is equipped with a QR code connected directly to an application or website that can provide information on the location of the garbage collector or an application link that can collect segregated waste. |
| 4 | Each waste bin is equipped with a limited number of partitions (not too many) that separate several categories of waste. | 4 | Waste bin with a poster attached to the front of the bin with a picture of the types of waste that must be disposed of inside. | 4 | When the waste bin is almost full, there can be a display of praise and an invitation to collect it at a segregated waste collection service. |
| 5 | A waste bin with sensors that detect the correct category for the waste you want to enter automatically rotates to open the trash bin for that category. | 5 | Trash bins are equipped with written descriptions of the categories of waste that are sorted with different colors of writing so that users can understand the sorting by reading or seeing the color. | 5 | A waste bin that can change color (using a light) when trash enters it, and when one of the partitions is full, the color of the light from the partition will turn off to remind the user to collect waste from the partition or clean up the waste bin from the partition. |
| 6 | One trash bin is arranged upward, and each level is used to dispose of a different waste category. | 6 | Waste bins have digital screens to attract users to see what information is in the waste bins, whereas on the digital screens, there are visualizations or videos regarding waste sorting education. | 6 | If there is trash being disposed of, there may be a voice saying "nice work" so that users (especially children) are interested and want to dispose of waste properly (according to the sorting category). |
|---|---|---|---|---|---|
| 7 | Designing an automatic waste detector using several automation technologies, such as a proximity sensor, will help the mechanism detect metal and non-metallic types of waste. | 7 | Garbage bins have several compartments equipped with sensors for detecting humans and waste to dispose of. Every time the user wants to dispose of trash, the trash bin will detect the trash below and the bulkhead lid of the appropriate trash category will open automatically. When the lid is open, the user can see a description of the category of waste in the partition inside the lid. | 7 | A waste bin that can be connected to an application on a smartphone. When the waste bin is full, there will be a notification or reminder on the user's smartphone to clean up and collect the trash. |
| 8 | Provide several trash bins with unique decorations, according to the category of waste disposed of in them. | 8 | A transparent waste bin that allows the user to see several partitions or levels that separate the type of waste that is sorted in it and see the category of waste from each of these partitions from the waste that is already in it. | 8 | Providing persuasive stickers on waste bins that invite household members to sort their waste, for example, "Go get a reward or point by sorting every category of trash! Scan a QR code here," which is accompanied by a QR code for the segregated waste collection application. |
| 9 | One trash bin for one use, so in each trash area there are many trash bins according to the number of categories of waste to be sorted. | 9 | Waste bin with a waste category card attached to the cover of the waste bin. | 9 | Create a waste bin that is connected directly to the application, in which this application can collect segregated waste from homes when it receives notifications that the house has collected some trash. |
| 10 | Each waste bin consists of several boxes equipped with adjustable dividers (each waste bin separates 2-4 categories), so that the amount of sorting can be adjusted by the user or household and adjusted according to what waste can be handed over to the waste bank or segregated waste collectors that are in the area of the house. | 10 | Each partition has one pointer symbol on the waste bin's body, describing the type of waste that enters the partition. | 10 | A waste bin that automatically sorts waste without requiring the user to think doesn't make users lazy by making them less motivated to sort waste. |
| 11 | Waste bin with a cylindrical shape, and inside there is a partition that separates several categories of waste with a lid that can be rotated to put waste into the partition from the appropriate waste category. | 11 | Waste bins with shapes according to the waste category are meant to make it easier to understand the category of waste. For example, in the plastic bottle category, the outer shape of the waste bin resembles a bottle. | 11 | There are waste bins with displays on each partition. Each partition's display contains emoticons. When the bin is still empty, the emoticon that appears is a sad face with a dialog box that reads "I'm hungry," and when it is full, the emoticon changes to a smiley face with the words "Come on, collect my stomach contents!" |
|---|---|---|---|---|---|
| 12 | A waste bin that can cut the plastic or plastic waste used so that the size is just right. | 12 | Transparent trash bins equipped with garbage category symbols or writing on each partition. When the trash bin is still empty, the user can see the trash category from the symbols or writing in the waste bin. When it is filled, the user can sort it out easier by looking at the contents of each partition of the waste bin. | 12 | Post information on trash bins regarding the waste that can be collected and the benefits to the environment so that people are motivated to contribute by sorting and collecting waste. |
| 13 | Waste bins with lids (such as those opened by pressing the pedal) equipped with a button or sensor that can automatically open the lid according to the type of waste to be disposed of. | 13 | The waste bin is made to interact when given trash, for example by saying "thank you," thus giving the impression of a pet being fed. | ||
| 14 | Make provisions that everyone who uses the waste collection application and distributes waste with the help of the application is given an attractive point or voucher. | ||||
| 15 | Each housing complex is provided with a temporary disposal site that holds several categories of waste separately, and the local residents are informed that the waste from the temporary disposal site is sent to a waste collection service so that residents know and believe that their efforts to sort waste are not in vain (and do end up mixed and ending up in landfills). |
It was necessary to categorize and select the best ideas from the generated ideas. The categorization of ideas was done using a 2x2 matrix, and selecting the best ideas was done using dot voting. Categorizing ideas using a 2x2 matrix was done to prioritize ideas generated from brainstorming according to the attributes selected and used on each axis. As it is shown in Figure 6, in the 2x2 matrix for HMW 1, the feasible and durable attributes were used on the x-axis and the impact attribute on the y-axis. Then in the 2x2 matrix for HMW 2 and HMW 3, the feasible attribute was used on the x-axis and the impact attribute on the y-axis.
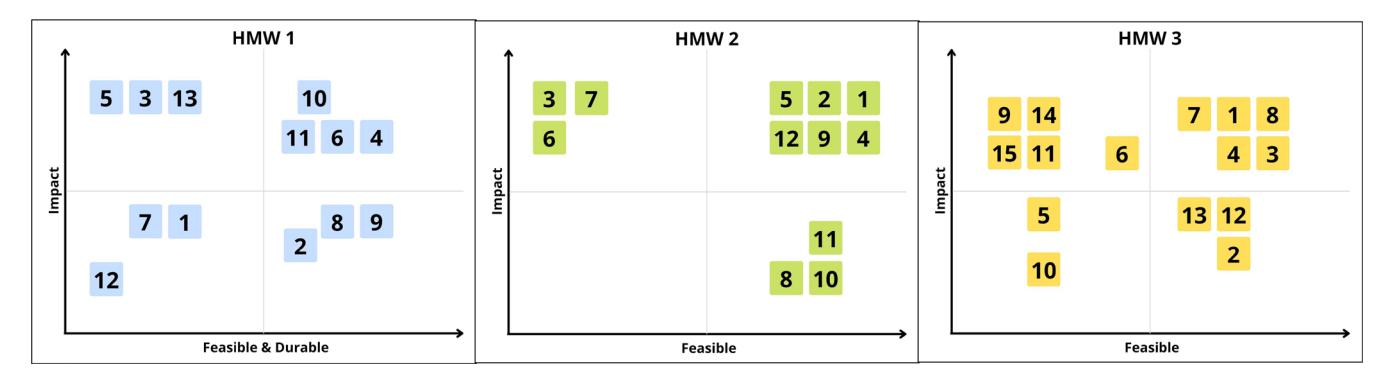
Figure 6 2x2 Matrix
In the categorization of ideas for HMW 1, ideas 4, 6, 10, and 11 were included in the upper right quadrant because they are possible to design, easy to maintain, and have a great impact on sorting large waste. Therefore, the four ideas were prioritized when select them using dot voting. In the categorization of ideas for HMW 2, six ideas fell into the upper right quadrant, namely ideas 1, 2, 4, 5, 9, and 12. This means that the six ideas are possible, make sense to be designed in real terms, and will have a big impact on educating users. Seeing the results of this categorization, the six ideas that enter the upper right quadrant become prioritized ideas for dot voting selection. Finally, in the categorization of ideas for HMW 3, five ideas were included in the upper right quadrant: ideas 1, 3, 4, 7 and 8. These five ideas mean that it is possible to be designed in real terms and have a significant impact on persuading users. The five ideas in the upper right quadrant become prioritized ideas and then enter the dot voting.
| Table V Dot Voting Results |
|---|
| HMW 1 | ||||||||
|---|---|---|---|---|---|---|---|---|
| Idea | 1 | 2 | 3 | 4 | 5 | 6 | Total votes | |
| 4 | 1 | 0 | 0 | 0 | 0 | 0 | 1 | |
| 6 | 1 | 1 | 0 | 1 | 0 | 1 | 4 | |
| 10 | 1 | 2 | 2 | 2 | 2 | 0 | 9 | |
| 11 | 0 | 0 | 1 | 0 | 1 | 2 | 4 | |
| HMW 2 | |||||||||
|---|---|---|---|---|---|---|---|---|---|
| Idea | 1 | 2 | 3 | 4 | 5 | 6 | Total votes | ||
| 1 | 1 | 1 | 1 | 0 | 2 | 1 | 6 | ||
| 2 | 2 | 2 | 1 | 2 | 1 | 0 | 8 | ||
| 4 | 0 | 0 | 0 | 0 | 0 | 1 | 1 | ||
| 5 | 0 | 0 | 0 | 0 | 0 | 1 | 1 | ||
| 9 | 0 | 0 | 0 | 0 | 0 | 0 | 0 | ||
| 12 | 0 | 0 | 1 | 1 | 0 | 0 | 2 | ||
| HMW 3 | |||||||
|---|---|---|---|---|---|---|---|
| Idea | 1 | 2 | 3 | 4 | 5 | 6 | Total votes |
| 1 | 1 | 1 | 1 | 0 | 1 | 1 | 5 |
| 3 | 1 | 2 | 1 | 2 | 1 | 0 | 7 |
| 4 | 0 | 0 | 0 | 0 | 1 | 1 | 2 |
| 7 | 1 | 0 | 0 | 1 | 0 | 0 | 2 |
| 8 | 0 | 0 | 1 | 0 | 0 | 1 | 2 |
Based on the dot voting results for ideas from HMW 1, idea 10 got the most votes and became the chosen idea. Then, based on the results of the dot voting for ideas from HMW 2, idea 2 got the most votes and became the chosen idea. Finally, based on the results of the dot voting for ideas from HMW 3, ideas 3 and 1 received the most votes and were the selected ideas. In HMW 3, there were two ideas chosen because idea 3 related more to persuasion to collect waste through collection services and idea 1 related more to persuasion to sort waste consistently.
Prototype
The next stage is the process of designing prototypes from the ideas that have been selected. The design of this prototype relates to the testing stage. The four ideas selected at the ideation stage are combined into the ones that have been selected. The design of this prototype relates to the testing stage. The four ideas selected from the ideation stage are combined into one. The prototype was designed based on the combined results of the four ideas. is a waste bin that consists of several boxes and is equipped with an adjustable divider. On each lid of the waste bin, there is a clear container for installing a waste sorting card according to the waste category that the user wants to sort. The waste bin also contains a QR code to show the waste collector's location and a link to an application or website to collect segregated waste. Every time the user wants to dispose waste, the trash will make a sound saying, "Enter according to the category, OK?" to remind users to sort waste properly.
Figure 7 depicts the low-fidelity prototype of the designed waste bin, which was further developed into the high-fidelity prototype. A high-fidelity prototype was designed to make it easier for users to understand the ideas being developed and to get a more authentic experience of the ideas being developed so that users can provide more explicit feedback and avoid misunderstanding. The high-fidelity prototype, as shown in Figure 6, was designed using several materials, namely impraboard to make boxes and waste bin lids, Velcro adhesive to connect between boxes, PVC mica plastic for sorting card containers on waste bin lids, art paper for sorting cards, and sticker paper for QR-codes.
Figure 7 Low-Fidelity Prototype
The mechanism for using the waste bin consists of five steps, as shown in Figure 8, as follows:
- 1. Determine the combination of use and placement of waste bins. The user can specify whether to place each box separately, two boxes of the same size in one place, two boxes of different sizes in one place, or all four boxes in one place.
- 2. Determine the sorting category to be carried out and place the sorting card on the lid of the waste bin. Each bin box can be installed with 1-2 sorting cards.
- 3. Install a partition on the waste bin used to store two categories of waste and attach a disposal bag to each box.
- 4. Dispose of waste according to the sorting card installed on the lid of the waste bin. When the user is about to dispose of waste and the user's hand is detected above the waste bin, it will say, "Please enter according to the category, OK?" as a reminder for users to dispose of waste according to a predetermined sorting category.
- 5. Clean up the trash and collect it at the segregated waste collection service or waste manager. To make it easier for users to do this, users can scan the QR code on the waste bin to view information related to data and maps of the distribution of waste management facilities and a list of waste collection applications.
Figure 8 High-Fidelity Prototype
Figure 9 displays the user interface that appears on the user's smartphone when users scan the QR code (the first sub-figure). The second and third sub-figures show the first display after the QR code has been successfully scanned, namely the link tree, which contains links related to data, a map of the distribution of waste management facilities, and a list of waste collection applications (https://linktr.ee/ ayokumpulsampah). Then the following sub-figures (i.e., the fourth sub-figure and so on) show the map of the distribution of these facilities, initially in small scale, which can be enlarged so that it looks like in the last sub-figure on the right. For example, when a user lives in Jalan Setiaki, Yogyakarta, he or she can zoom in on the distribution map so that the part or area of his or her home can be seen more clearly. When the map is enlarged enough, the user can see that near his or her home there is a garbage bank (circled in red in the far-right sub-figure).
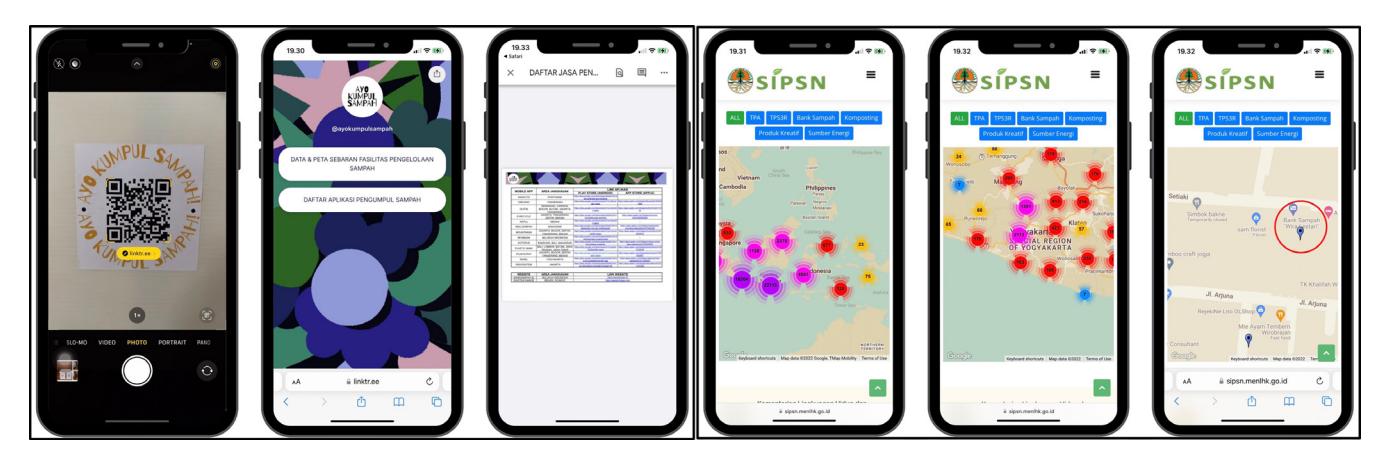
Figure 9 User Interface of Ayo Kumpul Sampah
Test
In the testing phase, prototype testing was carried out with ten users involved from the early stages of design thinking. The prototype tested was a high-fidelity prototype. We received feedback from users regarding the waste bin design after conducting the testing. The feedback obtained was then mapped into the feedback capture grid. In the feedback capture grid, the feedback is separated into four categories: feedback in the form of positive responses, hopes for improvement or development, questions, and new ideas that arise. Figure 10 displays the test results mapped onto the feedback capture grid. From the mapping results, users provide various positive responses, hopes for improvement, several questions for the design that is displayed, and new ideas that emerge. Of all the test results, the most important thing to pay attention to is the opinion of users who want to use this waste bin to sort waste. For these users, the features of this waste bin attract them to sort waste because they feel that the existing features can overcome problems in managing waste and make it easier for them to start sorting waste. In addition, to collect feedback from users and map it on the feedback capture grid, the persuasive level of waste bins was also assessed using the Perceived Persuasiveness Questionnaire (PPQ) (Thomas et al., 2019). Given that one of the user's needs is persuasion, measuring the level of persuasiveness of the designed bin is important to ensure that the user is persuaded by the design results.
Table VI Perceived Persuasiveness Questionnaire Results
| Factors | Questionnaire Item | Average Scores | Factor Average Scores |
|---|---|---|---|
| This product will cause changes in my behavior. | 6 | ||
| Effectiveness | This product causes me to make some changes in my behavior. | 5.8 | 6 |
| After viewing this product, I will make changes in my attitude. | 6.2 | ||
| This product is accurate. | 6.4 | ||
| Quality | This product is trustworthy. | 5.8 | 6.1 |
| I believe this product is true. | 6.1 | ||
| This product has the potential to change user behavior. | 6.4 | ||
| Capability | This product has the potential to influence user behavior. | 6.2 | 6.4 |
| This product has the potential to inspire users. | 6.6 |
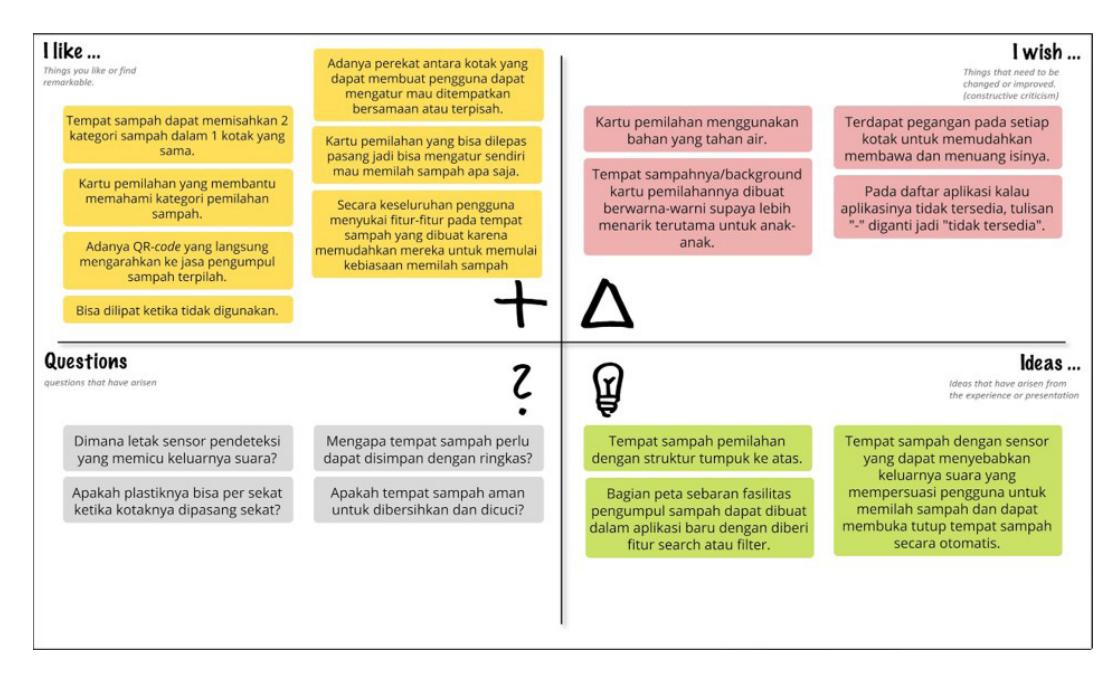
Figure 10 Feedback Capture Grid
Based on the PPG results, as seen in Table VI, it can be concluded that the designed waste bin is a product that can persuade users. This can be seen from the fact that the average score for each factor is equal to or greater than 6, which means that the user agrees with the statement submitted. Based on the test results described above, the next step was to improve the prototype. This improvement was based on user expectations in the upper right quadrant of the feedback capture grid (Figure 11). The first improvement was to improve the sorting card material by laminating the art paper (starting material) so that the sorting cards became water-resistant and easier to clean. Then the second improvement is clarifying the color of the sorting cards by giving color to the card background so that it looks more colorful and attractive to children. Then, a third improvement is adding a handle to each waste bin. This handle is attached to the sides of the waste bin with synthetic rope material. The fourth and final improvement is to replace the description of an application that is not available on one type of smartphone on the list of waste collection applications, which was initially a "-" sign or symbol, with the words "not available; check other applications or websites" so that users understand better and are directed to check other applications or websites that are also available in the area.
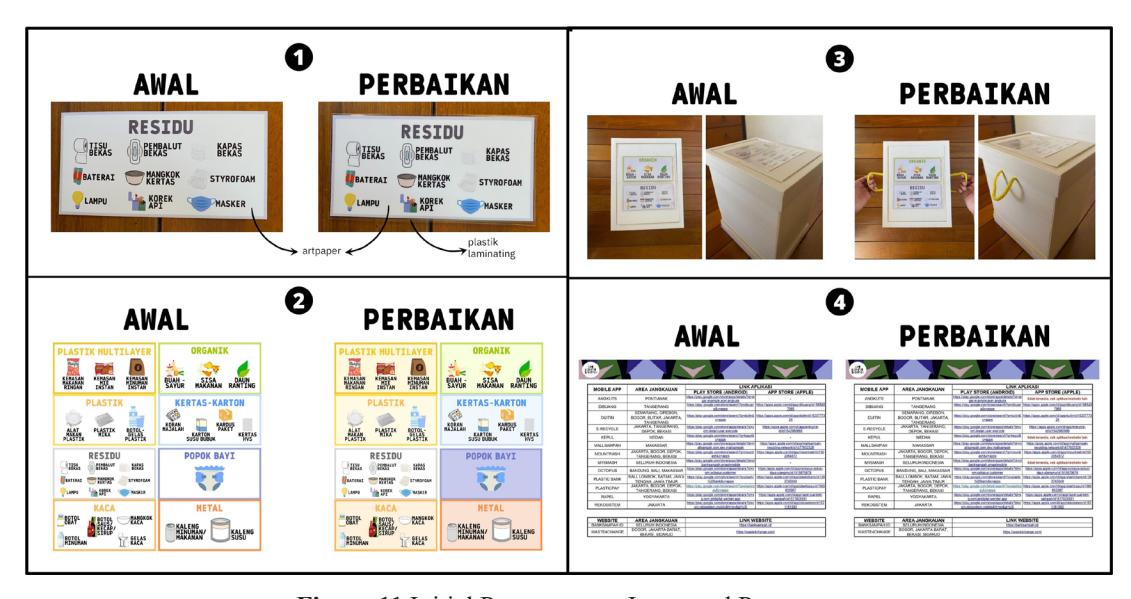
Figure 11 Initial Prototype vs. Improved Prototype
Conclusion
Based on the research results, it can be concluded as follows: First, the criteria for persuasive waste bins that can facilitate waste sorting in the household sector according to household needs are: practical, space-saving, easy to understand and use, can store several categories of waste at once, can be adjusted in size, provide clear information regarding sorting, be able to make the activity of making and sorting waste easy and fun for all occupants of the house, be able to automatically sort waste, and provide clear waste management system information from start to finish (where the sorted waste should be submitted).
Second, the bin is designed to consist of 4 boxes (2 boxes measuring 20 x 20 cm and 2 boxes measuring 20 x 25 cm), which can be separated and joined together with an adhesive on the bottom of the box. A partition can be removed on the inside of the box, so each box can accommodate 1 to 2 categories of waste. On the outside of the box is a QR code connected to the link tree, which shows the location of the segregated waste collection service and a link to an application or website that can collect or receive segregated waste. Each box has a lid that can be removed from the box, and when you want to dispose of waste, the top of the lid can be opened by pushing it. There is also a sorting card on the lid that can be removed. There are 8 sorting cards provided for sorting different waste categories: multilayer plastic waste, plastic, residue, glass, organic, paper-cardboard, baby diapers, and metal. Every time the user wants to dispose of waste, the bin will say, "Enter according to the category, OK?" to remind users to sort waste properly.
Finally, the waste bin design was evaluated by testing the prototype and using the Perceived Persuasiveness Questionnaire (PPQ). The test was carried out by showing a video explaining the shape of the trash can and the mechanism for its use. Based on the test results, several feedbacks were mapped to the feedback capture grid, which showed that the users already liked all parts of the waste bin, but it is still hoped that the prototype would be further improved. The PPQ results illustrated that the designed waste bin scored 6, 6.1, and 6.4 for effectiveness, quality, and capability. Thus, it can be concluded that the designed waste bin is a persuasive product. Based on the results of testing and PPQ for assessment, several improvements were made to the prototype, namely using water-resistant materials for the sorting cards, giving color to the sorting card background, adding handles to each box, and replacing the "-" sign with the words "not available, check other applications or websites" in the list of applications that are not available on certain smartphones.
References
Cabinet Secretariat of the Republic of Indonesia. (2021, 23 Januari). Hasil Sensus Penduduk 2020; BPS: Meski Lambat, Ada Pergeseran Penduduk Antar Pulau.
Department of Environment and Forestry Special Region of Yogyakarta. (2019, 5 November). Pengelolaan Sampah Rumah Tangga.
Fogg, B.J. (2003). Persuasive Technology Using Computer to Change What We Think and Do. San Francisco: Morgan Kaufmann Publishers.
Katadata.co.id. (2020, 9 March). Kesadaran Warga Memilah Sampah Masih Rendah.
Lewrick, M., Link, P., & Leifer, L. (2018). The Design Thinking Playbook. New Jersey: John Wiley & Sons, Inc.
Lewrick, M., Link, P., & Leifer, L. (2020). The Design Thinking Toolbox. New Jersey: John Wiley & Sons, Inc.
Ministry of Industry of the Republic of Indonesia. (2021, 30 Juni). Menperin Resmika Pabrik Daur Ulang Plastik Terbesar di Indonesia.
Republic Indonesia. Indonesian Law Number 18 of 2008, Waste Management.
Rismayanti, T., & Asmarani, O. (2021, 30 Maret). Mencari Akar dan Solusi Masalah Sampah.
Thomas, R.J., Masthoff, J., & Oren, N. (2019). Can I Influence You? Development of a Scale to Measure Perceived Persuasiveness and Two Studies Showing the Use of the Scale. Frontiers in Artificial Intelligence Journal, 2, 1-14. doi: 10.3389/frai.2019.00024.