
Keywords:
e-learning, extracurricular education, technology acceptance model, young student
The prolonged period of the COVID-19 pandemic has unintentionally promoted a promising future for the e-learning industry. However, few studies have evaluated the acceptance of e-learning in non-school education, especially for young students. Using a modified technology acceptance model (TAM) as a theoretical framework, this case study investigates the influencing factors to determine the e-learning acceptance of young students in extracurricular education. The model was validated by empirical data collected from a mathematics tutoring center in Indonesia for primary and secondary students. While the literature suggests that young students tend to hold enjoyment as the most critical determinant toward their e-learning acceptance, this study shows the contrary result for extracurricular education, in which perceived usefulness becomes the most determining factor. The study also shows a substantial influence of subjective norms and system characteristics on students' intentions to adopt or reject e-learning.
INFO ARTIKEL
ABSTRAK
Kata kunci:
e-learning, murid usia muda, pendidikan ekstrakurikular, technology acceptance model
Pandemi COVID-19 yang berkepanjangan secara tidak sengaja turut mendukung masa depan cerah bagi industri e-learning. Namun, belum banyak penelitian yang mengevaluasi penerimaan e-learning pada pendidikan nonsekolah, terutama untuk siswa usia muda. Penelitian ini menggunakan modifikasi technology acceptance model (TAM) sebagai kerangka teori. Penelitian studi kasus ini menyelidiki faktor-faktor yang memengaruhi penerimaan e-learning oleh siswa usia muda pada pendidikan ekstrakurikular. Model tersebut divalidasi menggunakan data empiris yang diperoleh dari sebuah pusat bimbingan belajar matematika di Indonesia untuk siswa sekolah dasar dan menengah. Jika literatur menunjukkan siswa usia muda cenderung menganggap kesenangan sebagai penentu utama dalam penerimaan e-learning mereka, penelitian ini menunjukkan hasil yang bertentangan untuk pendidikan ekstrakurikular. Sebaliknya, persepsi manfaat menjadi faktor penentu utama. Penelitian ini juga menunjukkan pengaruh penting norma subjektif dan karakteristik sistem terhadap niat siswa untuk mengadopsi atau menolak sistem e-learning.
Introduction
In early 2020, the COVID-19 pandemic forced schools to close in most parts of the world. This made electronic learning (e-learning) the most feasible solution to ensure learning continuity. E-learning is a method of teaching and learning that fully or partially uses electronic media and devices to enhance the availability of training, communication, and interaction (Salloum et al., 2019). Typically, it is used to deliver a course of study to remote learners (Arkorful & Abaidoo, 2015). Accessibility, flexibility, and affordability are among the top areas where technology can boost students' learning experiences by removing space and time barriers, hence liberating access to high-quality education (Dhawan, 2020; Al Rawashdeh et al., 2021). The education institutions will continue to involve e-learning after the end of the pandemic, in which digital platforms support in-person classroom teaching (Lockee, 2021). Looking at the promising future of e-learning, it becomes crucial to investigate and identify the influencing factors of e-learning acceptance to ensure an effective learning process.
Several studies agree that the Technology Acceptance Model (TAM) by Davis (1989) is the leading theory to study technology acceptance in the e-learning context (Abdullah & Ward, 2016; Al Kurdi et al., 2020; Weerasinghe & Hindagolla, 2017). It consists of four primary constructs, i.e., perceived ease of use (PEOU), perceived usefulness (PU), attitude toward using (ATT), and behavioral intention (BI). PEOU is defined as the users' perception that uses a specific technology (i.e., e-learning), so it will not be complicated (Salloum et al., 2019). In TAM, it is assumed that users are likely to form a positive attitude if they can use technology effortlessly, and the ease will enhance its perceived usefulness. Following the original TAM relationship, PEOU is a direct antecedent of PU and ATT in terms of system usage. Next, PU is defined as how users believe using the recent technology will improve their performances (Salloum et al., 2019). In the context of e-learning, PU is interpreted as the perceived learning improvement when students believe that they can get it when using the e-learning system (Pratama, 2021). Based on previous studies, it has been proven that the more e-learning is perceived as useful by the users, the higher chance of a positive ATT and BI they will get (Salloum et al., 2019). ATT is defined as the degree of users' positive or negative feelings toward technology (Salloum et al., 2019). The last component is to use the technology, which is reflected in the BI as the user's intent to employ an e-learning system in their learning activities (Salloum et al., 2019). The relation between ATT and BI has also been proven in e-learning adoption research (Alsharida et al., 2021; Granić & Marangunić, 2019; Salloum et al., 2019).
Salloum et al. (2019) reported the three most common system characteristics that serve as the external factors within the e-learning provider's control: system quality (SQ), content quality (CQ), and information quality (IQ). SQ is found to positively impact both PU and PEOU of the e-learning system (Salloum et al., 2019). CQ is defined as the depth, quality, and frequency of content updates (Liu et al., 2010), and it is positively correlated with both PU and PEOU, showing its role in e-learning adoption (Salloum et al., 2019). Lastly, IQ, is defined as how well the user receives the information in terms of completeness, precision, and timeliness (Liu et al., 2010), which positively affects IQ on PU and PEOU (Salloum et al., 2019).
Furthermore, Pratama (2021) concluded that perceived enjoyment (PE), subjective norm (SN), perceived mobile value (PMV), and facilitating conditions (FC) play essential roles in younger students' attitudes (ATT) toward e-learning. Among them, perceived enjoyment significantly influences the user's attitude (Pratama, 2021) toward using an e-learning system, even if it is more important than perceived usefulness, whereas a more enjoyable and fun-to-use system will lead to higher chances of adoption. Pratama also discovered a positive relationship between PE and PEOU. This finding revealed the irrationality of young students, where the playfulness of an e-learning system is more influential than its usefulness, which is the most common top driver of user acceptance, as it is shown in the literature. The last external factor, the FC, is defined as the users' belief that some organizational or technical infrastructure exists to support the system (Pratama, 2021), and it could determine ATT and behavioral intentions (BI).
Aside from the system characteristics as the external factors, studies by Salloum et al. (2019) and Alsharida et al. (2021) conclude that Perceived Mobile Value (PMV), Computer Self Efficacy (CSE), and Subjective Norms (SN) are the most common individual factors influencing PU and PEOU of an e-learning system. PMV is defined as users' awareness of mobility value in that students can learn flexibly anywhere, anytime, and they could do it without being attached to a specific location. Previous research has shown that PMV significantly impacts PU (Pratama, 2021). Next, CSE is defined as users' confidence in their capacity to deal with a situation related to a computer system, including the ability to use the e-learning system (Sánchez & Hueros, 2010). Past research showed that CSE is a significant determinant of PU and PEOU (Alsharida et al., 2021; Granić & Marangunić, 2019; Salloum et al., 2019). Lastly, SN is the perceived social pressure that influences an individual to carry out or avoid a behavior (Salloum et al., 2019). The most commonly used determinants are PU and PEOU (Grani & Maranguni, 2019; Salloum et al., 2019), which have a positive impact on PE (Pratama, 2021) as a critical determinant of technology acceptance for younger audiences.
Despite that, a systematic literature review from Granić & Marangunić (2019) reveals that most research that has been conducted has not addressed the variety of learning domains and user demographics. Based on 71 relevant studies between 2003 and 2018, most researchers (83%) tend to choose university students as their study subjects, compared to other 17% ranging from high school students, faculty members, teachers, and employees. Newer research (e.g., Al Kurdi et al., 2020; Hussein, 2017; Salloum et al., 2019) also confirms the gaps in studies as it is shown to use adult learners in universities as their study subjects. It implies that the acceptance literature for e-learning for young students, who tend to have different characteristics than mature learners, is still limited. Hence, it fails to identify the distinctive factors that influence e-learning acceptance specifically for adolescent learners. Furthermore, Grani and Maranguni (2019) discovered a lack of research outside of traditional formal education settings such as university or school. The different characteristics of school and extracurricular education, such as tuition centers, might also yield distinctive characteristics that are interesting to explore. In order to fill that gap, this study aims to evaluate the factors affecting the e-learning acceptance of young students in extracurricular education using a modified version of Davis's Technology Acceptance Model. Thus, the finding of this study would help extracurricular education providers to design a decent e-learning system, mainly if they serve pre-teenager students, to achieve higher adoption rates.
Method
To answer the research question described above, a quantitative case study research (Yin, 2018) using a survey method was done on Math Center Rejosari (MCR), an extracurricular mathematics education provider located in Semarang, Central Java, Indonesia, with students ranging from 9 to 15 years old, as the unit of analysis and bounded system of interest as necessarily required in a case study (Stake, 1995). The survey result was used to test and validate the research construct (see Figure 1) consisting of the TAM basic model with the addition of the eight most common external factors identified in the literature (Alsharida et al., 2021; Salloum et al., 2019).
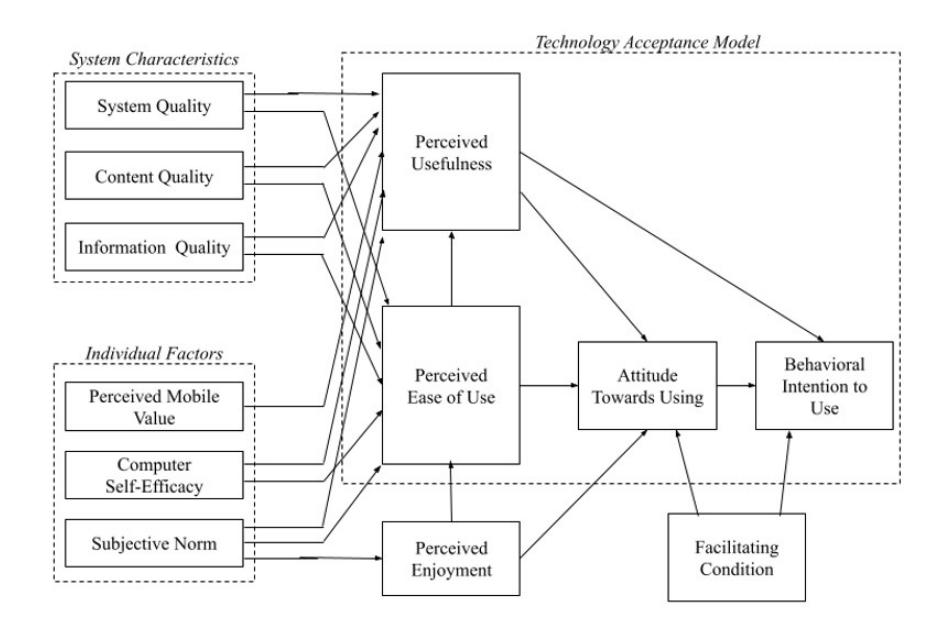
Figure 1 Research Construct: Relation between TAM and additional external factors
The factors are divided into system characteristics: system quality (SQ), content quality (CQ), information quality (IQ), and individual factors: perceived mobile value (PMV), computer self-efficacy (CSE), and subjective norm (SN). Moreover, two additional factors that directly influence attitude and intentions based on Pratama (2021)—perceived enjoyment (PE) and facilitating condition (FC)—are also included.
To analyze the data, the authors employed the Partial Least Squares-Structural Equation Model (PLS-SEM) approach using SmartPLS 3.3.9 due to its ability to analyze the relationship between several constructs simultaneously from a complex model (many constructs and many indicators), with a small sample size requirement from non-normally distributed data (Hair et al., 2017). As the model's constructs are latent variables, a set of indicators and items was made to infer the value of each construct. A total of 31 items were selected to measure the 12 construct items in the model adopted from previous research to ensure validity. Each item was measured using a five-point Likert scale where 1 represents "strongly disagree," and 5 represents "strongly agree." The Cohen minimum R-squared method determines the minimum sample size for PLS-SEM analysis. It considers three elements: the maximum number of arrows pointing at a latent variable (or the construct) in the model (i.e., seven), the significance level used (\alpha=0.05), and the minimum result of the model. Because the minimum result was still unknown prior to the studies, the research worked in an iterative way where additional samples were collected until the minimum result satisfied the required value.
Result and Discussion
The data collection was concluded after a total of 57 samples had been collected, fulfilling the minimum sample size based on Cohen's minimum method. The analysis followed the steps of PLS-SEM analysis based on Al-Emran et al. (2019). There are two main components to be evaluated: the measurement model and the structural model. The former model was evaluated to assess the validity and reliability of each item in describing their constructs, and the later model was evaluated to measure the model's predictive capabilities and the relationships between the constructs.
Measurement Model Evaluation
Table I Convergent Validity Results
| Constructs | Items | Outer Loadings | CR | AVE | Constructs | Items | Outer Loadings | CR | AVI |
|---|---|---|---|---|---|---|---|---|---|
| System Quality (SQ) | SQ1 SQ2 SQ3 | 0.908 0.866 0.904 | 0.916 | 0.785 | Perceived Enjoyment (PE) | PE1 PE2 PE3 | 0.930 0.824 0.750 | 0.862 | 0.67 |
| Content Quality (CQ) | CQ1 CQ2 | 0.719 0.905 | 0.749 | 0.604 | Facilitating Condition (FC) | FC1 FC2 | 0.709 0.730 | 0.785 | 0.65 |
| Information Quality (IQ) | IQ1 IQ2 | 0.845 0.832 | 0.791 | 0.655 | Perceived Ease of Use (PEOU) | 0.953 0.949 | 0.919 | 0.85 | |
| Perceived Mobile Value (PMV) | PMV1 PMV2 | 0.875 0.752 | 0.706 | 0.546 | Perceived Usefulness (PU) | PU1 PU2 PU3 | 0.881 0.814 0.895 | 0.883 | 0.71 |
| Computer Self Efficacy (CSE) | CSE1 CSE2 CSE3 | 0.748 0.801 0.855 | 0.831 | 0.621 | Attitude Towards Using (ATT) | ATT1 ATT2 ATT3 | 0.761 0.839 0.907 | 0.830 | 0.62 |
| Subjective Norm (SN) | SN1 SN2 SN3 | 0.919 0.850 0.951 | 0.897 | 0.745 | Behavioral Intention to Use (BI) | BI1 BI2 BI3 | 0.701 0.880 0.768 | 0.814 | 0.59 |
Source: data analysis
The measurement model is assessed by confirming convergent and discriminant validity (Al-Emran et al., 2019). Convergent validity is "the extent to which a measure correlates positively with alternative measures of the same construct" (Hair et al., 2017: 137). According to Hair et al. (2017: 137-138), the convergent validity of a model is confirmed if the outer loadings and the composite reliability (CR) values are equal to or greater than 0.7, while the average variance extracted (AVE) values should be 0.50 or above. The convergent validity of the measurement model has been confirmed as each measure satisfies the recommended value (see Table I).
Table II Fornell-Larcker Scale
| ATT | BI | CQ | CSE | FC | IQ | PE | PEOU | PMV | PU | SN | SQ | |
|---|---|---|---|---|---|---|---|---|---|---|---|---|
| ATT | 0.838 | |||||||||||
| BI | 0.679 | 0.786 | ||||||||||
| CQ | 0.533 | 0.609 | 0.738 | |||||||||
| CSE | 0.701 | 0.537 | 0.427 | 0.802 | ||||||||
| FC | 0.239 | 0.326 | 0.254 | 0.481 | 0.537 | |||||||
| IQ | 0.415 | 0.425 | 0.522 | 0.426 | 0.338 | 0.839 | ||||||
| PE | 0.812 | 0.411 | 0.370 | 0.672 | 0.235 | 0.274 | 0.872 | |||||
| PEOU | 0.822 | 0.654 | 0.533 | 0.788 | 0.246 | 0.434 | 0.809 | 0.951 | ||||
| PMV | 0.648 | 0.406 | 0.380 | 0.353 | 0.046 | 0.363 | 0.633 | 0.656 | 0.816 | |||
| PU | 0.747 | 0.779 | 0.698 | 0.544 | 0.386 | 0.666 | 0.572 | 0.729 | 0.658 | 0.894 | ||
| SN | 0.785 | 0.745 | 0.686 | 0.646 | 0.265 | 0.510 | 0.752 | 0.869 | 0.675 | 0.864 | 0.908 | |
| SQ | 0.796 | 0.597 | 0.528 | 0.747 | 0.257 | 0.344 | 0.801 | 0.892 | 0.529 | 0.649 | 0.843 | 0.893 |
Source: data analysis
Next, discriminant validity refers to "the extent to which a construct is truly distinct from other constructs by empirical standards" (Hair et al., 2017: 138). It means that all variables are distinct and represent phenomena that are not captured by the model's other variables. To assess the discriminant validity, the Fornell-Larcker criterion is commonly used. To confirm the discriminant validity of a model, the square root value of AVE of all constructs must be greater than its highest correlation with other constructs. Table II shows that every construct's square root of AVE (diagonal value) surpasses the correlation of latent constructs. To conclude, it is evident that the Fornell-Larcker criterion has been fulfilled, and the discriminant validity of the measurement model is also confirmed.
Structural Model Evaluation
After confirmation of the validity and reliability of the measurement model, the next step is to evaluate the structural model result. In this step, the model's predictive capabilities will be evaluated using the coefficient of determination (\R_square) of the terminal variable, i.e., behavioral intention (BI). Based on the empirical data, a value of 61% is obtained, indicating a moderate predictive power of the proposed model (Hair et al., 2017).
For the last step, the relationships between the constructs will be examined using path analysis by assessing each relation's path coefficient and p-values (Al-Emran et al., 2019). The path coefficient is used to interpret the relationship among the variables. Its value ranged from -1 to +1, where a closer value to +1 indicates a strong positive relationship and vice versa. Typically, the significant level of each relation is assessed using p-values. In this study, α = 0.05, which means that a relationship is considered significant if the p-value is above 0.05. The inter-construct relation testing results of the model show that 12 out of 21 direct paths are significant (see Figure 2).
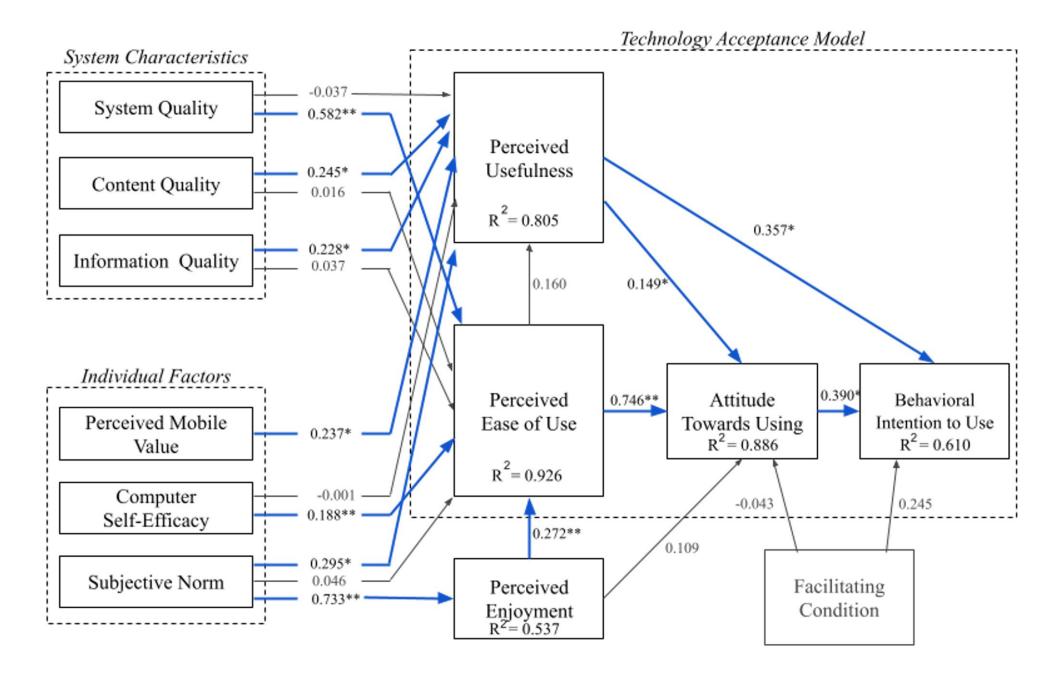
Figure 2 Pat. coefficient results (significant at p** < = 0.01, p* < 0.05)
Table III summarizes all factors' direct, indirect, and total effects on behavioral intention (BI). The direct effect refers to the immediate effect on BI from a direct relationship. Two constructs directly relate to BI, i.e., attitude toward using and perceived usefulness. The indirect relation refers to a construct's influence on BI, but it is mediated by other constructs. For instance, system quality (SQ) indirectly affects the BI, mediated by perceived ease of use and attitude toward using constructs. Here, the effect of the facilitating condition (FC) is not included because there is no significant relation to or from FC based on the previous analysis.
Table III Standardized estimates of all predictors on BI
| Relationship | Direct Effect | Indirect Effect | Total Effect |
|---|---|---|---|
| System Quality → Behavioral Intention | 0.173 | 0.173 | |
| Content Quality → Behavioral Intention | 0.108 | 0.108 | |
| Information Quality → Behavioral Intention | 0.108 | 0.108 | |
| Perceived Mobile Value → Behavioral Intention | 0.099 | 0.099 | |
| Computer Self Efficacy → Behavioral Intention | 0.067 | 0.067 | |
| Subjective Norm → Behavioral Intention | 0.241 | 0.241 | |
| Perceived Enjoyment → Behavioral Intention | 0.140 | 0.140 | |
| Perceived Ease of Use → Behavioral Intention | 0.357 | 0.357 | |
| Perceived Usefulness → Behavioral Intention | 0.357 | 0.058 | 0.415 |
| Attitude toward using → Behavioral Intention | 0.390 | 0.390 |
Source: data analysis
Discussion
Based on the analysis in the previous subsection, the proposed modified TAM model is proven to explain and predict MCR's student acceptance of e-learning with a moderate score of 61%. This study also confirms the significance of every construct in influencing e-learning acceptance except for the facilitating condition (FC). The insignificance relation of facilitating conditions to both students' attitude (ATT) and behavioral intention (BI) is in contrast with the previous findings (Pratama, 2021).
However, Pratama also stated that FC plays a more critical role for students in rural areas than in urban areas. This might explain the insignificance of FC in the study subject's acceptance, as all of the observed students reside in urban areas.
Confirming past literature findings (Salloum et al., 2019), ATT significantly influences BI. However, ATT does not hold the highest total effect on behavioral intention, even though it serves as the mediator for all other predictors in the model. Instead, its overall impact on BI is second only to perceived usefulness (PU). The superiority of PU in influencing BI might be due to the uniqueness of the characteristics of extracurricular education, the subject of this study. Attendance at a traditional school is required. Hence, students will still go even when they do not perceive it as useful. In contrast, extracurricular education is only attended by students (or parents) who believe in its usefulness. Hence, it is understandable that the perceived usefulness (PU) of the e-learning system will be the most significant determinant of their intention to adopt or reject the technology. When students believe the e-learning system can help enhance their study performances and attitudes, their behavioral intentions will improve.
Interestingly, perceived enjoyment (PE) has the lowest effect on BI than other internal motivations (PU, PEOU, ATT). Even though PE still holds a significant positive impact on BI, the impact is far under PU. The direct relationship between PE and ATT is also proven to be insignificant. Despite the contrary results from Pratama (2021) and Lucardie (2014), there are different perceptions of enjoyment among young people of different ages (Dismore & Bailey, 2011; Domville et al., 2019). This explains why in this study PE doesn't hold a significant influence over ATT like in the previous studies.
Moving to external motivation, the result will be discussed through system characteristics and individual factors. The system characteristic demonstrated that system quality (SQ) has a positive effect on PEOU but it doesn't happen on PU. This result was in line with the previous finding from Salloum et al. (2019). However, different results were obtained for information quality (IQ), which significantly impacts the PU but not the PEOU. Another distinction also comes from content quality (CQ), which affects the PU, whereas, in Salloum's studies, there is no significant impact which is detected from CQ. As this research suggests the importance of PU for students in extracurricular education, IQ and CQ will be essential factors to be concerned about due to their impacts on PU. This inference is supported by the total effect of IQ and CQ on BI, which is the highest compared to other external factors.
In terms of individual characteristics, the results showed that perceived mobile value (PMV) and subjective norm (SN) both significantly impact PU positively. These findings suggest that the concept of mobility, i.e., the ability to learn anytime, anywhere, using their gadget, increases their perception of the usefulness of the e-learning system. Aside from its significant positive relation to PU and PE, SN also holds the fourth-highest total effect on the BI after PU, ATT, and PEOU. Pratama (2021) suggests that SN plays an important role, especially in Indonesia, due to its collectivist paradigm, where people enjoy and want to be group members. Hence, students will see the e-learning system as useful and enjoyable if their peers suggest it. Additionally, the role of parents is also vital for young students. Most parents of primary and secondary students take the place of decision-makers for their children education. Hence, if the parents say e-learning is helpful, the kids will believe so.
Although most of the top influential factors of BI are dominated by internal motivation (PU, PEOU, and ATT), the authors want to stress the importance of external motivation, which is more controllable. In this position, the top external factor influencing e-learning acceptance is seen as the subjective norm. Hence, it creates an online community for students and parents to share their e-learning experiences might increase with the adoption of e-learning. In addition, all the system characteristics included in the model show a substantial effect on BI. As controllable factors, e-learning providers should design the e-learning system mindfully.
Conclusion
The modified technology acceptance model proposed in this study has shown an adequate explanatory power where it can explain 61% of the variance of the empirical data. The most prominent findings from this study are how perceived usefulness becomes the top driver for e-learning acceptance among young students in extracurricular education, which contrasts with regular school students who take perceived enjoyment as the most critical factor. Moreover, the study also points out some controllable factors influencing e-learning acceptance, i.e., subjective norms and system characteristics. Therefore, e-learning developers should create an online community and ensure a quality system, while also providing useful content and information. However, this study's limitation lies in the empirical data, which were only collected from a tutoring center focusing on mathematics study in one geographic area. So that, the study may fail to capture the different characteristics that different types of extracurricular education and cultural influence can incur.
References
- Abdullah, F., & Ward, R. (2016). Developing a General Extended Technology Acceptance Model for E-Learning (GETAMEL) by analysing commonly used external factors. Computers in Human Behavior, 56, 238–256. https://doi.org/10.1016/j.chb.2015.11.036.
- Al-Emran, M., Mezhuyev, V., & Kamaludin, A. (2019). PLS-SEM in Information Systems Research: A Comprehensive Methodological Reference. Advances in Intelligent Systems and Computing, 845, 644–653. https://doi.org/10.1007/978-3-319-99010-1_59.
- Al Kurdi, B., Alshurideh, M., & Salloum, S. A. (2020). Investigating a theoretical framework for e-learning technology acceptance. International Journal of Electrical and Computer Engineering (IJECE), 10(6), 6484–6496. https://doi.org/10.11591/ijece.v10i6.pp6484-6496.
- Al Rawashdeh, A. Z., Mohammed, E. Y., Al Arab, A. R., Alara, M., & Al-Rawashdeh, B., (2021). Advantages and disadvantages of using e-Learning in university education: Analyzing students' perspectives. The Electronic Journal of e-Learning, 19(2), 107-117.
- Alsharida, R. A., Hammood, M. M., & Al-Emran, M. (2021). Mobile Learning Adoption: A Systematic Review of the Technology Acceptance Model from 2017 to 2020. International Journal of Emerging Technologies in Learning (IJET), 16(05), 147. https://doi.org/10.3991/ ijet.v16i05.18093.
- Arkorful, V., & Abaidoo, N., (2015). The role of e-learning, advantages, and disadvantages of its adoption in higher education. International Journal of Instructional Technology and Distance Learning, 12(1), 29-42.
- Dismore, H., & Bailey, R. (2011). Fun and enjoyment in physical education: Young People's Attitudes. Research Papers in Education, 26(4), 499-516. doi:10.1080/02671522.2010.484866
- Domville, M., Watson, P. M., Richardson, D., & Graves, L. E. (2019). Children's perceptions of factors that influence pe enjoyment: A qualitative investigation. Physical Education and Sport Pedagogy, 24(3), 207-219. doi:10.1080/17408989.2018.1561836
- Dhawan, S. (2020). Online Learning: A Panacea in the Time of COVID-19 Crisis. Journal of Educational Technology Systems, 49(1), 5–22. https://doi.org/10.1177/0047239520934018.
- Granić, A., & Marangunić, N. (2019). Technology acceptance model in educational context: A systematic literature review. British Journal of Educational Technology, 50(5), 2572–2593. https://doi. org/10.1111/bjet.12864.
- Hair, J., Hollingsworth, C. L., Randolph, A. B., & Chong, A. Y. L. (2017). An updated and expanded assessment of PLS-SEM in information systems research. Industrial Management and Data Systems, 117(3), 442–458. https://doi.org/10.1108/IMDS-04-2016-0130/FULL/ XML.
- Hussein, Z. (2017). Leading to Intention: The Role of Attitude in Relation to Technology Acceptance Model in E-Learning. Procedia Computer Science, 105, 159–164. https://doi.org/ 10.1016/j. procs.2017.01.196.
- Liu, I.-F., Chen, M. C., Sun, Y. S., Wible, D., & Kuo, C.-H. (2010). Extending the TAM model to explore the factors that affect Intention to Use an Online Learning Community. Computers & Education, 54(2), 600–610. https://doi.org/10.1016/j.compedu.2009.09.009.
- Lockee, B. B. (2021). Online education in the post-COVID era. Nature Electronics 2021, 4(1), 5–6. https://doi.org/10.1038/s41928-020-00534-0.
- Lucardie, D. (2014). The impact of fun and enjoyment on adult's learning. Procedia Social and Behavioral Sciences, 142, 439-446. doi:10.1016/j.sbspro.2014.07.696
- Pratama, A. R. (2021). Fun first, useful later: Mobile learning acceptance among secondary school students in Indonesia. Education and Information Technologies, 26(2), 1737–1753. https://doi. org/10.1007/s10639-020-10334-w.
- Sánchez, R., & Hueros, A. (2010). Motivational factors that influence the acceptance of Moodle using TAM. https://doi.org/10.1016/j.chb.2010.06.011.
- Salloum, S. A., Qasim Mohammad Alhamad, A., Al-Emran, M., Abdel Monem, A., & Shaalan, K. (2019). Exploring students' acceptance of e-learning through the development of a comprehensive technology acceptance model. IEEE Access, 7, 128445–128462. https://doi.org/10.1109/ ACCESS.2019.2939467.
- Stake, R. E. (1995). The Art of Case Study Research. Thousand Oaks, CA: Sage.
- Weerasinghe, S. & Hindagolla, M. (2017). Technology Acceptance Model in the Domains of LIS and Education: A Review of Selected Literature. http://digitalcommons.unl.edu/libphilprac/ 1582.
- Yin, R. K. (2018). Case Study Research and Applications: Design and Methods (6th ed.). Thousand Oaks, CA: Sage.