
Keywords:
eye-tracking, user experiences, TikTok, MACAN museum
This experimental study explores how Generation Z and Y in Indonesia interact with Museum MACAN's TikTok content, using eye-tracking to understand engagement with cultural content on this pivotal platform. Participants undertook tasks of varying lengths (120, 300, and 180 seconds) to reflect different engagement scenarios, with metrics like Participant Quality Grade (PQG), test duration, browser dimensions, K-factor, gaze, and fixation counts assessing interaction depth. Results indicate high engagement levels, with quality ranging from good to excellent and a noted preference for focal processing, suggesting users' concentrated attention on video content. Heatmaps confirmed video content as the primary focus area. This study highlights TikTok's role in enhancing museum engagement and provides insights for cultural institutions to refine their social media content strategies.
INFO ARTIKEL
Kata kunci:
eye-tracking, pengalaman pengguna, TikTok, museum MACAN
ABSTRAK
Studi eksperimental ini mengeksplorasi generasi Z dan Y di Indonesia yang berinteraksi dengan konten TikTok Museum MACAN dengan menggunakan teknologi pelacakan mata (eye-tracking) untuk memahami keterlibatan dengan konten budaya di platform ini. Para partisipan menjalankan tugas dengan durasi yang bervariasi (120, 300, dan 180 detik) untuk merefleksikan skenario keterlibatan yang berbeda dengan metrik seperti Nilai Kualitas Partisipan (PQG), durasi tes, dimensi browser, faktor K, jumlah pandangan, dan hitungan fiksasi menilai kedalaman interaksi. Hasil percobaan menunjukkan tingkat keterlibatan yang tinggi dengan kualitas berkisar dari baik hingga sangat baik dan adanya preferensi untuk pemrosesan fokus. Hal ini menunjukkan perhatian pengguna terkonsentrasi pada konten video. Pemetaan panas (heatmap) mengonfirmasi konten video sebagai area fokus utama. Studi ini menyoroti peran TikTok dalam meningkatkan keterlibatan museum dan menyediakan wawasan bagi lembaga budaya untuk menyempurnakan strategi konten media sosial.
https://doi.org/10.5614/sostek.itbj.2024.23.1.3
Submitted: November 27, 2023 Accepted: March 27, 2024 Published: March 30, 2024
Introduction
Social media platforms have become an essential part of our daily routines in the contemporary digital environment, as noted by Meike & Young in Tampubolon (2016), defining social media as platforms that enable users to actively participate, share information, and convey messages (Mayfield in Wicaksono, 2017). Numerous companies leverage social media as a tool for their marketing communications (Kinanti, 2017). Specifically, TikTok has experienced remarkable growth in popularity, particularly in Indonesia, which, according to data from We Are Social as of January 2023, ranks as the second-largest national user base of TikTok globally with over 109.9 million users. The platform's ascension to the leading trend in Indonesia in 2022 is a testament to its wide-reaching influence (Narto & Rizky, 2023). TikTok's unique appeal lies in its ability to provide a space for the dissemination of creative and succinct video content, a feature that has been extensively discussed in the literature (Devi in Fauziyah et al., 2023).
Concurrent with technological progress, the methodologies for researching user experiences have evolved. The user experience encompasses all elements related to how an individual uses an interactive product and the extent to which the product fits its usage context (Nakamura et al., 2017). Additionally, ISO 9241-210 defines user experience as the individual's perceptions and responses resulting from the use or anticipated use of a product, system, or service (Norman & Kirakowski, 2018). Advancements in technology have correspondingly advanced research methodologies for studying user experiences, notably through eye-tracking (Dondi & Porta, 2023; Ferrato et al., 2023). This technique allows for the observation of eye movement patterns as users interact with specific interfaces or content, offering valuable insights into their areas of focus and preferences (Kurzhals, Fisher, Burch, & Weiskopf, 2016; Carter & Luke, 2020). This study utilized eye-tracking to examine the engagement of users with the TikTok content of Museum MACAN, a distinguished contemporary art venue in Jakarta (Fitriana et al., 2020; Tonce et al., 2022). The reason for focusing on Museum MACAN in this study is that it has become a popular destination for TikTok users to create their creative content. The museum's established status as a central content provider on TikTok presents a unique opportunity to delve into the nature of user interactions with its digital presence.
Previous eye-tracking research, such as that conducted by Hsieh et al. (2022), has provided foundational knowledge in this domain. Their research focused on identifying which aspects of exhibitions captured visitors' attention at the National Museum of Natural Science in Taichung, Taiwan. The study aimed to understand visitors' cognitive engagement with exhibits and to inform exhibit design improvements through the analysis of eye movement patterns, utilizing Pupil Core software from Pupil Labs. Their results highlighted that fully engaged visitors demonstrated increased cognitive engagement and distinctive eye movement behaviors, whereas less focused visitors were more susceptible to distractions, often redirecting their gaze toward exhibit titles.
A study analogous to ours was conducted by Kuhar & Merčun (2022), exploring user experiences in the Europeana and dLib digital libraries. Their quantitative approach synergized eye-tracking with questionnaires, involving a sample of 30 participants from the Faculty of Arts at the University of Ljubljana, comprising 16 females and 14 males. Utilizing the Tobii eye tracker, the research aimed to differentiate user experiences between the two digital libraries, extract insights from combined methodological approaches, and correlate the findings from eye-tracking with questionnaire responses to comprehensively understand user interactions within the libraries. The questionnaire results indicated a differential user experience between the libraries, with one providing a more satisfying user engagement, marked by increased positive responses and fewer negative reactions. In contrast, eye-tracking data unveiled distinctive gaze patterns, with significant variations observed in interactions with the libraries' search boxes. The integration of data from both questionnaires and eye-tracking revealed correlations that emphasize the significance of search box placement and the homepage's intuitiveness for the user experience.
Furthermore, a study by Raden (2014) in Indonesia employed eye-tracking to analyze the elements of the XL visual advertisement "No Need to Think" that captured viewers' attention. The goal was to ascertain the patterns of eye movement in relation to the visuals and determine the effectiveness of the message conveyed by the advertisement. This research utilized a quantitative framework, incorporating eye-tracking instruments capable of producing gaze plots and heatmap visualizations. The study comprised a literature review, eye-tracking data collection, and in-depth analysis. The results of the study indicated a marked preference by participants for the central visual element of the gaze plot, which prominently featured an image of a monkey holding its head. This focal point was consistent with the Heatmap data, where the monkey image emerged as the primary element capturing viewer attention, as evidenced by the concentrated eye fixations on this image. Other components of the advertisement, such as the XL logo and slogans like "Don't Think" or "Use the Cheapest XL," did not emerge as major points of interest, drawing only peripheral attention from viewers.
In a study related to visual perception, Swasty et al. (2021) investigated how participants responded to the color schemes and imagery on the packaging of artisanal banana chips, employing eye-tracking to assess participants' reactions and interviews to explore the underlying perceptions. Their qualitative research, which included a comprehensive literature review, eye-tracking data collection, and content analysis, revealed that there was no significant link between the colors and images that participants preferred and their choice of snack, indicating that adolescents and young adults have similar responses to such visual stimuli.
Building on the foundation of previous eye-tracking studies that primarily focused on product packaging, visual advertising, and user interfaces, this research offers a novel perspective by examining eye-tracking in the context of TikTok content related to Indonesian museums. Specifically, the study investigates how users engage with the content of Museum MACAN on TikTok, aiming to illuminate the patterns and preferences in their interactions with the museum's digital presence. The findings are expected to inform strategies for Museum MACAN and other cultural institutions, suggesting ways to create more captivating and user-oriented exhibition experiences tailored for the TikTok audience. Ultimately, the goal is to refine and enrich the users' journey as they access and internalize information about Museum MACAN through the platform.
Method
This study adopted an experimental approach utilizing eye-tracking techniques to explore the dynamics of user experience in interacting with the TikTok content of Museum MACAN. Selecting the TikTok account of Museum MACAN, with a significant following exceeding 26,100 users as of February 2024, this research offers a comprehensive field for analyzing inter-generational engagement strategies. Museum MACAN, as a leading cultural institution, has successfully integrated social media into its outreach initiatives, thereby serving as an exemplary case for studying the nexus between cultural consumption and digital platforms (Lewandowska, n.d.; Yi et al., 2021). Through this experimental methodology, the study aims to delve deeper into how users across generations engage with the museum's digital content and how this engagement impacts their cultural consumption experience in the digital age. The research utilized RealEye, an online eye-tracking application, subscribed to for a month at a cost of $350. Data collection was conducted on four laptops with different operating systems, namely macOS Ventura 13.2.1 and Windows 11 Home Single Language 64-bit (10.0, Build 22621), to investigate the uniformity of TikTok content presentation across devices.
The research procedure was bifurcated into three main phases: sample and data gathering, experimental execution, and data scrutiny, as mentioned by Mañas-Viniegra et al. (2019). In the initial phase, the sampling approach was broadened beyond convenience sampling to a stratified random sample, better representing the follower demographics of the TikTok account. The enhanced sampling involved randomly selecting a representative subset from the two generational cohorts, Gen Z participants (aged 18
-23, comprising five individuals) and Gen Y participants (aged 26 -34, also five individuals), in proportion to their presence within the total follower base. This approach aimed to fortify the research's validity by capturing a more diverse and sizeable participant pool, which could yield a more reliable reflection of collective user behavior (Mañas-Viniegra et al., 2019; Rakhmayanti in Mahardika et al., 2021).
Participant selection adhered to specific inclusion criteria: followers of the Museum MACAN TikTok account with good physical and mental health, free of visual impairments requiring corrective lenses, and without color vision deficiencies. Participants who have interacted with or sought information on Museum MACAN's TikTok content, actively use TikTok with a frequency of at least 30 minutes a day, and have an interest in the arts were selected for this study. To acknowledge participant contributions, refreshments were provided. The demographic details of the study subjects were systematically recorded in Table I.
The research involved conducting an eye-tracking experiment segmented into three distinct tasks of varying lengths. Initially, participants were asked to browse the Museum MACAN's TikTok page freely for up to two minutes without specific instructions. The subsequent task, which lasted up to five minutes, involved answering five multiple-choice questions along with fill-in-the-blank questions to corroborate their answers, focusing on aspects such as the museum's operational hours, directions, membership details, merchandise, and guidelines to be followed before visiting the museum. The final task, capped at three minutes, consisted of three multiple-choice questions accompanied by a supplementary openended question, targeting the museum's exhibits, the artists featured, and the specific artworks displayed at Museum MACAN.
Table I Participant Demographic Data
| No. | ID | Age | Sex | ||
|---|---|---|---|---|---|
| 1. | P1 | 18 | Female (P) | ||
| 2. | P2 | 19 | Female (P) | ||
| 3. | P3 | 22 | Female (P) | ||
| 4. | P4 | 23 | Female (P) | ||
| 5. | P5 | 23 | Male (L) | ||
| 6. | P6 | 26 | Female (P) | ||
| 7. | P7 | 27 | Female (P) | ||
| 8. | P8 | 29 | Male (L) | ||
| 9. | P9 | 31 | Male (L) | ||
| 10. | P10 | 34 | Female (P) | ||
Source: Primary data processed by researchers in 2023.
Data harvested post-experiment from the RealEye software was analyzed based on a multitude of factors: participant quality grade (PQG), duration of the test, browser size specifications (width and height), average K-factor, counts of gazes and fixations, and heatmap observations. PQG, as classified by Lewandowska on the Realeye.io platform, reflects the quality of participant engagement, ranging from 6 for outstanding to 1 for very poor, with higher scores indicating data reliability and accuracy, ready for in-depth analysis. Test duration refers to the length of time for which stimuli were displayed, measured in milliseconds, while browser dimensions in pixels were assessed for screen size.
The average K-factor elucidates the attention span of each participant, with three potential values: K>0 indicates focused processing, characterized by longer fixations followed by brief saccades. In contrast, K<0 suggests ambient processing, where brief fixations precede longer saccades, while K=0 implies a balanced attention span, combining elements of both extended and brief fixations with corresponding saccades. Gaze counts provide a measure of how frequently a participant's attention is drawn to particular elements, and fixation counts denote the length of time these elements are fixated
upon. Heatmaps visually represent attention hotspots and the details participants zero in on (O'Grady & O'Grady, 2017). Within these maps, color gradations indicate attention intensity: red or "hot" regions capture areas that command maximum attention, whereas blue regions signal lesser attention spans, as expounded by Lewandowska (n.d) and further substantiated by Yi et al. (2021).
Result and Discussion
The outcomes presented in this research were derived from data collected via the RealEye software, which were then meticulously analyzed and interpreted in relation to the designated tasks, the characteristics of Museum MACAN's TikTok content, and participant demographics.
Task 1: Exploration of MACAN TikTok
For the initial task, participants were instructed to access Museum MACAN's TikTok profile through its handle, @museummacan, with a 120-second period allotted for exploration. They were given the freedom to browse through the museum's TikTok content at their discretion, with the condition that their exploration was confined to the Museum MACAN TikTok page. Comprehensive instructions for Task 1 are delineated in the accompanying document. The results stemming from the participants' engagement in Task 1 are documented in Table II. Table II displays the participant quality grade (PQG) for all study subjects, with scores ranging from 4 to 5, indicating that participant engagement quality was between good and very good. The majority of participants attained a PQG score of 5, signifying a 'very good' engagement level. Only participants P2, P3, and P5 received a score of 4, highlighting the overall high and precise quality of participant engagement in the study.
Regarding the duration of the test, the average time spent by participants was below the maximum of 120 seconds, suggesting the allocated time was sufficient for exploring Museum MACAN's TikTok content as outlined in Task 1. A detailed examination of the data showed that younger participants, those aged 18 - 23, tended to navigate the museum's TikTok page more quickly than the older participants, aged 26 - 34, indicating a faster content navigation rate among the younger demographic. In their exploration during Task 1, most participants typically scrolled through the entire TikTok feed from top to bottom before engaging with specific videos.
Table II Data on Eye-Tracking Results Task 1
| ID | Age | Sex | Participant Quality Grade | Test Duration (ms) | Test Browser Width (px) | Test Browser Height (px) | K-Factor Mean | Gaze Count | Fixation Count |
|---|---|---|---|---|---|---|---|---|---|
| P1 | 18 | P | 5 | 120003 | 1440 | 900 | 0.33 | 3627 | 324 |
| P2 | 19 | P | 4 | 120007 | 1440 | 900 | 0.32 | 3752 | 364 |
| P3 | 22 | P | 4 | 119997 | 1440 | 900 | 0.25 | 3748 | 351 |
| P4 | 23 | P | 5 | 119995 | 1440 | 900 | 0.39 | 3583 | 348 |
| P5 | 23 | L | 4 | 117169 | 1440 | 900 | -0.01 | 3254 | 305 |
| P6 | 26 | P | 5 | 120019 | 1366 | 768 | 0.4 | 3354 | 416 |
| P7 | 27 | P | 5 | 115983 | 1440 | 900 | 0.29 | 3435 | 312 |
| P8 | 29 | L | 5 | 120021 | 1440 | 900 | 0.31 | 3742 | 370 |
| P9 | 31 | L | 5 | 120002 | 1440 | 900 | 0.35 | 3738 | 372 |
| P10 | 34 | P | 5 | 120003 | 1280 | 800 | 0.31 | 3334 | 323 |
| Mean | 4.7 | 119319.9 | 1416.6 | 876.8 | 0.294 | 3556.7 | 348.5 |
Source: Primary data processed by researchers in 2023.
As for the browser dimensions, the use of laptops to access the content resulted in larger display dimensions compared to smartphones. The diversity in laptop models led to variations in screen widths and heights across participants. On average, the screen width among the ten participants was recorded at 1,416 pixels, and the height at 868.8 pixels. These dimensions may provide insights into the preferred browser dimensions for viewing TikTok content on laptops.
Regarding the attention span of participants, nine out of ten exhibited a K-factor greater than 0, indicating a tendency towards prolonged fixation on content followed by brief eye movements (saccades). This pattern suggests that the majority of participants engaged in detailed observation of the content during Task 1, particularly by selecting specific videos on TikTok. Conversely, one participant (P5) showed a K-factor less than 0, suggesting a more general browsing behavior across Museum MACAN's TikTok feed without focusing deeply on specific items.
In terms of gaze count, the participants, on average, directed their attention to 3,556.7 elements within the 120-second timeframe, equating to about 35 elements per second. This browsing rate across Museum MACAN's TikTok content, predominantly composed of short video clips, indicates that the nature of the content likely facilitated rapid scanning by the participants.
The focus of participants on Museum MACAN's TikTok content was further analyzed through fixation counts, revealing a balanced distribution with half of the participants registering fixation counts below the average and the other half above. A more detailed analysis based on age groups showed that younger participants (aged 18 - 23) generally had lower fixation counts than their older counterparts (aged 26 - 34), implying a longer duration of focus on the content among the older age group. Task 1 results, including this fixation behavior, are visually depicted in a heatmap, specifically highlighted in Figure 1 for participants P1 and P4, who demonstrated the most significant concentration of attention according to the heatmap analysis.
The content analyzed by participants P1 and P4, as illustrated in Figure 1a and Figure 1b, respectively, focused on a video about the operating hours of the MACAN Museum. The heatmaps from P1 and P4's sessions reveal that their attention was predominantly on the video's content, particularly on visuals displaying the museum's exhibitions and text outlining the MACAN Museum's operational hours. Less attention was paid to other video elements, such as user comments and the descriptive caption of the video itself.
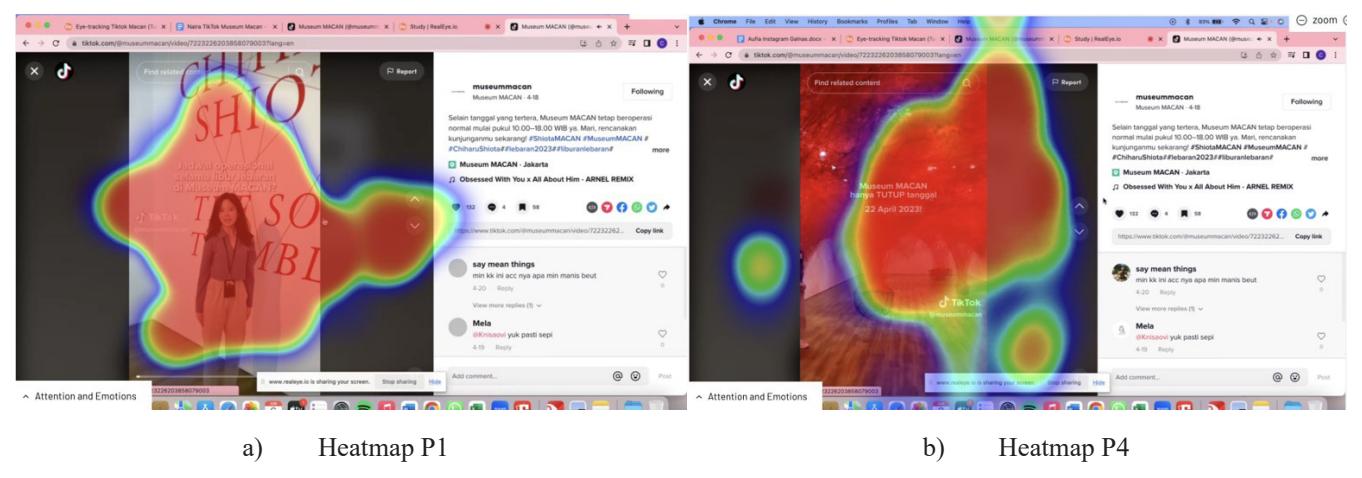
Figure 1 Heatmap of P1 and P4 in Task 1 Source: Primary data processed by researchers in 2023
Task 2: Exploring Details on Operating Hours, Location, Membership, Merchandise, and Considerations Before Visiting Museum MACAN
In the second task, participants were tasked with locating five specific types of information on Museum MACAN's TikTok page, encompassing operating hours, location, details on membership, merchandise
available, and considerations for visitors planning to go to the museum. This task had a duration limit of 300 seconds. Subsequent to their search, participants responded to queries related to the information they discovered. Comprehensive guidelines and questions for Task 2 are provided in an ancillary document. The outcomes of this exploration by the participants during Task 2 are summarized in Table III.
Table III outlines the participant quality grade (PQG) scores of the study subjects, primarily falling between 4 and 5, indicating a quality range from good to very good among participants. The majority achieved a PQG of 5, denoting a 'very good' quality level, with only three participants, P3, P5, and P6, receiving a score of 4. Overall, the group demonstrated both high quality and accuracy in their engagement.
Regarding the duration of the test, participants, on average, spent more than the allocated 300 seconds on Task 2. Specifically, only P1, P5, and P9 managed to complete the task within the set timeframe, indicating the task's complexity necessitated additional time for most participants. Task 2 required participants to locate specific pieces of information and answer questions pertaining to their findings, yet all participants were able to identify the five designated items and thoroughly address the queries within the given time constraints. Regarding the understanding of content in accordance with the tasks, participants aged 18 - 23 and 26 - 34 years were able to accurately answer questions numbers 1 and 2, related to the location and opening hours. However, for questions 3 and 4, concerning the benefits of membership and merchandise sold at Museum MACAN, the answers varied, with the 18 - 23 age group responding with 3 - 4 points, while the 26 - 34 age group only provided 1-2 points. This indicates that participants aged 18-23 have better memory and concentration compared to the 26 - 34 age group.
Table III Data on Eye-Tracking Results for Task 2
| ID | Age | Sex | Participant Quality Grade | Test Duration (ms) | Test Browser Width (px) | Test Browser Height (px) | K-Factor Mean | Gaze Count | Fixation Count |
|---|---|---|---|---|---|---|---|---|---|
| P1 | 18 | P | 5 | 299998 | 1440 | 900 | 0.34 | 9421 | 866 |
| P2 | 19 | P | 5 | 300003 | 1440 | 900 | 0.39 | 9277 | 926 |
| P3 | 22 | P | 4 | 300012 | 1440 | 900 | 0.25 | 8902 | 847 |
| P4 | 23 | P | 5 | 300017 | 1440 | 900 | 0.33 | 8754 | 845 |
| P5 | 23 | L | 4 | 299989 | 1440 | 900 | 0.06 | 7806 | 702 |
| P6 | 26 | P | 4 | 300012 | 1366 | 768 | 0.24 | 7472 | 823 |
| P7 | 27 | P | 5 | 300000 | 1440 | 900 | 0.34 | 9080 | 811 |
| P8 | 29 | L | 5 | 300042 | 1440 | 900 | 0.3 | 8947 | 863 |
| P9 | 31 | L | 5 | 299991 | 1440 | 900 | 0.23 | 8989 | 839 |
| P10 | 34 | P | 5 | 300025 | 1280 | 800 | 0.4 | 8578 | 861 |
| Mean | 4.7 | 300008.9 | 1416.6 | 876.8 | 0.288 | 8722.6 | 838.3 |
Source: Primary data processed by researchers in 2023.
Further analysis showed that participants aged between 26 and 34 typically required more time to complete the task than those aged 18 - 23, suggesting that age may influence navigation speed on Museum MACAN's TikTok page. The browser dimensions used for Task 2 were consistent with those in Task 1, owing to the uniform laptop specifications for all tasks. With regards to the level of attention, as indicated by the mean K-factor, all participants exhibited a K>0 value, signaling prolonged fixation followed by brief saccades among the entire cohort. Specifically, six participants demonstrated attention levels above the group average. During Task 2, the approach was predominantly to scroll through the TikTok feed from top to bottom in search of videos related to the task guidelines. Upon finding relevant videos, participants typically paused to watch attentively, gathering the necessary information to accurately respond to the posed questions.
From the perspective of gaze counts, the average recorded by participants was 8,722.6 over a span of 300 seconds, translating to roughly 87 gazes per second. This high rate of visual processing among participants is likely influenced by the format of Museum MACAN's TikTok content, which predominantly consists of short video clips. In evaluating the participants' engagement with Museum MACAN's TikTok content, the level of attention was inferred from fixation counts. Analysis of the average data indicated that only participants P5, P6, and P7 recorded fixation counts below the group median, implying that the majority of participants dedicated more time to engaging with the content on Museum MACAN's TikTok page. This finding is consistent with the objectives of Task 2, which required participants to find five specific pieces of information and respond to questions about them. In addition to the statistics outlined in Table 3, the insights from Task 2 are also depicted through heatmaps in Figure 2. The heatmaps of P1 and P4 are particularly noteworthy, displaying wider and more intense focus areas compared to others, thereby highlighting them as exemplar cases.
The content that captured P1's attention, as shown in Figure 2a, features a video on the merchandise range by Chiharu Shiota, while P4, as seen in Figure 2b, was focused on the benefits of museum membership. The heatmaps for both P1 and P4 indicate a primary focus on sections of the video displaying items, female figures, and associated captions, suggesting a tendency to bypass other video elements such as user comments and video descriptions.
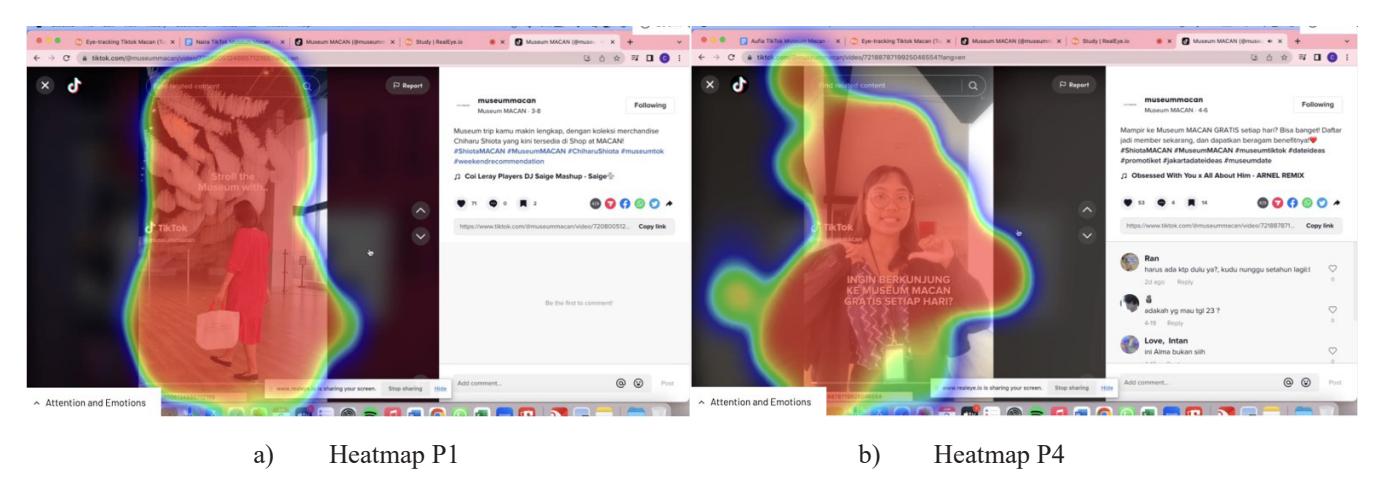
Figure 2 Heatmap of P1 and P4 in Task 2 Source: Primary data processed by researchers in 2023.
Task 3: Exploration of Exhibition, Artist, and Artwork Content at Museum MACAN
In this task, participants were directed to identify three distinct types of content on Museum MACAN's TikTok page, specifically focusing on exhibitions, artists, and art pieces, within a 180-second timeframe. After their exploration, participants answered questions related to the content they encountered. Detailed instructions and questions for Task 3 are available in the appendix. The outcomes of participant engagement in Task 3 are summarized in Table IV.
Table IV reveals Participant Quality Grade (PQG) scores ranging from 4 to 6, indicating that the quality of participant engagement varied from good and very good to excellent. A significant number of participants achieved a PQG of 5, denoting a very good level of engagement. Only one participant, P6, recorded a PQG score below the average, yet the collective quality of participation remained high and well-defined. Concerning the duration of the task, the average time spent by participants exceeded the allotted 180 seconds, suggesting a comprehensive engagement with the task. Notably, participants P2 and P3, who are within the 18 - 23 age group, managed to complete Task 3 within the designated timeframe, indicating that younger participants were more efficient in navigating the content. Despite this, all participants were able to successfully identify the three targeted content categories and accurately respond to the associated inquiries. The screen dimensions utilized by participants for Task 3 were consistent with those used in the preceding tasks, ensuring uniformity in the viewing experience across all activities.
| ID | Age | Sex | Participant Quality Grade | Test Duration (ms) | Test Browser Width (px) | Test Browser Height (px) | K-Factor Mean | Gaze Count | Fixation Count |
|---|---|---|---|---|---|---|---|---|---|
| P1 | 18 | P | 6 | 180014 | 1440 | 900 | 0.36 | 5609 | 513 |
| P2 | 19 | P | 5 | 179992 | 1440 | 900 | 0.31 | 5655 | 563 |
| P3 | 22 | P | 5 | 179988 | 1440 | 900 | 0.46 | 5118 | 461 |
| P4 | 23 | P | 5 | 180008 | 1440 | 900 | 0.38 | 5657 | 527 |
| P5 | 23 | L | 5 | 180008 | 1440 | 900 | 0.24 | 5115 | 487 |
| P6 | 26 | P | 4 | 180037 | 1366 | 768 | 0.15 | 4309 | 478 |
| P7 | 27 | P | 5 | 180000 | 1440 | 900 | 0.29 | 5473 | 488 |
| P8 | 29 | L | 5 | 180013 | 1440 | 900 | 0.34 | 5359 | 462 |
| P9 | 31 | L | 5 | 180001 | 1440 | 900 | 0.3 | 5540 | 536 |
| P10 | 34 | P | 5 | 180014 | 1280 | 800 | 0.33 | 5425 | 519 |
| Mean | 5 | 180007.5 | 1416.6 | 876.8 | 0.316 | 5326 | 503.4 |
Source: Primary data processed by researchers in 2023.
Regarding the attention metrics, all participants demonstrated a K-factor greater than 0, indicative of sustained attention on content followed by quick eye movements. Similar to the observations in Task 2, during Task 3, participants often paused to closely examine the content, indicating focused engagement. In terms of gaze metrics, the average across participants was calculated at 5,326, implying that, on average, each participant focused on 5,326 distinct elements throughout the 180-second duration, or 53 elements per second. An analysis of fixation metrics showed a balanced distribution, with half of the participants registering fixation counts below the group average and the other half above. A more detailed analysis revealed that the younger demographic, those aged between 18 - 23, generally exhibited lower fixation counts than their older counterparts, suggesting that the 26 - 34 age group engaged more deeply with the content on Museum MACAN's TikTok page. Furthermore, the insights obtained from Task 3 are graphically depicted through a heatmap in Figure 3. Due to their comprehensive and detailed heatmap coverage, illustrations from participants P1 and P4 were selected as examples.
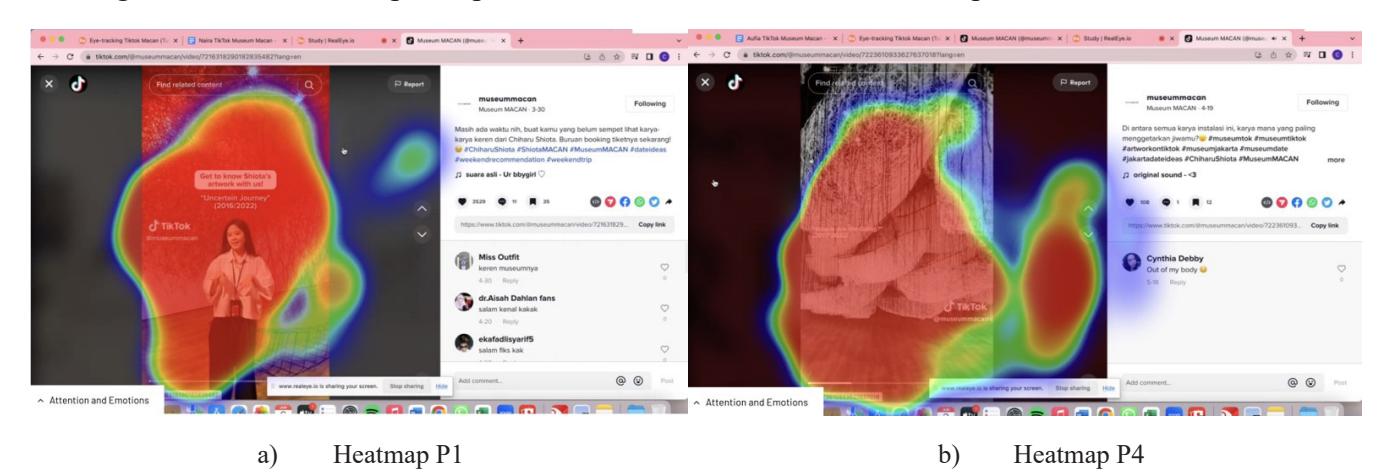
Figure 3 Heatmap of P1 and P4 in Task 3 Source: Primary data processed by researchers in 2023.
The artwork of Chiharu Shiota, as viewed by P1 (in Figure 3a) and P4 (in Figure 3b), captured significant attention. The heatmaps from both P1 and P4 primarily highlight their focus on the video
segments, particularly elements such as the artwork installation, the figures present, and the captions listing the titles of Shiota's art pieces. Conversely, less attention was paid to other elements such as user comments and the descriptive captions of the videos by both participants.
Task 4: Feedback on Museum MACAN's TikTok Content
After engaging with Museum MACAN's TikTok content through previous tasks, Task 4 solicited participants' feedback and suggestions for the platform, with detailed instructions provided in supplementary documents. The majority of participants found the content stimulating, and the information in the TikTok posts from Museum MACAN was easily understandable. Nevertheless, participants offered varied suggestions for enhancement, particularly focusing on aspects of the video content itself. For instance, P1 recommended varying the background music across videos to boost engagement and avoid repetitiveness. P5 raised concerns about audio quality, suggesting an increase in volume and a decrease in echo. This finding aligns with research by Nurhayati and Islam (2022), which suggests that uploading content on TikTok should involve using varied sounds and trending music associated with the brand's character. Attractive TikTok content trends tend to be quite short in duration and utilize a variety of sounds.
P3 recommended against content that is too wordy, whereas P7 suggested slowing down video playback during caption display or art showcasing to allow users to absorb details fully. According to Nurhayati & Islam (2022), the goal of creating effective content involves having a short duration and the use of relevant hashtags to facilitate users in finding the desired content. P7 noted that some videos were not in high definition, advocating for quality improvements in this domain.
Regarding TikTok's structural aspects, P2 suggested that Museum MACAN could organize its videos into playlists or thematic categories, such as exhibitions, artworks, and artists. P6 highlighted the potential benefit of including the museum's operating hours and location in the profile bio. P4 pointed out a lack of detailed information in certain exhibition videos, calling for more comprehensive and informative captions. In line with a focus on design, P9 and P10 emphasized the need for more visually attractive thumbnails that consistently convey the content's essence across videos.
Enhancements in design emerged as a recurring recommendation among participants. For example, P8 highlighted the importance of incorporating visually appealing imagery rather than relying solely on text, advocating for a varied color scheme that spans from bright colors to softer sepia tones. This recommendation is in line with Raden's 2014 research, which demonstrated that visual elements tend to engage users more effectively than textual content. Moreover, the significance of color selection was echoed by findings from Swasty et al. study in 2021, which underscored the role of color contrast in the design and packaging of products, suggesting that choices in color can significantly influence consumer purchasing decisions. These observations underscore the critical impact of color schemes in the context of art museums or their online portrayals, highlighting their essential role in drawing and maintaining the interest of the audience.
Implications of TikTok Content Development for Cultural Institutions
In the context of TikTok content development for cultural institutions, this study provides valuable insights into key elements that contribute to enhanced user engagement and interaction. A primary finding reveals that appealing visual aspects and superior audio quality play crucial roles in attracting and retaining user attention. This necessitates that cultural institutions continuously evaluate and improve the visual and audio aspects of their content, including video resolution clarity, the use of appealing colors, and the selection of suitable background music, all of which contribute to creating a more engaging user experience (Hsieh et al., 2022).
Furthermore, the research highlights the importance of presenting content in a clear and easyto-follow manner, paying attention to the pace at which information is delivered. This indicates that museums and similar institutions should consider the pacing of their video presentations, ensuring that text or narration within videos is delivered at a speed that allows users to easily follow and understand the presented information. User engagement can be enhanced by ensuring that content is not only informative but also presented in a manner that facilitates comprehension (Kuhar & Merčun, 2022).
Furthermore, participant suggestions regarding the organization of videos into categories or playlists highlight the need for a better content presentation structure. This suggests that by providing a clear and accessible categorization system, users will find it easier to navigate and locate the content they seek, which, in turn, can enhance their interaction with the museum's TikTok account. Effective content organization can facilitate users in exploring various aspects of the collection and museum activities, encouraging further exploration and deeper engagement with the presented material.
The use of heatmaps in content analysis is another strategy that has proven beneficial. By identifying areas of content that attract the most user attention, cultural institutions can tailor their content strategies to maximize the effectiveness and relevance of the material presented. Heatmaps offer direct visualization of user attention patterns, allowing content creators to better understand which elements draw interest and which may require adjustments or improvements (Swasty et al., 2021).
Lastly, feedback from participants underscores the importance of listening to and responding to input from the target audience. By encouraging and facilitating user feedback on their TikTok content, cultural institutions can leverage these insights to continually refine and enhance their content strategies. This two-way interaction not only strengthens the relationship between institutions and their audience but also ensures that the developed content remains relevant and appealing to their user community. Overall, the findings of this study underscore the significance of a thoughtfully considered and audienceresponsive content strategy. By paying attention to visual and audio aspects, clarity of presentation, organizational structure of content, and user feedback, cultural institutions can significantly improve user engagement and interaction on the TikTok platform while simultaneously enriching the overall user experience.
Conclusion
In engaging with the TikTok content of Museum MACAN, participants reliably found pertinent content and accurately responded to queries across all tasks. However, except for Task 1, which involved unstructured browsing and thus required less time, identifying specific content often exceeded the allocated timeframes. This behavior mirrors the customary exploratory pattern observed on TikTok, where users navigate through content based on their interests. Notably, in Task 2, the average participant engaged with 87 items per second, with younger participants (aged 18 - 23) taking more time in Tasks 2 and 3 compared to the older group (aged 26 - 34). This rapid engagement rate suggests that users swiftly assimilate content predominantly composed of visual elements.
Participants found Museum MACAN's TikTok content both stimulating and clear, yet they identified opportunities for enhancement, particularly in video content and design elements like color use and visual appeal. The study, however, had limitations, including a small participant pool of only ten individuals, which might have restricted the diversity of feedback. Future studies could benefit from a larger and more varied sample to provide a broader perspective. This research focused solely on one TikTok account without comparison to others, indicating the potential value of broader analyses involving various social media profiles or museums in future work.
Technical difficulties were also faced, notably with the RealEye software, which showed inconsistencies in experiment duration settings and heatmap recordings. Data collection challenges arose due to the software's limitations in exporting comprehensive datasets, necessitating multiple separate downloads. The choice of RealEye was primarily due to budget constraints, as eye-tracking methods are generally more costly than traditional survey or observation techniques. Future research may explore the use of more consistent and reliable eye-tracking technologies.
References
- Alessio, F., Carla, L., Mauro, M., Giuseppe, S., & Alessandro, M. (2023). Eyeing the visitor's gaze for artwork recommendation. In Adjunct Proceedings of the 31st ACM Conference on User Modeling, Adaptation and Personalization, 374-378. https://doi: 10.1145/3563359.3596670
- Carter, B. T., & Luke, S. G. (2020). Best practices in eye-tracking research. International Journal of Psychophysiology, 155, 49-62. https://doi.org/10.1016/j.ijpsycho.2020.05.010
- Fauziyah, N., Afendi, A. R., Saputra, M. R., & Kamaria, K. (2023). Pemanfaatan aplikasi tiktok dalam mata pelajaran PAI sebagai media pembelajaran inovatif era digital. Borneo Journal of Islamic Education, 3(1), 19-29. https://doi.org/10.21093/bjie.v3i1.6257
- Hsieh, Yu-Ling, Ming-Feng Lee, Guey-Shya Chen, & Wei-Jie Wang. (2022). Application of visitor eye movement information to museum exhibit analysis. Sustainability, 14(11), 6932. https://doi. org/10.3390/su14116932
- Tonce, J. N., Ronda, M., & Napitupulu, F. (2022). Dekonstruksi pendidikan seni dalam ruang seni anak museum MACAN: Analisis semiotika roland barthes. Jurnal Mahardika Adiwidia, 1(1), 46-57. doi: 10.36441/mahardikaadiwidia.v1i1.467
- Kuhar, M., & Merčun, T. (2022). Exploring user experience in digital libraries through questionnaires and eye-tracking data. Library and Information Science Research, 44(3), 101175. https://doi. org/10.1016/j.lisr.2022.101175
- Lewandowska, B., & Wisiecka, K. (n.d). RealEye, and SWPS. Attention measurement with eye-tracking and K-coefficient - explained. Accessed July 14, 2023. https://www.realeye.io/blog/143-attentionmeasurements-k-coefficient/
- Lewandowska, B. (n.d). CSV file: Quality Stats. Accessed July 2, 2023. https://support.realeye.io/csvfile-quality-stats/
- Lewandowska, B. (n.d). CSV file: Raw Gazes and Raw gazes denoised: Exporting raw eye-tracking test results and using them. Accessed July 3, 2023. https://support.realeye.io/data-export-to-csv/
- Lewandowska, B. (n.d). Facial coding and K-coefficient. Accessed July 6, 2023. https://support.realeye. io/facial-coding/
- Lewandowska, B. (n.d). How to analyze heatmaps. Accessed July 10, 2023. https://support.realeye.io/ how-to-analyze-heatmaps/
- Lewandowska, B. (n.d). Participant Quality Stats Explained. Accessed July 13, 2023. https://support. realeye.io/participant-quality-stats-explained
- Mahardhika, V. S., Nurjannah, I., Ma'una, I. I., & Islamiyah, Z. (2021). Faktor-faktor penyebab tingginya minat generasi post-millenial di indonesia terhadap penggunaan aplikasi Tik-Tok. SOSEARCH: Social Science Educational Research, 2(1), 40-53. https://doi.org/10.26740/sosearch.v2n1.p40-53
- Viniegra, M. L., Veloso, A. I., & Cuesta, U. (2019). Fashion promotion on instagram with eye-tracking: Curvy girl influencers versus fashion brands in Spain and Portugal. Sustainability, 11(14), 3977. https://doi.org/10.3390/su11143977
- Nakamura, W., Marques, L., Rivero, L., Oliveira, E., & Conte, T. (2017). Are generic ux evaluation techniques enough? A study on the ux evaluation of the edmodo learning management system. Brazilian Symposium on Computers in Education, 28(1), 1007. https://d1wqtxts1xzle7.cloudfront. net/
- Narto, S., & Rizky, R. I. (2023). TikTok menjadi trend 2022 di platform sosial media. Journal of Social and Political Science/JUSTICE, 2(1), 101-114. https://jfisip.uniss.ac.id/index.php/journals/article/ view/35
- Norman, K. L., & Kirakowski, J. (2018). Evaluation Factors.
- Nurhayati, N., & Islam, M. (2022). Perancangan konten media sosial TikTok sebagai media promosi dedado batik di Surabaya. BARIK, 3(2), 112-124. https://ejournal.unesa.ac.id/index.php/JDKV/ article/view/46488
- O'Grady, J., & O'Grady, K. V. (2017). A designer's research manual, second edition. Rockport Publishers. Piercarlo, D., & Porta, M. (2023). Gaze-based human–computer interaction for museums and exhibitions: technologies, applications and future perspectives. Electronics, 12(14), 3064. doi: 10.3390/ electronics12143064
- Muttakin, R. A. Z. (2014). Metode analisa penjejakan mata dalam kajian tampilan iklan visual xl versi ngga usah mikir. Jurnal Desain, 1(03), 163-172. https://journal.lppmunindra.ac.id/index.php/ Jurnal_Desain/article/view/560
- Fitriana, R., Nurima, R., & Yoseli, M. (2020). Analisis motivasi pengunjung Museum MACAN Jakarta. Jurnal Ilmiah Pariwisata, 25(1), 76-83. doi: 10.30647/JIP.V25I1.1362
- Wirania, S., Mustikawan, A., & Koesoemadinata, M. I. P. (2021). Evaluasi Eye-tracking terhadap Persepsi Warna dan Gambar pada Primary Display Panel Kemasan. Jurnal Sosioteknologi Institut Teknologi Bandung, 20(1), 91-103. https://doi.org/10.5614/sostek.itbj.2021.20.1.9
- Tampubolon, M. M., Putri, Y. R., & Atnan, N. (2016). Strategi promosi coffee shop melalui media sosial instagram (studi deskriptif pada akun @crematology). eProceedings of Management, 3(2), 2421-2432. https://openlibrarypublications.telkomuniversity.ac.id/index.php/management/article/ view/2138
- Wicaksono, A. (2017). Pengaruh Media Sosial Instagram @wisatadakwahokura terhadap Minat Berkunjung Followers. JOM FISIP, 4(2), 1-15. https://jom.unri.ac.id/index.php/JOMFSIP/article/ view/16027
- Yi, Taeha, Mi Chang, Sukjoo Hong, & Ji-Hyun Lee. (2021). Use of eye-tracking in artworks to understand information needs of visitors. International Journal of Human-Computer Interaction, 37(3), 220– 233. https://doi.org/10.1080/10447318.2020.1818457