
INFO ARTIKEL
Kata kunci:
kualitas layanan elektronik, minat beli ulang, kepuasan pelanggan, website design, layanan konsumen, keamanan/privasi, belanja online
ABSTRAK
Pesatnya kemajuan teknologi menjadikan perusahaan berinovasi dalam penjualan online untuk meningkatkan kenyamanan konsumen memesan makanan. Saat ini, persaingan antarperusahaan semakin ketat, bisnis dipaksa untuk terus meningkatkan kualitas layanan agar menarik minat pelanggan dalam melakukan pembelian berulang. Tujuan penelitian ini adalah menyelidiki kepuasan pelanggan dan minat pembelian kembali dalam aplikasi McDonald's dipengaruhi oleh kualitas layanan elektronik, yang mencakup isu-isu seperti desain situs web, layanan pelanggan, keamanan/ privasi, dan fulfilment. Populasi penelitian adalah pengguna aplikasi McDonald's di Kota Bandung sebanyak 400 responden yang diambil melalui penyebaran kuesioner online melalui sosial media. Metode penelitian menggunakan SEM-PLS untuk analisis data. Prosedur pengambilan sampel dilakukan melalui purposive sampling. Temuan menunjukkan website design secara positif dan signifikan memengaruhi kualitas layanan elektronik, layanan konsumen secara positif dan signifikan memengaruhi
kualitas layanan elektronik, keamanan/privasi secara positif dan signifikan memengaruhi kualitas layanan elektronik, fulfilment secara positif dan signifikan memengaruhi kualitas layanan elektronik, kualitas layanan elektronik secara positif dan signifikan memengaruhi kepuasan pelanggan, dan kepuasan pelanggan secara positif dan signifikan memengaruhi minat beli ulang pada aplikasi McDonalds.
https://doi.org/10.5614/sostek.itbj.2024.23.1.4
Submitted: December 20, 2023 Accepted: March 27, 2024 Published: March 30, 2024
Introduction
Technological developments happen quickly in today's fast-paced environment and are essential to human survival and advancement. Technology helps with a variety of tasks, in addition to promoting the growth and activities of the international community. Similar things have happened to cell phones, which were first intended for long-distance calling and have evolved from computer functions to include ever-more-advanced features. People's daily lives are made easier by the multitude of capabilities found on smartphones. People can now make purchases with just their smartphones.
In 2022, 178.94 million Indonesians utilized e-commerce, or online purchasing. Statista Market Insights estimates that by 2027, there will be 244.67 million e-commerce users in Indonesia, which will continue the upward trend in user numbers during the next four years.
The largest obstacle to online shopping is maintaining customers' satisfaction and happiness. Therefore, a service-focused strategy is necessary in an electronic economy that is extremely competitive. In order for clients to return business, a company needs to offer them better services (Rita et al., 2019).
Repurchase intentions develop after customers complete transactions (Hutami et al., 2020). Among the factors influencing consumers' decisions to repurchase is the product's high quality. Product quality is determined by a variety of elements, including a product's capacity to perform its intended purposes. These factors include durability, constraint, correctness, maintainability, and other characteristics of the product (Kotler & Keller, 2009).
A decline in user interest in the application is indicative of dissatisfied customers with the offered services. The overall ability to enhance repurchase intent through the app is still subpar, despite the fact that some customers are still willing to increase their purchases through it. Previous research has shown that two factors that can influence repurchase intentions are customer satisfaction (Blut, 2016) and e-service quality (Rita et al., 2019).
According to Kotler and Keller (2009) and Mahemba et al. (2019), the emotion that results from a product performing positively or poorly based on one's expectations is pleasure. Customers will feel dissatisfied or happy, depending on whether the performance meets their expectations.
Rita et al. (2019: 8) refer to previous studies (Blut et al., 2015; Gounaris et al., 2010; Kitapci et al., 2014; Udo et al., 2010), which show a substantial relationship between customer satisfaction and e-service quality. Gounaris et al. (2010) and Rita et al. (2019: 8) claim that e-service quality has a beneficial effect on customer satisfaction. This suggests that there is a significant issue with customer satisfaction, which may have an immediate effect on repurchase interest, that is, the propensity of users to utilize the application again in the future. In order to address this issue and boost repurchase interest, it's critical to consider variables that impact consumer happiness, such as those pertaining to the caliber of electronic services.
The degree to which a website or application makes the process of browsing, buying, and receiving goods and services easier is known as e-service quality (Singh, 2019). Service quality, on the other hand, refers to the efforts made to meet customer demand and offer services in accordance with customer expectations and desires by paying attention to the right way of delivery (Abid & Purbawati, 2019). As a result, e-service quality plays a critical role in keeping internet-based businesses competitive. Customers' propensity to make additional purchases on e-commerce platforms will depend on how satisfied they are with the caliber of electronic services. In other words, customers are more likely to make more
online purchases if they believe the e-service they receive is of higher quality. According to Blut (2016), e-service evaluation is based on four factors: website design, customer service, security and privacy, and fulfillment.
The quality of the e-service that customers receive can have an impact on how satisfied they are with the products and services they purchase online. This happens when a client's expectations are met by the service, which can ultimately influence their willingness to make another purchase from the same online business. The results corroborate this claim.
The study, "The Impact of E-Service Quality and Customer Satisfaction on Customer Behavior in Online Shopping," was conducted by Rita et al. and published in a journal in 2019. The research findings demonstrated the elements' strong linkages and beneficial effects. The author has brought up a number of issues with the description above, including the following: How does the quality of the application's electronic services affect customer satisfaction? What does customer satisfaction mean for the application's repurchase interest? In order to determine what elements affect the quality of McDonald's electronic services, this challenge seeks to analyze whether the quality of the electronic service affects customer happiness and, by extension, if consumer contentment affects the intention to repurchase using the McDonald's app.
Based on the description above, the frame of mind and hypothesis generated are as follows.
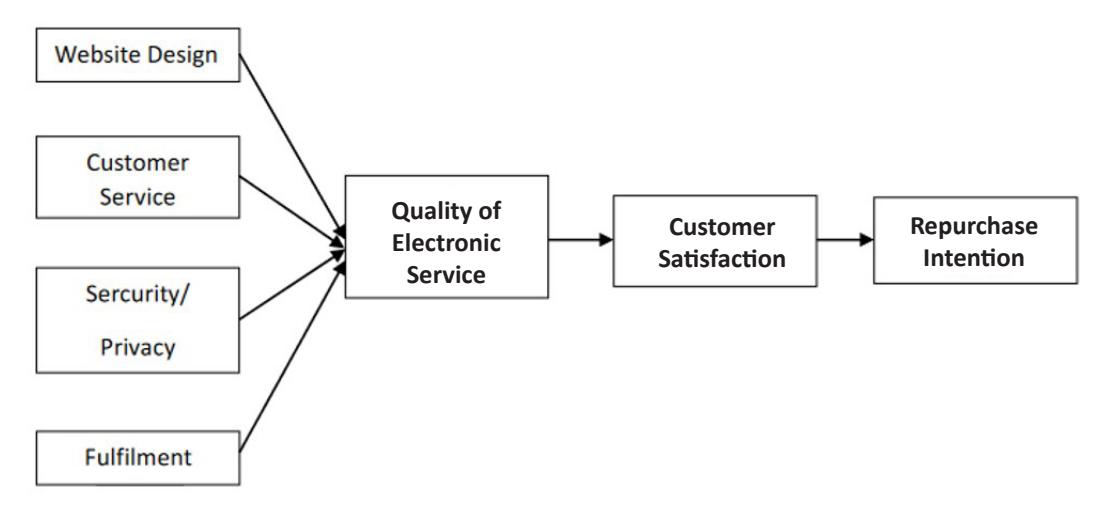
Figure 1. Thinking Framework Source: Rita et al., (2019)
Generated hypothesis:
- H1: Web Design has an effect on E-service quality.
- H2: Customer Service affects the quality of electronic services.
- H3: Security/Privacy affects E-service quality.
- H4: Fulfilment affects E-service quality
- H5: E-service quality affects Customer Satisfaction.
- H6: Customer Satisfaction affects Repurchase Intention.
Method
Sugiyono (2020) defines a "research method" as a scientific process that is employed to collect data for a certain purpose. Within the framework of this investigation, the goals are to examine how customer satisfaction with overall e-service quality affects their intention to repurchase using the McDonald's application. Additionally, Sugiyono (2020) clarified that the quantitative research approach, which is based on positivism, is employed to examine populations and samples. This study employs a causal approach, which entails analyzing the cause-and-effect relationship between variables. As a result, both influencing and non-influencing variables are included in this investigation.
Population
The users who have made purchases using the Bandung McDonald's app make up the population that is being used. The number of people who used the app to make purchases cannot be assured at McDonald's in Bandung.
Sample
If you want to know what the population is like, you need to look at a sample (Sugiyono, 2020). The researchers in this study utilized a non-probability sampling strategy based on purposeful sampling for their data collection. There is no way to tell for sure how many people have used the McDonald's app and made a purchase based on this study. Hence, the following is the formula that was proposed by Lameshow (1973) to calculate the sample size:
\[n = \frac{Z^2 p \cdot q}{e^2}\]
n = Number of samples
Z = Value of the required level of confidence
p = Probability of being rejected
e = Maximum error tolerance (0.05)
q = Probability of being accepted (1-p)
Considering the computation's findings, the bare minimum of samples ought to be It was acquired by 384 people. The author is concerned that the questionnaire data may be incomplete; hence, 400 samples in total will be used in this study.
Data Collection
Researchers employed both primary and secondary sources of information in this study. The findings of surveys given to Bandung residents at random using Google Forms serve as the main source of information for this study. Journal articles, archival materials, and other secondary sources are sourced from libraries and other academic institutions. When all questions have been answered and there is only one correct response for each statement, then the questionnaire is genuine. The researcher collected 400 legitimate samples responding to questionnaires from the distribution of the surveys; these will serve as the main data set for the study. What follows is an explanation of these two categories of data sources:
Primary data is information that researchers have gathered themselves. The primary data for this research came from a preset sample size that was surveyed using a questionnaire (Sugiyono, 2020). Secondary data is information that is not gathered by the original data collector. Secondary data, as employed in this study, consists of material gathered from sources other than the researchers themselves, such as corporate profiles, books, literature, journal articles, and several pertinent websites (Sugiyono, 2020). The Pearson Product Moment Correlation, or Pearson's r, is used as a validity test in this study. Its calculation is as follows:
\[r = \frac{n (\Sigma XY)(\Sigma X \Sigma Y)}{\sqrt{\{n\Sigma x^2 - (\Sigma X^2)^2\}\{n\Sigma Y^2 - (\Sigma Y)^2\}}}\]
r = Product moment correlation coefficient
n = Number of sample members
x = Respondent's total score
y = Total statement score
Data Analysis
The Structural Equation Model (SEM) method combines two scientific approaches: psychometric approaches that can describe model concepts with latent variables and econometric approaches that concentrate on prediction (Ghozali, 2021: 3). PLS-SEM analysis, according to Ghozali (2021: 17), typically consists of two sub-models:
- a. Measurement model, also known as the outer model. The model of measurement illustrates how the latent variable to be measured is represented by the manifest or observable.
- b. The structural model, often known as the inner type. The degree of strength estimate links between latent variables, or constructs, is displayed by the structural model.
Result and Discussion
If the measurement results satisfy the convergent validity conditions, the average variance extracted (AVE) value exceeds 0.5, according to research by Indrawati (2017:69). The results of tests carried out using SmartPLS software are as follows:
Table I Convergent Validity Results
| Variable | AVE | Critical Value | Model Evaluation |
|---|---|---|---|
| Website Design | 0.621 | >0,5 | VALID |
| Customer Service | 0.670 | >0,5 | VALID |
| Security/Privacy | 0.629 | >0,5 | VALID |
| Fulfilment | 0.579 | >0,5 | VALID |
| Electronic Service Quality | 0.672 | >0,5 | VALID' |
| Customer Satisfaction | 0.738 | >0,5 | VALID |
| Repurchase Intention | 0.740 | >0,5 | VALID |
Source: Processed Researcher Data Results via SmartPLS 4 (2023)
Table I shows that all variables and dimensions have AVE values higher than the crucial criterion of >0.5. Each variable in this study meets the requirements of high convergent validity.
Measuring cross-loading factors by comparing the AVE and correlation of each variable in research is one way to measure discriminant validity. According to Hair et al. (2017), the degree to which a concept differs from other concepts in practice is also reflected in its discriminant validity. When working with more latent variables, the AVE value for each should be greater than the r2 value. To ensure discriminant validity, each indicator's "loading" must be higher than its corresponding "cross loading." This brings us to our second condition. The Fornell-Lacker criterion test was used to conduct validation testing, and the following results were obtained:
Tabel II Discriminant Validity Test (Fornell Lacker Criterion)
| Customer Service | Fulfilment | Electronic Service Quality Fulfilment (X1) | Customer Satisfaction (Z) | Repurchase Intention (Y) | Security/ Privacy | Website Design | |
|---|---|---|---|---|---|---|---|
| Customer Service | 0.819 | ||||||
| Fulfilment | 0.376 | 0.761 |
| Customer Satisfaction (Z) | 0.393 | 0.410 | 0.859 | ||||
|---|---|---|---|---|---|---|---|
| Electronic Service Quality (X1) | 0.428 | 0.569 | 0.418 | 0.820 | |||
| Repurchase Intention (Y) | 0.254 | 0.364 | 0.392 | 0.307 | 0.860 | ||
| Security/Privacy | 0.456 | 0.671 | 0.460 | 0.580 | 0.450 | 0.793 | |
| Website Design | 0.305 | 0.513 | 0.361 | 0.529 | 0.363 | 0.498 | 0.788 |
Source: Processed Researcher Data Results via SmartPLS 4 (2023)
Table II shows that when comparing variables, the strongest correlation values are less than the AVE root values. As a result, the discriminant validity value produces results that are favorable. In order to attain discriminant validity, two instruments measuring the same concept but with differing predictions about its relevance should provide uncorrelated scores. In addition to the Fornell-Lacker criterion, the cross-loading value is another way to evaluate discriminant validity. The outcomes of the cross-loading factors that were processed using SmartPLS are as follows:
Table III Discriminate Validity Test Results (Cross Loading)
| Variable Laten | Website Design | Customer Service | Security/ Privacy | Fulfilment | Electronic Service Quality Fulfilment (X1) | Customer Satisfaction (Z) | Repurchase Intention (Y) |
|---|---|---|---|---|---|---|---|
| IQ1 | 0.793 | ||||||
| IQ2 | 0.805 | ||||||
| IQ3 | 0.791 | ||||||
| WA1 | 0.766 | ||||||
| WA2 | 0.758 | ||||||
| WA3 | 0.786 | ||||||
| PP1 | 0.781 | ||||||
| PP2 | 0.767 | ||||||
| PP3 | 0.785 | ||||||
| WC1 | 0.800 | ||||||
| WC2 | 0.856 | ||||||
| WC3 | 0.793 | ||||||
| PS1 | 0.746 | ||||||
| PS2 | 0.742 | ||||||
| PS3 | 0.769 | ||||||
| PO1 | 0.823 | ||||||
| PO2 | 0.797 | ||||||
| PO3 | 0.810 | ||||||
| WP1 | 0.783 | ||||||
| WP2 | 0.769 | ||||||
| WP3 | 0.735 | ||||||
| SA1 | 0.801 | ||||||
| SA2 | 0.855 |
| SL1 | 0.766 | |||||
| SL2 | 0.820 | |||||
| SL3 | 0.850 | |||||
| RP1 | 0.786 | |||||
| RP2 | 0.795 | |||||
| RP3 | 0.889 | |||||
| SC1 | 0.771 | |||||
| SC2 | 0.736 | |||||
| SC3 | 0.844 | |||||
| PR1 | 0.799 | |||||
| PR2 | 0.736 | |||||
| PR3 | 0.848 | |||||
| TD1 | 0.735 | |||||
| TD2 | 0.806 | |||||
| TD3 | 0.711 | |||||
| OA1 | 0.732 | |||||
| OA2 | 0.721 | |||||
| OA3 | 0.773 | |||||
| DC2 | 0.893 | |||||
| SQ1 | 0.792 | |||||
| SQ2 | 0.839 | |||||
| SQ3 | 0.828 | |||||
| S1 | 0.818 | |||||
| S2 | 0.886 | |||||
| S3 | 0.873 | |||||
| RI1 | 0.854 | |||||
| RI2 | 0.898 | |||||
| RI3 | 0.827 |
Source: Researcher Processed Data with SmartPLS 4 Software (2023)
According to the data in Table III, all of the indicators have larger cross-loading factor values than the other constructs. Hence, the indicators used in this study are both valid and up-to-date. The converging validity test and the discriminant validity test yielded outstanding results for the research instruments, which included 51 statement items, enabling inferences to be drawn from these tests.
Abdillah & Hartono (2015) found that reliability testing is a way to assess the usefulness of indicators in a variable in terms of their dependability. The Partial Least Squares (PLS) approach has two methods for assessing reliability: composite reliability and Cronbach's alpha. The following displays the findings of the reliability test conducted using SmartPLS 4:
Table IV Composite Reliability Results
| Composite | Critical Value | Cronbach's | Critical Value | Evaluation | |
|---|---|---|---|---|---|
| Latent Variable | Reliability | Alpha | Model | ||
| Website Design | 0.974 | >0.7 | 0.972 | >0.6 | Reliable |
| Customer Service | 0.924 | >0.7 | 0.901 | >0.6 | Reliable |
| Security/Privacy | 0.910 | >0.7 | 0.881 | >0.6 | Reliable |
| Fulfilment | 0.906 | >0.7 | 0.878 | >0.6 | Reliable |
|---|---|---|---|---|---|
| Electronic Service Quality (X1) | 0.860 | >0.7 | 0.756 | >0.6 | Reliable |
| Customer Satisfaction (Z) | 0.894 | >0.7 | 0.825 | >0.6 | Reliable |
| Repurchase Intention (Y) | 0.895 | >0.7 | 0.825 | >0.6 | Reliable |
Source: Researcher Processed Data with SmartPLS 4 Software (2023)
Table IV shows that Cronbach's alpha is greater than 0.6 and the composite reliability is better than 0.7, indicating that the processed data results are reliable and can be used to inform the research measures.
Structural Model Test Results (Inner Model)
To determine how much the independent variable impacts the dependent variable, use the coefficient of determination. The coefficient of determination is used to ascertain the extent to which the independent variable affects the dependent variable. The coefficient of determination R2 shows how much the dependent variable can be explained. According to Ghozali (2018), a low value for R2 indicates that the independent variable is unable to adequately explain the dependent variable.
Table V Sample Measurement Evaluation Results
| R Square | |
|---|---|
| Electronic Service Quality | 0.464 |
| Customer Satisfaction (Z) | 0.175 |
| Repurchase Interest (Y) | 0.154 |
Source: Researcher Processed Data (2023)
Table V demonstrates that the R-square value of the electronic service quality variable is 0.464. The buyback interest rate is 0.154, and the customer satisfaction rate is 0.175. Based on the data, we can see that electronic service quality affects customer satisfaction by 46.4%. Meanwhile, customer satisfaction shows a result of 17.5% and repurchase interest of 15.4%. However, repurchase interest alone cannot account for all the variation. Together, customer satisfaction and repurchase interest can only explain a small portion of the variability of each variable; in contrast, the electronic service quality variable falls into the moderate or moderate-low category.
The degree to which the model's output values agree with the parameter estimations may be assessed using the Q-Square value. A lower Q-Square score (below zero) suggests that the model is not very predictive. In contrast, when a model has a greater Q-Square value than a lower one, it is more predictively useful. For the inner model test, \(Q^2\) (predictive relevance) can be computed using the following method:
Q^2 = 1 - (1 - ) (1-) (1-)

Q^2 = 1 - (1 - ) (1-) (1-)

Q^2 = 1 - (1 - 0,030625) (1-0,023716) (1-0,215296)

Q^2 = 1 - (0,969375) (0,976284) (0,784707)

Q^2 = 1-0,731637

Q^2 = 0,268363
Judging from the calculation results, \(Q^2\) has a value of 0.2683. Since \(Q^2\) is larger than 0 (zero), the model can be said to have a meaningful predictive value.
Hypothesis Test
A research hypothesis is defined by Sekaran and Bougie (2017) as an explanation based on testable questions that anticipate a link between two or more variables. A favorable correlation between the independent and dependent variables is indicated by a positive route coefficient value. On the other hand, a negative path coefficient value indicates that the independent variable affects the dependent variable in the opposite way. According to Widodo (2017:121-126), finding out whether the independent variable has a partial effect on the dependent variable is the purpose of the t test. This, in our opinion, is the standard for acceptance and rejection:
- a) It can be feasible to show how dependent the dependent variable is on the independent variable if the calculated t-value is greater than the t-table value; this will lead to the rejection of H0 and acceptance of Ha.
- b) In line with the assumption that the independent variable has no impact on the dependent variable, the null hypothesis (H0) is accepted, and the alternative hypothesis (Ha) is rejected if the calculated t-value is smaller than the t-table value.
Tabel VI Path Coefficient
| Variable | Original | Sample | Standard | - T-Statistic - | P |
|---|---|---|---|---|---|
| Sample (O) | Mean (M) | Deviation (STDEV) | (IO/STDEV) | Values | |
| Website Design | 0.249 | 0.246 | 0.063 | 3.928 | 0.000 |
| Customer Service | 0.162 | 0.168 | 0.054 | 3.021 | 0.003 |
| Security / Privacy | 0.231 | 0.235 | 0.063 | 3.692 | 0.000 |
| Fulfilment | 0.226 | 0.224 | 0.074 | 3.047 | 0.002 |
| Service Quality | 0.418 | 0.423 | 0.033 | 12.542 | 0.000 |
| Customer satisfaction | 0.392 | 0.393 | 0.056 | 7.046 | 0.000 |
Source: Results of Processed Researcher Data with SmartPLS 4 software (2023)
Table VI shows the variable Electronic service quality is positively and significantly impacted by the dimensions of website design, as evidenced by the t0 value of 3,928 > \(t\alpha\) value of 1,966. Client Support When it comes to the electronic service quality variable, customer service dimensions have a positive and considerable impact, with a value of 3,021 > the \(t\alpha\) value of 1,966. The security/privacy component has a positive and large impact on the electronic service quality variable, with a value of 3,692 > \(t\alpha\) value of 1,966. The variable Quality of Electronic Services is positively and significantly impacted by the fulfilment dimension, with a value of 3,047 > \(t\alpha\) value of 1,966. The relationship between electronic service quality and customer satisfaction shows a positive and substantial effect, with a value of 1,966 for the electronic service quality variables. Customer satisfaction with buyback interest has a positive and significant effect on the repurchase interest variable, with a value of 7,046 > t < 1,966.
Discussion
The results of SEM analysis show that the quality of e-services is positively and significantly influenced by aspects of website design, customer service, security and privacy. This is in line with the study by Rita et al. (2019), which found that the three factors that influence the quality of electronic services are website design, customer support, and security and privacy. In line with Mahabah's research (2022), which states that fulfillment has a positive and large effect on e-service quality, the fulfillment dimension has a positive and significant effect on e-service quality.
According to research by Rita et al. from 2019, the caliber of electronic services has a beneficial and substantial effect on customer satisfaction. This shows that e-service quality variables affect customer satisfaction. Repurchase intention and customer satisfaction variables have a substantial positive correlation, according to the study by Rita et al. (2019). Previous findings are supported by these results.
Conclusion
The findings of the SEM analysis show that the website design dimension has a positive and substantial effect on the e-service quality of the McDonald's App, as indicated by a t-statistic value of 3.928>tα of 1.966. H0 is rejected, while H1 is accepted as a result.
The SEM analysis findings show that the customer service dimension has a positive and substantial effect on e-service quality on the McDonald's app, with a t-statistic value of 3.021 > tα value of 1.966. For this reason, H2 is accepted and H0 is rejected. The SEM analysis findings show that the security/ privacy dimension has a positive and significant effect on e-service quality on the McDonald's app, with a t-statistic value of 3.692 > tα value of 1.966. H0 is rejected, and H3 is accepted as a result. It shows that the fulfillment dimension has a positive and substantial effect on e-service quality on the McDonald's app, with a t-statistic value of 3.047 > tα value of 1.966. For this reason, H4 is accepted while H0 is rejected.
The t-statistic value of 12.542 > tα value of 1.966 indicates that the e-service quality characteristics of the McDonald's app have a positive and substantial effect on customer satisfaction, according to the SEM study results. Thus, H5 is accepted and H0 is rejected. The findings of the SEM analysis show that the customer satisfaction factor has a positive and substantial effect on the repurchase intention of the McDonald's app, with a t-statistic value of 7.046> tα value of 1.966. Thus, H0 is rejected while H6 is accepted.
References
- Abid, M. M. F., & Purbawati, D. (2020). Pengaruh e-security dan e-service quality terhadap e-repurchase intention dengan e-satisfaction sebagai variabel intervening pada konsumen e-commerce lazada di Fisip Undip. Jurnal Ilmu Administrasi Bisnis, 9 (1), 93-100.
- Ariyanto, D. (2018). Pengaruh attitude, subjective norm, dan perceived behavioral control terhadap repurchase intention e-money. Jurnal Ilmu Manajemen, 6 (4) (583-589).
- Azarine, S., & Yolanda, M. (2022). Effect of e-service quality and e-trust on customer e-repurchase intention and customer e-satisfaction as intervening variable (case study l shopee users). Journal of Small and Medium Enterprises, 1 (1).
- Bernarto, I., Wilson, N., & Suryawan, I. N. (2019). Pengaruh website design quality, service quality, trust dan satisfaction terhadap repurchase intention (studi kasus: tokopedia.com). Jurnal Manajemen Indonesia, 19 (1).
- Budiman, A. Y. (2020). Pengaruh e-service quality terhadap e-satisfaction dan e-loyalty nasabah pengguna mandiri online (survey pada nasabah bank mandiri pengguna mandiri online). Jurnal Profit, 14.
- Ferdinand A. (2002). Structural equation modelling dalam penelitian manajemen, 2nd ed.
- Fitriani, D. (2019). Pengaruh gender terhadap keputusan pembelian produk online (Studi kasus terhadap masyarakat Pontianak). Creative Communication and Innovative Technology Journal, 12 (1), 99- 107.
- Ginting, I. (2018). Aplikasi analisis multivariate dengan program IBM SPSS 25, edisi 9. Semarang: Badan Penerbit Universitas Diponogoro.
- Gounaris, S., Dimitriadis, S., & Stathakopoulos, V. (2010). An examination of the effects of service quality and satisfaction on customers' behavioural intentions in e-shopping. Journal of Services Marketing, 24 (2), 142-156.
- Hidayah Utami. 2017. E-service quality and e-recovery service quality on e-satisfaction lazada.com. Jurnal Riset Menejemen Sains Indonesia (JRMSI), 8 (2).
- Hikmah, A., & Riptiono, S. (2020). Pengaruh customer engagement dan e-service quality terhadap online repurchase intention dengan customer satisfaction sebagai variabel intervening pada marketplace shopee. Jurnal Ilmiah Mahasiswa Manajemen, Bisnis Dan Akuntansi (JIMMBA), 2 (1), 89-100.
- Ibzan, Eliasaph, et al. 2016. Consumer satisfaction and repurchase intentions. Developing Country Studies, 6 (2).
- Indrawati, P. D. (2015). Metode penelitian manajemen dan bisnis konvergensi teknologi komunikasi dan informasi. Bandung: PT Refika Aditama.
- Javed, M.K., & Wu, M. (2020). Effects of online retailer after delivery services on repurchase intention: An empirical analysis of customers' past experience and future confidence with the retailer. Journal of Retailing and Consumer Services, 54.
- Khosravi, S., Alizadeh, A., & Kehiri, B. (2018). Invertigating the dimensions of customer satisfaction: a review article. Journal of Applied Enviromental and Biological Sciences, 8 (1), 120-126.
- Kotler, P., & Armstrong, G. (2021). Principles of marketing (eighteent edition). Pearson Education, Inc.
- Kotler, P., & Keller, K. L. (2021). Intisari manajemen pemasaran, edisi 6. Yogyakarta: Andi.
- Kotler, Philips(s), & Armstrong, G. (2018). Principles of marketing, 17th ed. Pearson.
- Mahabah, S. (2022). Pengaruh dimensi e-service quality terhadap kepuasan konsumen dan niat beli ulang (Doctoral dissertation, Universitas Putra Bangsa).
- Mahemba, U. S. A. K., & Rahayu, C. W. E. (2019, December). Pengaruh harga dan kualitas produk terhadap minat beli ulang konsumen dengan kepuasan konsumen sebagai variabel mediasi studi pada mahasiswa pengguna smartphone xiaomi di Universitas Sanata Dharma Yogyakarta. Prosiding Seminar Nasional Multidisiplin Ilmu.
- Mothersbaugh & Hawkins. (2016). Consumer behavior: building marketing strategy, 13th ed. New YorkL McGraw-Hill Education.
- Nasution H., F. A. (2019). The effect of e-service quality on eloyalty thorough e-satisfaction on students of ovo application users at the faculty economics and business, University of North Sumatra, Indonesia. European Journal of Management and Marketing Studies, 4-5.
- Ngatno, & Ariyanti, A. E. (2021). Effect of e-service quality on e-satisfaction and e-loyalty: moderated by purchase frequency. Archives of Business Research, 9 (7), 153-161.
- Priansa, D. J. (2017). Perilaku konsumen dalam persaingan bisnis kontemporer. Bandung: Alfabeta.
- Rita, P., Oliveira, T., & Farisa, A. (2019). The impact of e-service quality and customer satisfaction on customer behavior in online shopping. Heliyon, 5 (10).
- Schiffman, L. G. & Wisenbit J. L. (2015). Consumer behavior, 11th ed. United States of America: Pearson. Setyawati S.M. (2019). Dampak Integrasi E-Service Quality dan E-Satisfaction pada E-Repurchase Intention Konsumen Aplikasi GO-JEK Kategori GORIDE. Performance: Jurnal Personalia, FInancial, Operasional, Marketing dan Sistem Informasi, 26 (2), 77-84.
- Singh, S. (2019). Measuring e-service quality and customer satisfaction with internet banking in India. Theoretical Economics Letters, 9 (2), 208-326.
- Sugiyono. (2016). Metode penelitian pendidikan: pendekatan kuantitatif, kualitatif, dan R&D. Alfabeta.
- Sugiyono. (2020). Metode penelitian bisnis pendekatan kuantitatif, kualitatif, dan R&D. Alfabeta. Sugiyono. (2022). Metode penelitian kuantitatif dan kualitatif dan R&D, edisi 2. Bandung: Alfabeta
- Susanto, S., & Hutami, L. T. H. (2021). Pengaruh green marketing, inovasi produk, dan brand image terhadap minat beli. Jurnal Ilmiah Manajemen Kesatuan, 9(1), 33-42.
Influence of E-Service Quality on Customer... | Dhiya, Marheni
Syaputra, I. (2021). Pengaruh experiental marketing dan kepuasan konsumen terhadap loyalitas konsumen (studi kasus pada konsumen Telkomsel di kota Pekanbaru). Doctoral dissertation, Universitas Islam Negeri Sultan Syarif Kasim Riau.
Tjiptono, F. & Diana, A. (2020). Pemasaran strategik: teori dan aplikasi. Yogyakarta: Andi. Tjiptono, F. (2014). Pemasaran jasa – prinsip, penerapan, dan penelitian. Yogyakarta: Andi.