
INFO ARTIKEL
Kata kunci:
ABSTRAK
Jakarta telah mengalami beberapa kali banjir besar sejak tahun 2002, termasuk banjir pada tahun 2007, 2013, dan 2015, yang menjadi sumber keprihatinan bagi penduduk Jakarta. Penduduk DKI Jakarta telah mengungkapkan kekhawatiran mereka mengenai bencana tersebut di Twitter dan platform lainnya dengan menawarkan laporan komprehensif mengenai pengalaman banjir penduduk Jakarta yang bermanfaat bagi para pemangku kepentingan di bidang manajemen banjir. Status sebuah insiden dapat ditentukan dengan cepat menggunakan data Twitter. Proyek ini menyelidiki tanggapan warga Jakarta di Twitter terhadap bencana banjir. Analisis tweet banjir dari warga Jakarta dilakukan dalam tiga fase: 2015, 2020, dan 2021. Dengan menggunakan pemodelan topik, inisiatif ini memetakan topik-topik yang muncul. Pemodelan topik
sangat efektif dalam konteks isu banjir, karena dapat membantu pengelompokan topik dan penyebaran informasi yang spesifik kepada publik. Tujuh kelompok topik berbasis pemodelan digunakan untuk mengorganisasi dua puluh topik. Hasil proyek ini menunjukkan mayoritas tweet banjir di Jakarta terkait topik "Laporan Cuaca". Temuan menunjukkan "Rumah Terendam" memiliki proporsi yang cukup besar dan diperkirakan akan meningkat setiap kali terjadi banjir. Meningkatnya jumlah rumah yang terendam di Jakarta seharusnya menimbulkan kekhawatiran di antara penduduk setempat.
https://doi.org/10.5614/sostek.itbj.2024.23.3.10 Submitted: April 26, 2024 Accepted: October 23, 2024 Published: November 21, 2024
Introduction
Flooding is a major natural disaster that poses a significant threat to major cities globally. Floods result in significant losses due to both direct and indirect damage. Physical contact with water causes direct damage, while periodic economic impacts result from these direct effects. In the last decade, losses caused by floods have more than doubled (Wijayanti et al., 2016).
Jakarta, one of the major cities in Asia, faces a significant risk of flooding. Climate change-related disasters have made Jakarta, Indonesia's capital city, one of the world's most vulnerable cities. The city is not only prone to flooding because of rainfall but also land subsidence, sea level rise, and natural disasters (Firman et al., 2011). Over the past two decades, Jakarta has experienced several significant floods in 2002, 2007, 2013, and 2015. The losses caused by these significant floods reached hundreds of millions of dollars (Wijayanti et al., 2016). The prevailing belief was that such responsibilities solely rested with governmental bodies or military forces (Dynes, 1994).
Creating a taxonomy mapping from a communication perspective regarding actors that shape communication patterns in an issue and public opinion involves several important steps. This process involves the identification of various actors, including individuals such as community leaders, influencers, or ordinary citizens, as well as organizational actors such as NGOs, government, media, and companies, and community actors such as discussion groups, online forums, or local communities. Additionally, other aspects that can be mapped include categorizing communication patterns, both verbal and nonverbal, such as speech or statements in the media or interviews, which can serve as considerations for public communication content on Twitter (Knezic et al., 2015).
Topic modeling leads to interaction analysis, which looks at how these actors talk to each other through several types of communication, like written comments and emoticons, to guess how public opinion will affect communication strategy mapping. Another intriguing consideration is assessing visual communication, such as creating diagrams or maps that illustrate the relationships between actors, communication types, and issues raised. This also serves as an evaluation effort of the public communication strategies currently implemented, particularly by the Jakarta city government, to assess the effectiveness of existing communication patterns and determine if there are strengths or weaknesses in the communication established. With this approach, it is hoped that we can identify who plays a role in shaping public opinion and how their communication patterns function in the context of specific issues.
In particular, we are attempting to formulate issues concerning the evolution of responses and opinions from Jakarta residents on social media during various major flood periods (2013, 2015, 2020, and 2021). Several authors have shown that real-time analytics based on social media data such as Twitter provide excellent opportunities to detect and monitor events automatically (Nguyen & Jung, 2017; Middleton et al., 2014; Villars et al., 2011), with text messages as the basic source of analysis (Hashem et al., 2015). In the event of a disaster, it is crucial to make informed decisions to assist the affected individuals with their needs. This project aims to map the topics that emerged in the Twitter conversations of Jakarta residents during the major floods in 2013, 2015, 2020, and 2021. We are trying to see if there are differences in the attention or response of Jakarta residents in the observed period. The difference between this research and general research is that by highlighting topic modeling related to the flooding issue in Jakarta, it can serve as a reference for re-evaluating the communication strategies that have already been conveyed by the Jakarta city government, while also considering the public's need for sufficient information.
What is the relationship between these topics and communication? This is important because you are using a communication perspective. Consider challenging the significance of every subject. Because in communication, the topic is a message. The message has meaning. What is the ideal framework for the meaning of each topic?
Method
One of the reasons for utilizing unscraped data is to address the issue of limited data coverage that Twitter permits through its API. The standard API from Twitter only permits data access until H-7 (www. developer.twitter.com).
Data
The data used in this project is Twitter data obtained using snscrape (www.github.com). A Python library was used to collect historical data on social media such as Twitter. Unscraped allows us to access Twitter's historical data for more than H-7. Geographically, we limit searches to a 20-mile radius from a predefined coordinate point (-6.2081567,106.8285533) to collect tweets sent from the DKI Jakarta area (Figure 1). We establish the coordinates at the outset to streamline the analysis process, considering that only a minor fraction of Twitter's data includes geographic coordinates.
Therefore, determining the coordinates at this early stage aims to limit and ensure that the tweets or Twitter data collected originate from the DKI Jakarta area. Because geo-location is available for only a fraction of Twitter's data, location-based crawling introduces bias by ignoring a much larger fraction of information without geo-location. The unscraped Python generates a dataset that includes tweet ID, username, tweet content, tweet time, and date. The tweet's location is based on the latitude and longitude of a tweet sent via GPS devices, into perspective the development of GeoWeb, both in terms of technologies and applications, against crisis management processes. (Roche et al.,2011)
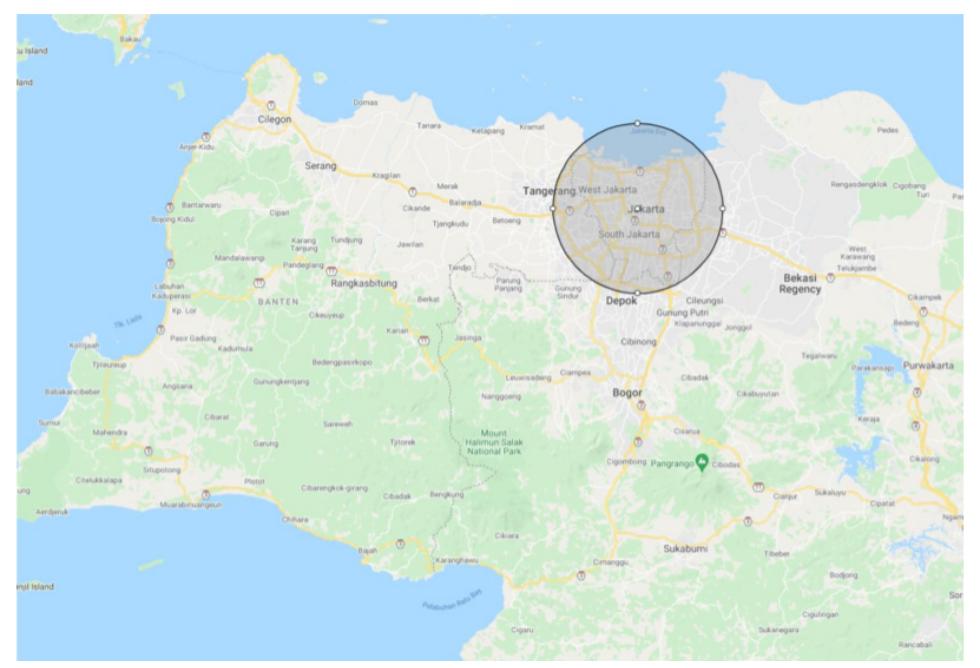
Figure 1 The area of Jakarta that is being explored with a certain geode Source: https://developers.google.com/maps/documentation/geocoding/overview
The duration of data collection is determined in 3 observation ranges which refer to the Exposure of the DKI Jakarta BPBD regarding major flooding in Jakarta (www.instagram.com). We determine the duration of data collection based on three observation ranges:
- Jakarta Flood 2015: 10 February 18 February 2015
- Jakarta Flood 2020: 31 December 2019 8 Jakarta 2020
- Jakarta Flood 2021: 19 February 2021 27 February 2021
b. Variable
The variable analyzed in this study is the tweet or text variable from the Twitter data obtained. A tweet variable or tweet text has a maximum length of 280 characters and can contain various information, such as a website link, the user mentioned in the tweet, and the hashtags used.
Pre-Processing Data
Preprocessing is one of the crucial stages in text mining. tweet data needs to be transformed to eliminate parts of the text considered disturbing (Resch et al., 2018). According to Resch et al. (2018), this project implements several preprocessing steps to clean tweet data.
- a. URLs and Emails: Remove URLs and emails from tweets using regular expressions.
- b. Mentions and Tagging: Remove mentions (the @ symbol and words after the @ symbol) from tweets using regular expressions.
- c. Eliminate annoying words such as RT and non-ASCII characters from tweets.
- d. Newlines and spaces: remove newlines and trailing spaces from tweets
- e. Stop words: remove words from tweets found in Python NLTK stop words, such as "and" "or" etc. We also split the tweets into word lists using the Python NLTK tweet Tokenizer.
Descriptive Statistical Analysis
We analyze the tweet data's text to provide a detailed description of the obtained Twitter data. From this analysis stage, we get a descriptive picture of the frequency of the number of tweets per observation period, the frequency of the hashtags most often used, the frequency of words that appear frequently, and the word cloud. Twitter data are a valuable source of information for rescue and helping activities in case of natural disasters and technical accidents (Kersten et al.,2020). Undoubtedly, the age of big data has opened new options for natural disaster management, primarily because of the varied possibilities it provides in visualizing, analyzing, and predicting natural disasters (Yu, M et al.,2018).
Topic Model
This project uses topic modeling to develop a topic taxonomy from the collected Twitter data. Topic modeling is a statistical model based on the idea that a document is a mixture of several topics (Karami et al., 2020). This project uses Latent Dirichlet Allocation (LDA), one of the most frequently used topic modeling models (Resch et al., 2018). LDA, according to Resch et al. (2018), is a proven topic modeling technique for searching, tracing, summarizing, and grouping large numbers of documents. Because topics appear as part of the document or text under analysis, its application does not require annotations or labeling of previous records.
Results and Discussion
A total of 14,298 tweets related to "floods" in the Jakarta region were collected during three observation periods: the Great Flood of 2015 (Banjir Besar 2015), the Great Flood of 2020 (Banjir Besar 2020), and the Great Flood of 2021 (Banjir Besar 2021). The proportions showed that the Great Flood of 2020 observed the highest number of tweets compared to the Great Flood of 2015 and the Great Flood of 2021.
Overall, according to Table I below, the content of the tweets during the three observation periods did not exhibit significant differences. The most frequently mentioned hashtags during these periods did not show substantial variations either. Similarly, the Twitter accounts most frequently mentioned in Jakarta residents' conversations also did not differ significantly. This indicates that many Jakarta residents utilize Twitter to communicate with various parties for flood handling and information purposes. Jakarta residents frequently mention Twitter accounts such as @TMCPoldaMetro, @BPBDJakarta, @RadioElshinta, and @pln_ in their flood-related conversations.
However, there were notable differences in the governor's position in Jakarta during each observation period. In tweets about the floods in Jakarta during the Great Flood of 2015 (Banjir Besar 2015), the word "Ahok" and the Twitter account @basuki_btp received the most frequent mentions. On the other hand, during the floods of 2020 and 2021, the word "Anis," the hashtag #AniesTenggelamkanJakarta, and the account @aniesbaswedan were among the most frequently mentioned by Jakarta netizens on Twitter. Furthermore, during the flood periods of 2020 and 2021, Jakarta netizens frequently mentioned the Twitter account of the President of the Republic of Indonesia, @jokowi. This indicates that floodrelated issues in Jakarta (as a province) also extend to the government of Indonesia.
Table I Description of Periodization of Jakarta Flood Tweets
| Category | The Great Flood 2015 (Banjir Besar 2015) | The Great Flood 2020 Banjir Besar 2020 | The Great Flood 2015 Banjir Besar 2021 |
|---|---|---|---|
| Number of Tweets | 4.388 Tweets | 7.348 Tweets | 2.562 Tweets |
| 10 most frequently appeared hashtags | #banjir, #Banjir, #JakartaBanjir, #BanjirJakarta, #jakarta, #latepost, #BanjirJKT,#EnjoyJakarta, #Jakarta, #cuaca | #banjir, #Banjir, #BanjirJakarta, #JakartaBanjir, #banjirjakarta, #BanjirJabodetabek, #banjirbekasi, #PasukanOrangeDLH, #happynewyear, #jakarta | #banjir, #banjirjakarta, #banjirbekasi, #AniesTenggelamkanJakarta, #JakartaBanjir, #infociputat, #infopondokaren, #infobsd |
| 10 most frequently mentioned accounts | @petajkt, @TMCPoldaMetro, @basuki_btp, @BPBDJakarta, @lewatmana, @RadioElshinta, @detikcom, @pln, @Metro_TV, @infojakarta | @aniesbaswedan, @Radioelshinta, @DKIJakarta, @jokowi, @pln_, @TMCPoldaMetro, @BNPB_Indonesia, @dinaslhdki, @ridwankamil, @detikcom | @aniesbaswedan, @petabencana, @DKIJakarta, @RadioElshinta, @DinasSDAJakarta, @BPBDJakarta, @jokowi, @pln_, @detikcom, @Dennysiregar |
Source: Personal data research, 2023
Furthermore, we can utilize a word cloud, such as Figure 2 below, to visualize the most frequently mentioned terms in conversations related to floods on Twitter by Jakarta residents. Reading this word cloud proves to be useful in understanding the overall landscape of these conversations. In the word cloud below, we can observe that certain words appear to be larger compared to others, such as hujan 'rain,' surut 'recede,' and rumah 'house.' We can infer from the words "rain" and "recede" that heavy rainfall is the primary cause of Jakarta's flooding phenomenon. Additionally, during the observation period, we discovered a cluster of smaller words frequently associated with the flooding situation in Jakarta. We observe that the terms "Ahok" and "Anies" frequently appear during floods in Jakarta, in line with the findings presented in Table I above. These two terms represent the governor or the government of DKI Jakarta concerning the flood.
Figure 2 Wordcloud Jakarta Flood Tweets for 3 Observation Periods
Topic Taxonomy
The next stage of analysis involves exploring the topics that emerge from tweets by residents of DKI Jakarta regarding floods. Topic exploration is conducted using latent dirichlet allocation (LDA), a probabilistic statistical model that puts labels to tweets based on probability calculations. During the initial stage of analysis, we compute the LDA coherence score to determine the optimal number of topics.
The determination of the number of topics in a topic model is a crucial task. One approach to determining the number of topics involves computing the coherence score. In this project, Python was used to calculate the coherence score in order to ascertain the ideal number of topics in LDA. The following is a graphical visualization of the coherence score computation results (Figure 3):
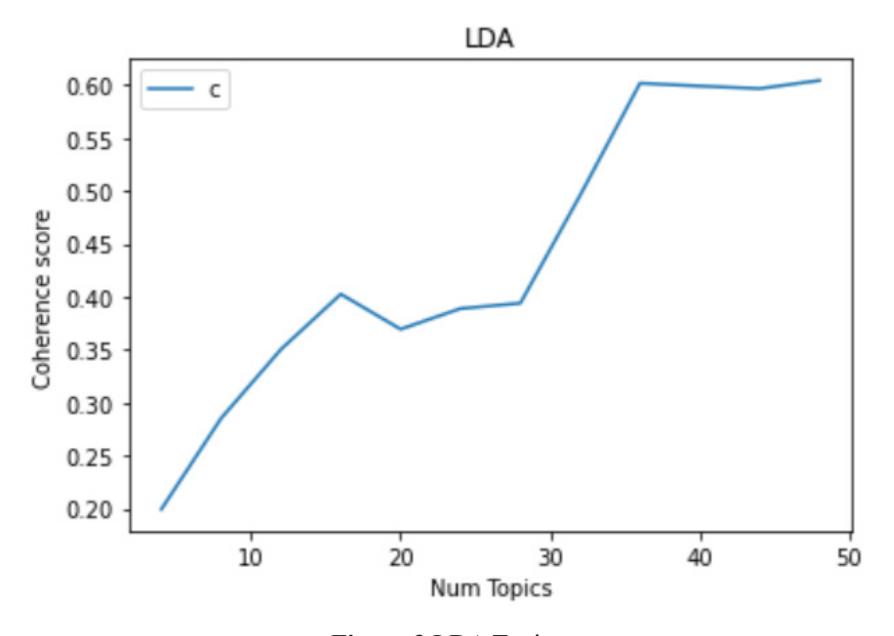
Figure 3 LDA Topics Source: Personal documentation, 2023
Num Topics = 4 has Coherence Value of 0.1993 Num Topics = 8 has Coherence Value of 0.2853 Num Topics = 12 has Coherence Value of 0.3503 Num Topics = 16 has Coherence Value of 0.4025 Num Topics = 20 has Coherence Value of 0.3693 Num Topics = 24 has Coherence Value of 0.3888 Num Topics = 28 has Coherence Value of 0.3939
Num Topics = 32 has Coherence Value of 0.4958
Num Topics = 36 has Coherence Value of 0.6015
Num Topics = 40 has Coherence Value of 0.5988
Num Topics = 44 has Coherence Value of 0.5965
Num Topics = 48 has Coherence Value of 0.6041
The graph above reveals that the LDA coherence score stands at 21 topics. This is indicated by a downward trend followed by an upward trend without any tendency to decline.
The LDA coherence score identifies 21 topics as the ideal number for the flood-related tweets from residents of DKI Jakarta (see Appendix 2). Table 2 below shows the grouping of these 21 topics into 7 topic clusters. We manually grouped the 21 topics into 7 topic clusters. We carefully read and interpreted each topic to assign a meaningful label. We found that some topics generated by LDA shared similarities or fell under the same label.
Table II Taxonomy of Topics for Jakarta Residents' Tweets Related to Floods
| Topic | 10 Primary Keywords | Topic Interpretation | |
|---|---|---|---|
| Road, fast, evening, cempaka, avoid, seen, saturday, tangerang, south, access | Road Access Closed | ||
| Topic 0 | (Jalan, deras, sore, cempaka, hindari, terlihat, sabtu, tangerang, selatan, akses) | ||
| Topic 4 | People, some, on field, office, adult, high, center, rock, fail, pratama | ||
| (Orang, beberapa, turun, kantor, dewasa, setinggi, pusat, batu, gagal, pratama) | |||
| Topic 17 | Area, river, go home, easy, outside, rain, jaya, puri, causes, hopefully | ||
| (Daerah, kali, pulang, mudah, luar, hujannya, jaya, puri, gegara, mudahan) | |||
| surrounded, ready, environment, flooded, access, trust, kelapa (an area), study, ciracas, government | |||
| Topic 18 | (dikepung, siap, lingkungan, kebanjiran, akses, percaya, kelapa, belajar, ciracas, pemerintah) | ||
| Bekasi, highway, causes, deserted, traffic jams, ajah, tomang, city, severe, Tangerang | |||
| Topic 9 | (Bekasi, raya, penyebab, sepi, kemacetan, ajah, tomang, kota, parah, Tangerang) | ||
| Traffic jams, streets, weather, night, want to use it, ampe, room, twitter, name | |||
| Topic 19 | (Macet, jalanan, cuaca, malem, pengen, pake, ampe, kamar, twitter, namanya) | Traffic jam caused by flood | |
| The water, help, season, calamity, usually, ciledug, trap, ask, kayak, come | |||
| Topic 3 | (Airnya, bantuan, musim, musibah, biasanya, ciledug, kejebak, minta, kayak, datang) | ||
| Economy, hehehe, trisakti, decline, tax, continue, optimal, need, blame, recovery | Flood damage and costs | ||
| Topic 14 | (Ekonomi, hehehe, trisakti, menurun, pajak, lanjutin, optimal, butuh, salahin, pemulihan) | ||
| Victim, market, amen, nature, when, guesthouse, tangerang, front, anies, enter | |||
| Topic 16 | (Korban, pasar, aamiin, alam, kapan, wisma, tangerang, depan, anies, masuk) | ||
| Place, like that, scared, middle, standby, rich, cleaning, because, used, ask | |||
| Topic 20 | (Tempat, gitu, takut, tengah, siaga, kaya, bersihin, garagara, bekas, tanya) | ||
| Heavy, child, later, drizzle, sleep, front, small, battalion, munarman, thought | |||
| Topic 7 | (Deres, anak, ntar, gerimis, tidur, depan, kecil, batalion, munarman, kepikiran) | ||
| New, rain, east, see, housing, disaster, return, help, villa, the rain | |||
| Topic 12 | (Baru, ujan, timur, liat, perumahan, bencana, balik, bantu, villa, ujannya) | Weather report | |
| Electricity, happened, lights, ancol, blackout, red, grogol, broke, daan, traffic | |||
| Topic 21 | (Listrik, terjadi, lampu, ancol, pemadaman, merah, grogol, mogot, daan, lalin) | ||
| Safe, work, direction, submerged, because sunday, village, love, thank, up | |||
| Topic 1 | (Aman, kerja, arah, terendam, gara, minggu, kampung, kasih, terima, atas) | Power outage | |
| Stay, complex, safe, west, during, altitude, muddy, effort, hot, overcast | |||
| Topic 5 | (Tinggal, komplek, selamat, barat, selama, ketinggian, mulu, usaha, panas, mendung) | ||
| Residents, location, height, kemang, ahok, yesterday, no, handling, stopping, impact | |||
| Topic 6 | (Warga, lokasi, tinggi, kemang, ahok, kemaren, engga, penanganan, berenti, imbas) | Submerged house | |
| House, old, river, yesterday, important, finished, arrived, mountain, Semeru, in the area | |||
| Topic 8 | (Rumah, lama, sungai, kmrn, penting, kelar, nyampe, gunung, seru, didaerah) | ||
| Alhamdulillah, the era, once, caring, dark, holiday, smooth, flooded, governor, Anies | |||
| Topic 10 | (Alhamdulillah, jaman, sekali, peduli, gelap, libur, lancar, kebanjiran, gubernur, Anies) | ||
| Topic 2 | rain, even though, post, then, eye, reason, stay, safe, sleep, tangerang | ||
| (hujan, padahal, kiriman, trus, mata, alasan, stay, safe, tidur, Tangerang) | |||
| recede, start, enthusiasm, area, moderate, fast, fast, safe, stay, flood | |||
|---|---|---|---|
| Topic 13 | (surut, mulai, semangat, kawasan, sedang, cepet, cepat, safe, stay, banjirnya) | Sympathy and support | |
| song, indonesia, time, big, get, look for, origin, find, jewel, signal | |||
| Topic 15 | (pagi, indonesia, waktu, besar, dapet, nyari, asal, nemu, permata, sinyal) | ||
Source: Personal data research, 2023
A reduction in the number of tweets that can be automatically labeled by LDA was observed during the topic exploration process. One of the settings in LDA, which determines the minimum number of tokens or characters in a word that contribute to a tweet, caused this reduction. As a result, LDA classified some tweets as empty, meaning they contained no characters or words. The number of tweets used in the taxonomy of public responses was 13,725, which is lower than the initial count of 14,298 tweets.
Table III Proportion of Total Tweets for Each Topic Per Period
| Total of Tweets | Total Tweets Proportion | |||||
|---|---|---|---|---|---|---|
| Topic | Flood 2015 | Flood 2020 | Flood 2021 | Flood 2015 | Flood 2020 | Flood 2021 |
| Flood damage and costs | 414 | 805 | 267 | 9,79^ | 11,31% | 11,21% |
| Traffic jam caused by flood | 176 | 232 | 105 | 4,16% | 3,26% | 4,41% |
| Flood damage and costs | 330 | 599 | 167 | 7,81% | 8,42% | 7,01% |
| Weather report | 1773 | 2805 | 885 | 41,93% | 39,42% | 37,17% |
| Power outage | 96 | 90 | 19 | 2,27% | 1,26% | 0,80% |
| Submerged house | 938 | 1851 | 655 | 22,19% | 26,01% | 27,51% |
| Sympathy and support | 501 | 734 | 283 | 11,85% | 10,31% | 11,899% |
Source: Personal data research, 2023
Based on the time periods of Jakarta's floods, the analysis of public response topics on the Twitter social media platform categorizes them into 7 major topics. We construct this topic analysis by proportionally assigning each flood-related tweet from Jakarta residents to each flood period. This approach allows us to compare the dominant topics in each period. Figure 4 below reveals a general similarity in the topic category pattern for the floods of 2015, 2020, and 2021. The pattern differs during the flood of 2020, where the "Sympathy and Support" topic category has a lower proportion compared to the "Road Closures" topic category, while the opposite occurs during the floods of 2015 and 2021.
The "Weather Reports" category dominates the tweets from DKI Jakarta residents during the floods of 2015, 2020, and 2021. This category has the highest proportion, despite a declining trend. The next category is "Houses Submerged," which consistently accounts for over 20% of tweets during each observation period and shows an increasing trend. This information is valuable for decision-makers, as it indicates that tweets from residents whose houses are submerged or who witness houses being submerged have a significant and increasing proportion.
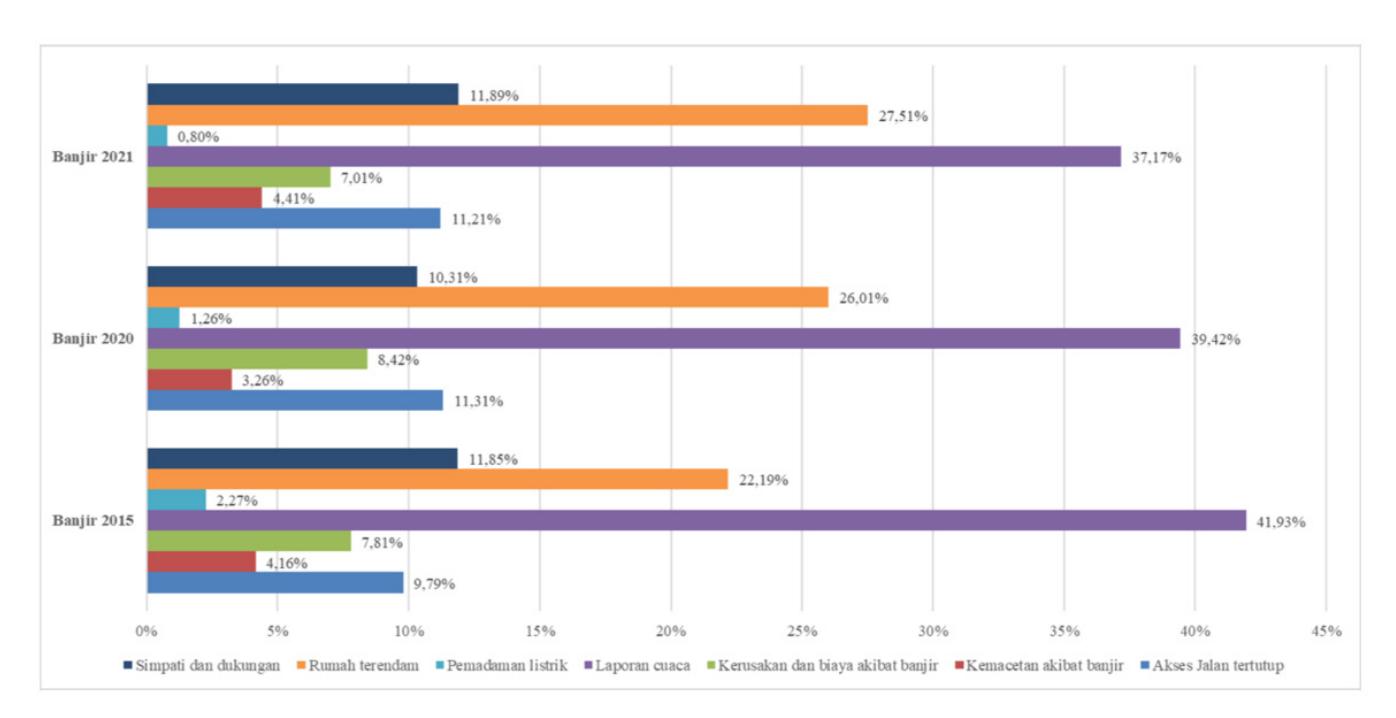
Figure 4 Proportion of Topics for Tweets by Jakarta Residents for Each Flood Period Source: Personal documentation, 2023
Conclusion
This project demonstrates that social media platforms such as Twitter serve as valuable resources for understanding public responses during natural disasters such as floods. This project utilizes Twitter data and applies topic modeling analysis (LDA) to uncover the 7 major topic clusters or issues that Jakarta residents focus on during significant flood events. These topics include (1) road closures, (2) traffic jams due to floods, (3) damage and costs resulting from floods, (4) weather reports, (5) power outages, (6) houses submerged, and (7) sympathy and support. The "Weather Reports" and "Houses Submerged" topic categories have the highest proportions of tweets related to flooding in Jakarta. The LDA topic modeling identified seven major topics that form the basis of the presented conclusion. These topics can serve as a reference for providing information to the public regarding (1) road closures, (2) traffic jams due to floods, (3) damage and costs resulting from floods, (4) weather reports, (5) power outages, (6) houses submerged, and (7) empathy and support.
In delivering public communication content to the community, a range of styles of language and visualizations tailored to these seven topics are necessary. For instance, we can create infographics on traffic congestion in affected areas, disaster damage, and empathetic messaging, in addition to weather forecasts that prepare the public for upcoming activities and other considerations.
Twitter, as a social media platform, serves as an avenue for DKI Jakarta residents to express their complaints, emotions, and opinions regarding the events they experience, such as floods. The government of DKI Jakarta needs to supplement these user-generated tweets with additional data and information to ensure more accurate and targeted actions or policies. The analysis reveals that the "Houses Submerged" topic has a considerable proportion and shows an increasing trend in each flood period. Policymakers need to anticipate this to improve flood mitigation, which includes planning evacuation routes and designated shelters for flood-prone areas and submerged houses.
We have not fully optimized the collected Twitter data in terms of data cleaning. Some shortcomings include (1) the absence of a filter to determine whether tweets pertain to Jakarta floods or not, (2) the limited use of stop words, (3) the lack of stemming processes, and (4) the absence of normalization or correction for typo characters or word abbreviations. The Twitter data does not differentiate between the Twitter accounts of DKI Jakarta residents and others, such as government accounts, bot or fake accounts, media accounts, etc. This inherently introduces bias in determining whether tweets about floods are indeed from DKI Jakarta residents or not.
Addressing the limitations of the previous study and incorporating additional features or analyses to enhance the usefulness of the research output warrants further research. Future studies on the same topic can focus on improving various aspects, as mentioned in the limitations section. Additionally, we can enhance the spatial aspect by incorporating spatial-temporal analysis to gain more detailed insights into the specific regions within DKI where tweets and their corresponding topics originate.