
INFO ARTIKEL
ABSTRAK
Kata kunci: emisi, sampah, RDF, TPA
Sejumlah kota menghadapi masalah serius akibat peningkatan volume sampah. Timbulan sampah yang terus meningkat berpotensi menyebabkan overcapacity, serta meningkatkan emisi gas rumah kaca (GRK). Penelitian ini bertujuan untuk mengestimasi timbulan sampah yang masuk ke TPA Galuga, potensi emisi GRK yang dihasilkan dari TPA Galuga, serta menganalisis penerapan teknologi RDF yang dapat
mereduksi jumlah sampah. Penelitian ini menggunakan Multiple Linear Regression (MLR) untuk mengetahui faktor-faktor yang memengaruhi timbulan sampah, Guidelines for National Greenhouse Gas Inventories Vol.5 (Waste) untuk mengestimasi potensi emisi GRK TPA Galuga, serta analisis kelayakan finansial untuk mengetahui kelayakan penerapan teknologi RDF. Hasil penelitian menunjukkan jumlah sampah yang masuk ke TPA Galuga tahun 2022 sebesar 195.787,10 ton dan meningkat 2,43% pada tahun 2030 menjadi 200.544,26 ton. Potensi emisi GRK dari timbulan sampah TPA Galuga berkisar 109 kt CO2e pada tahun 2030, turun 29,48% dari tahun 2022. Rencana penerapan teknologi RDF layak dijalankan secara finansial karena memenuhi kriteria kelayakan NPV, IRR, B/C Ratio, dan Payback Period. Oleh karena itu, pemerintah dapat memberikan berbagai insentif untuk mendorong penerapan teknologi RDF, pemilahan sampah yang lebih ketat sangat penting untuk meningkatkan kualitas RDF, dan menarik investasi swasta melalui kemitraan pemerintah dan swasta dapat meningkatkan infrastruktur RDF.
Introduction
Social and economic development is intricately connected to climate change (Metz & Kok, 2008). Economic growth impacts individuals' socioeconomic status and lifestyles, as well as public and environmental health (Al-Salem et al., 2018; Kolekar et al., 2016). Activities related to production and consumption are significant contributors to climate change. The reliance on fossil fuels, the generation of waste, and the exploitation of natural resources within these economic activities result in natural resource degradation and heightened greenhouse gas emissions (Metz & Kok, 2008).
The Intergovernmental Panel on Climate Change (IPCC) (2022) reported that in 2010-2019, average GHG emissions were at the highest level in human history. This impacts climate change, leading to phenomena such as extreme weather, flooding in some regions, heat waves, and droughts. If the increase in GHG emissions is not prevented, the earth's temperature will increase by 1.5°C (IPCC, 2006).
The Ministry of Environment and Forestry (KLHK) determines several sectors that make the most significant contribution to the increase in national GHG emissions, namely the forestry and peat fire sector (50%), the energy sector (34%), the waste management sector (7%), the agriculture sector (6%), and the Industrial Process and Product Uses (IPPU) sector (3%) (KLHK, 2021). Indonesia is trying to reduce the amount of waste in landfills as a form of effort to reduce GHG emissions generated by the waste sector of 134.119 Gg t CO2e, with details of 49.46% from industrial liquid waste, 32.65% domestic solid waste, 17.79% domestic liquid waste, and 0.10% industrial solid waste (KLHK, 2020). Municipal solid waste consists of various compositions, such as food waste, recycled waste, or hazardous toxic waste (B3), such as batteries, pharmaceutical waste, paint, and etc.
Waste generated in developing countries has different characteristics from developed countries (Han et al., 2019). China serves as one example, where organic waste, such as food waste, dominates municipal solid waste and contains little recycled waste. This results in wet waste characteristics that contain much water (Kolekar et al., 2016). The same characteristics are also found in Indonesia, where waste conditions are mixed, contain much water, and the composition of municipal solid waste is dominated by organic waste, especially food waste (SIPSN, 2023).
Waste management is a significant challenge faced by many countries, including Indonesia. Bogor City, located in West Java, ranks sixth among the cities in the region for waste production, generating approximately 673.76 tons of waste per day, which totals around 245,922.33 tons annually (SIPSN 2021). The rising waste volume, limited landfill capacity, and inadequate waste management systems pose serious issues in urban areas. The increasing generation of waste can lead to landfill accumulation and increased GHG emissions. The condition of waste that is piled up and not processed will produce carbon emissions referred to as GHG. UNFCCC (2008) revealed that there are six types of gases classified as GHGs, namely carbon dioxide (CO₂), methane (CH₄), nitrous oxide (N₂O), sulfur hexafluoride (SF₆), perfluorocarbons (PFCS), and hydrofluorocarbons (HFCS). Prabowo et al. (2019) revealed that as much as 61.37% of the waste pile in the landfill is organic waste and will undergo an anaerobic decomposition process into CO₂, CH₄, and other types of gas. CO₂ is ranked first as the primary contributor to GHG, and CH₄ is second (Artiningrum, 2018).
GHG emissions from waste management are mostly CO₂, CH₄, and N₂O. CH₄ emissions result from the anaerobic decomposition process, while CO₂ emissions result from aerobic and anaerobic decomposition processes (Wahyudi, 2019). The waste management method at Galuga Landfill still partly uses an open dumping system, causing some of the waste decomposition process to occur anaerobically, producing CH₄.
Waste management technology is crucial for reducing waste volume and greenhouse gas emissions from the waste sector. Key processing methods include sanitary landfills, composting, and RDF (Refuse-Derived Fuel). Notable landfills in Indonesia using these technologies are Balikpapan City, Bantar Gebang, and Muara Fajar (Winahyu et al., 2019; Zahrina & Yenie, 2021). Bantar Gebang started implementing RDF in 2022, managing 100 tons per day (Prihartanto et al., 2022). RDF technology helps convert combustible waste into fuel, minimizing urban waste and lowering emissions. By adopting RDF, the Bogor City government could effectively address waste management in the Galuga landfill and create marketable products.
Understanding the amount of waste generated and the emissions produced by Galuga Landfill is crucial for policymakers. This information enables the government to evaluate how waste management practices at the landfill impact potential greenhouse gas (GHG) emissions. Furthermore, the government can leverage the findings from the RDF project feasibility analysis to make informed decisions about effective GHG reduction strategies, aligning with the goals outlined in Indonesia's National Action Plan for Reducing Greenhouse Gas Emissions (RAN-GRK). This plan is further detailed through the Regional Action Plan for Reducing Greenhouse Gas Emissions (RAD-GRK) for Bogor City. The objective of this research is to identify strategies to mitigate GHG emissions resulting from waste generation in Bogor City. To accomplish this overarching goal, we will address three specific objectives:
- 1. Estimating the potential volume of waste from Bogor City entering Galuga Landfill by 2030,
- 2. Estimating the potential GHG emissions from Bogor City waste at Galuga Landfill by 2030, and
- 3. Analyzing the financial viability of waste processing utilizing RDF technology at Galuga Landfill.
Methods
This research is focused on Galuga Landfill, Cibungbulang Subdistrict, Bogor Regency, West Java. This location was chosen purposively because this landfill is the only landfill that serves as the Bogor City Landfill and, at the same time, the Bogor Regency Landfill. This research was conducted from September 2022 to July 2023. It began by conducting literature studies through books and journals, studying the methods used in the research, and field observations.
Types and Data Sources
The data utilized in this research is secondary in nature. The collection of secondary data focused on aspects related to population, economy, and environment, sourced from relevant agencies such as BPS West Java, Badan Pusat Statistik (BPS) Bogor City, the IPCC, KLHK, SIPSN, the Investment Coordinating Board (BKPM), and the Regulation of the Minister of Home Affairs of the Republic of Indonesia (Permendagri). The data encompasses literature studies from related research findings, along with some default data provided by the IPCC guidelines and the default data outlined in Permendagri Number 7 of 2021.
Data Processing and Analysis Methods–Quantitative Analysis Using Multiple Linear Regression (MLR)
Regression analysis has the aim of determining the relationship between explanatory variables (independent) and response variables (dependent) from a set of data (Juanda, 2019). This study uses the MLR model to determine which independent variables significantly affect the dependent variable. The dependent variable used in this study is Bogor City waste generation (TS). Meanwhile, the independent variables used are population (JP), GDP of Bogor City (PD), and domestic investment (PMDN). Data related to TS, PD, and DN variables are available in the range of 2006-2022. In the meantime, we have data for the JP variable from 2000 to 2022 and will forecast it for 2023 to 2030. Table I provides a detailed description of all variables used in this study.
| No | Variable | Unit | Description | |
|---|---|---|---|---|
| 1. | TS | Bogor City waste generation | Tons per year | The amount of waste arising from the community in an area in units of volume and per capita per day. This variable is the variable that will be predicted |
| 2. | JP | Population | Million people per year | The total population of Bogor City |
| 3. | PD | GRDP of Bogor City | Million IDR per year | GRDP value of Bogor City |
| 4. | DN | Domestic investment (PMDN) | IDR per year | The most dominant form of business entity used in various business activities in Indonesia |
Table I Variables' Description
The hypotheses in this study are as follows a. Total population (JP)
The higher the percentage of the population, the higher the amount of waste generated by an area (Araiza-Aguilar et al., 2020).
b. GRDP of Bogor City (PD)
A person's income level will affect the level of consumption of goods and services an individual uses. High income encourages a person to be more consumptive (J. Liu et al., 2019). Economic activities like consumption or production will encourage waste generation (Ercolano et al., 2018; Kolekar et al., 2016). The relationship between GRDP and accumulation differs between literatures. However, this variable is expected to affect municipal solid waste generation positively.
c. Domestic Investment (PMDN Bogor City) (DN)
PMDN is Indonesia's most widely used form of business entity because it has a clear legal basis. PMDN is the choice of foreign investors interested in developing businesses close to foreign ownership. Investment development will encourage the development of a country's industrialization, modernization, and digitalization (Cheng et al., 2020). The rapid economic growth of an area will affect the amount of waste generated by the area (Annepu, 2012). Therefore, this variable is expected to affect the amount of waste generated in Bogor City positively.
The MLR model has been widely used in various countries such as China, India, and Iran to determine the factors that influence the amount of waste generation (Azadi & Karimi-Jashni, 2016; Kumar & Samadder, 2017; J. Liu et al., 2019). The model formulation to estimate the factors that influence the amount of waste generation in Bogor City is as follows:
\[TS_t = \beta_0 + \beta_1 I P_t + \beta_2 P D_t + \beta_2 D N_t + \varepsilon\]
Where the estimated parameter of
: waste generation volume of Bogor City in year t (tons/year),
: the total population of Bogor City in year t (million people/year),
: GRDP of Bogor City in year t (million IDR/year),
: PMDN Bogor City in year t (IDR/year),
: error.
Forecasting Method Using ARIMA Model (Box-Jenkins Method)
Forecasting methods are classified into two types: qualitative and quantitative. This research uses quantitative forecasting methods that involve statistical analysis of past data (Firdaus, 2020). The Box-Jenkins method will be used to predict the population data of Bogor City in 2023-2030. The Box-Jenkins Method is a systematic method for identifying and examining data using the ARIMA (autoregressive integrated moving average) model. ARIMA is one of the models that can represent stationary and nonstationary time series and produce accurate forecasts based on a description of the historical data of a variable (Nasir et al., 2021).
Estimation of Potential GHG Emissions in Landfills
The IPCC 2006 Guidelines for National Greenhouse Gas Inventories Vol. 5 (Waste) is the analysis method used to estimate potential GHG emissions in landfills. CH4 emissions from landfills can be estimated using Equation 2. The amount will vary according to the waste composition, amount, age, and moisture content of the waste (Mohan & Joseph, 2021). The estimated CH4 emissions released from the Galuga landfill can be calculated using the following formula:
\[EML_{t} = \left[\sum_{j}^{t} EMH_{j,t} - R_{t}\right] \times (1 - OX_{t})\]
Where:
: CH4 emissions released in year t (tons),
: CH4 emissions generated from waste type j in year t (tons),
: recoverable CH4 gas in year t (tons),
: oxidation factor in year t.
a) The CH4 emission generated from waste type j in year t is estimated using the following formula:
\[EMH_{j,t} = DDOC_m \ dekomp_t \times F \times \frac{16}{12}\]
Notes:
DDOCmdekompt : decomposed DDOC mass in year t,
F : CH4 fraction based on the volume of CH4 gas produced by the landfill,
: molecular weight ratio of CH4/C, m : mass of waste disposed of (tons).
DDOCm is part of the organic carbon that will decompose during anaerobic landfill conditions. The index m is used for mass, and DDOCm is equal to the mass of waste disposed (W) (IPCC, 2006).
b) The decomposed in year t (tons) ( is estimated as follows:
\[DDOC_m \ dekomp_t = DDOCma_{t-1} \times (1 - e^{-k})\]
Where:
DDOCmat−1 : mass of DDOC accumulated in the landfill at the end of year t-1 (tons), k : reaction constant (ln ln (2) / )(y-1),
: half-life.
c) The DDOCm accumulated in the landfill at the end of year t (tons) (DDOCmat) is estimated as follows:
\[DDOCma_t = DDOCmd_t + (DDOCma_{t-1} x e^{-k})\]
Where:
DDOCmat : the mass of DDOC accumulated in the landfill at the end of year t (tons),
DDOCmdt : the mass of DDOC deposited into the landfill in year t (tons).
d) The potential CH4 generation from the mass of decomposed DDOCm (mass of degradable organic material) of waste deposited in the landfill and the total potential CH4 generation from waste remaining in the landfill can be estimated using the following formula:
\[L_o = DDOC_m \times F \times \left(\frac{16}{12}\right)\]
Where:
Lo : potential CH4 gas formed (tons), DDOCm : mass of decomposed DOC (tons).
e) The decomposition process of entering the landfill can be estimated as follows:
\[DDOC_m = W \times DOC \times DOC_f \times MCF\]
Where:
W : mass of waste disposed of (tons), DOC : organic carbon degradation fraction,
DOCf : fraction of DOC that can be decomposed under anaerobic conditions,
MCF : CH4 correction factor for aerobic decomposition.
f) The calculation of the organic carbon degradation fraction can be estimated using the following formula:
\[DOC = DOC_j \times W_j\]
Notes:
DOCj : fraction of organic carbon degradation of waste type j,
Wj : mass of waste type j disposed (tons).
Financial Feasibility Analysis
Financial analysis is used to determine the feasibility of a project. The financial feasibility analysis of the RDF project was analyzed using several calculation criteria, namely Net Present Value (NPV), Internal Rate of Return (IRR), Benefit Cost Ratio (B/C Ratio), and Payback Period (PP). The estimated value was analyzed using data processing software, namely Google Sheet. The inflow component in the RDF
project plan is obtained from the sale of RDF products and the Galuga landfill budget listed in the 2019-2024 RPJMD of Bogor City. The outflow component consists of the investment and operational costs of the RDF project.
a. Net Present Value (NPV)
Net Present Value is defined as the difference between the present value of inflow in year y, PVINFy, and the present value of outflow in year y, PVOUTy, over the period [0,Y]. If NPV> 0, then the project is said to be feasible and vice versa (Gotze et al., 2008). NPV is formulated as follows:
\[NPV = \sum_{v=0}^{t} PVINFy - \sum_{v=0}^{t} PVOUTy\]
b) Internal Rate of Return (IRR)
IRR is the percentage rate of return calculated for each year invested. IRR will depend on the same formula as NPV. Therefore, IRR is the discount rate value that makes NPV equal to zero. The project is feasible if the IRR exceeds the discount rate (Gotze et al., 2008). IRR is calculated using the following formula:
\[IRR = r_1 + \frac{NPV_1}{NPV_1 - NPV_2} (r_1 + r_2)\] where:
NPV1 : Positive NPV nearest 0,NPV2 : Negative NPV nearest 0, r1 : Cost of capital that causes the positive NPV, r2 : Cost of capital that causes the negative NPV.
c) Benefit-Cost Ratio (BCR)
BCR is an assessment to see the efficiency of a project. The BCR value shows the value of additional benefits returned for every Rupiah invested in a project. BCR is the ratio of PVINFy to PVOUTy. Thus, the BCR calculation is expressed using the following equation (Gotze et al., 2008):
\[NPV = \sum_{v=0}^{t} PVINFy / \sum_{v=0}^{t} PVOUTy\]
PV INFy dan PV OUTy are formulated as follows:
\[PVINFy = \frac{1}{(1+r)^y} \times \sum_{y=0}^{t} PVINFy\]
\[PVOUTy = \frac{1}{(1+r)^y} \times \sum_{v=0}^t PVOUTy\]
Where r is the interest rate (% per year).
d) Payback Period (PP)
The Payback Period is an investment feasibility assessment seen through the payback period of investment capital and business period. According to Sobana (2018), PP calculations, in general, can be seen in the following formula:
\[PP = n + \frac{a+b}{c-b} \times 1 \text{ year}\]
where:
n = The last year when the amount of cash flow still does not cover the initial investment costs, a = Initial investment amount, b = Cumulative amount of cash flow in year n, c = Cumulative amount of cash flow in year n + l.
Valuation indicators:
- a) PP < project life or a specified time, then the project is feasible.
- b) PP > project life or a specified time, then the project is not feasible.
Switching Value Analysis
There is uncertainty in running a business because various dynamic factors influence it. Any change in the value of the revenue and expenditure components will affect the business's feasibility. This analysis determines the limit of change in sensitive components of revenue or expenditure until the business is at the limit of feasibility. We conduct this experiment at the minimum level where the business can make a profit or is feasible, defined as NPV = 0 (Gittinger, 1986). An NPV equal to zero leads to an IRR equal to the interest rate and a B/C ratio equal to one. A business undertaking can experience changes due to four main problems: prices, cost increases, delays in implementation, and results. This analysis was conducted on changes in RDF price, DLH Kota Bogor operational budget, and fuel.
Results and Discussion
The research results on the factors influencing Bogor City's waste generation show some exciting findings, detailed in Table II The model generated from the quantitative analysis using MLR has passed the classical assumption test.
Projected Waste Volume from Bogor City to Galuga Landfill by 2030
The R-squared value generated in this model is 0.7075. This shows that the coefficient parameter values and data from each variable can be explained through the model in equation 15 and the actual level of 5%. From several alternative models, the best model is obtained as follows:
Table II Predicted Socio-Economic Factors on Waste Generation in Bogor City
| lnTS | Coef. | Std.Err. | t | P > |t | | [95% conf.interval] | |
|---|---|---|---|---|---|---|
| JP | 3.09E-06 | 5.90E-07 | 5.23 | 0.00 | 1.81E-06 | 4.36E-06 |
| PD | -3.04E-08 | 5.91E-09 | -5.15 | 0.00 | -4.32E-08 | -1.77E-08 |
| DN | 1.14E-12 | 8.93E-13 | 1.28 | 0.22 | -7.89E-13 | 3.07E-12 |
| _cons | 10.12 | 0.47 | 21.42 | 0.00 | 9.10 | 11.15 |
With a population growth rate of 4.45% in 2022, Bogor City ranks fourth in West Java as a city with a high population density. Population significantly has a positive relationship with waste generation with a coefficient of 3.09E-06 (see Table II). This graph shows that if the population scale increases by 1 million people, the amount of waste generated increases by 3.09E-06%. An increase in population will cause an increase in demand, such as for food, clothing, shelter, and travel, which will increase municipal solid waste generation.
Besides population, GRDP is also considered to play an essential role in the accumulation of municipal solid waste (Mazzanti et al., 2008). The correlation between the GRDP of Bogor City and waste generation can be seen in Table II. In this study, GRDP has a negative relationship with the waste generated by Bogor City, with a coefficient of 3.04E-08. This shows that if GRDP increases by 1 unit, the waste generated will decrease by 3.04E-08%. This condition occurs in several regions, such as those in Western China, where rapid economic development is also indicated to encourage economic development that can reduce pollution through government policies related to waste reduction and the use of technologies to reduce waste generation (Cheng et al., 2020).
The PMDN variable has a positive relationship with waste generation in Bogor City, with a coefficient value of 1.14E-12. The result indicates that an increase in PMDN by 1 unit will increase the amount of waste generated in Bogor City by 1.14E-12%. However, the increase's value is small compared to other variables. This positive effect occurs because the realization of FDI in Bogor City is dominated by the tertiary industry sector, which is indicated to be one of the leading sectors and the sector that drives the largest waste generation when compared to the primary and secondary industry sectors (Cheng et al., 2020; Liu & Wu, 2011).
Research on estimating waste generation has garnered significant attention from scholars. In this context, we estimated the potential waste generation for Bogor City through 2030 using annual data that reflected the city's population growth percentage. Figure 1 illustrates the population forecasting results for Bogor City between 2023 and 2030, which indicate a consistent upward trend each year. These forecasting results consider factors such as mortality, fertility, and migration. The population estimates for 2023 to 2030 were derived from Bogor City's population data from 2000 to 2022, employing the ARIMA method.
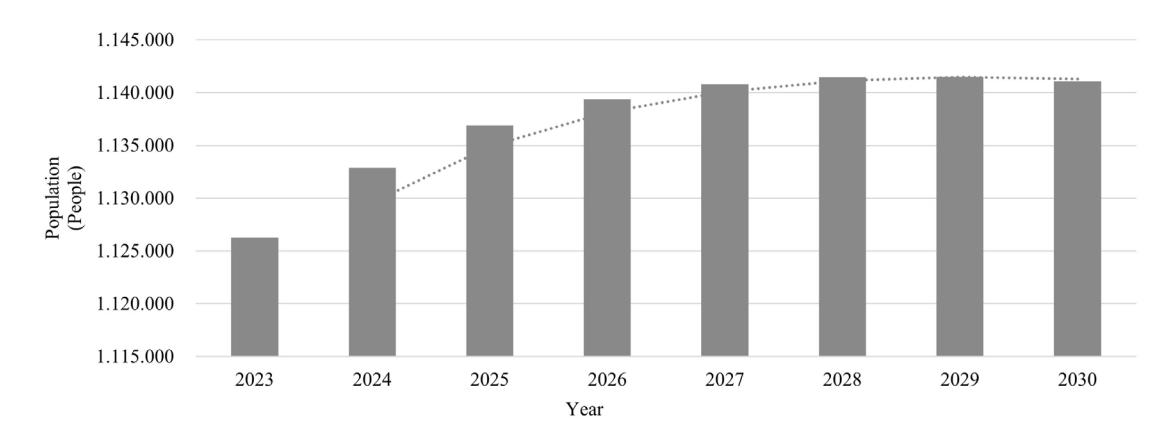
Figure 1 Projected Bogor Population of Bogor City 2023-2030
Figure 2 illustrates the amount of waste generated in Bogor City, along with the quantity transported to the Galuga Landfill. These figures are based on forecasts that consider the percentage of population growth, with projections extending until 2030. The discrepancy between the two amounts arises from the assumption that the waste transported to the Galuga Landfill has been reduced by waste diverted to TPS3R (Temporary Waste Management Sites), waste banks, incineration, disposal into rivers, and losses during transportation. The estimation indicates a potential increase in waste generation in Bogor City, with projected totals of 246,041.75 tons per year generated and 200,544.26 tons per year entering the Galuga Landfill by 2030 (see Figure 2).
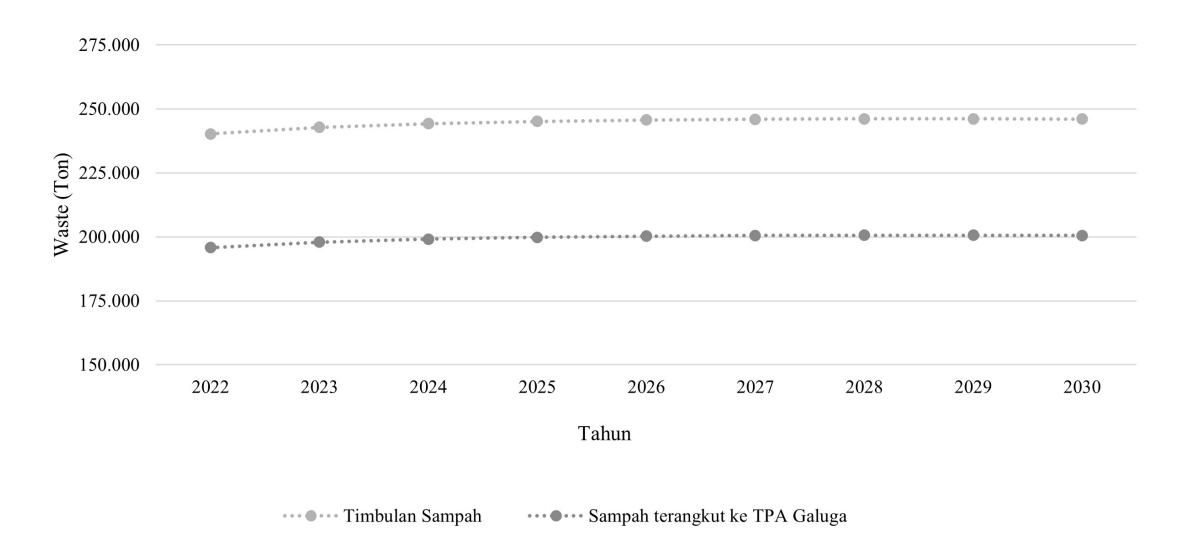
Figure 2 Bogor City projected waste generation and residue 2022-2030
Potential GHG Emissions from Bogor City Waste in Galuga Landfill Until 2030
Landfilling of waste generated by Bogor City is conducted at the Galuga Landfill. Waste transportation is conducted using two types of trucks, namely dump trucks and arm rolls. However, this study only calculates GHG emissions from the landfilling process and does not consider GHG emissions in the waste transportation process. Data related to the amount of waste entering the Galuga landfill in calculating GHG emissions will refer to the data generated in the results of research objective 1. GHG emissions generated by a landfill are estimated using the first-order decay method established by IPCC 2006, considering the GHG calculation parameters, namely, DOC value, DOC fraction in anaerobic state (DOCf), CH4 correction factor (MCF), CH4 fraction in landfills, and CH4 formation reaction constant (k).
In addition to the IPCC 2006 default data, specific data such as the amount of waste entering the Galuga landfill, the percentage of waste composition, the type of management used by the Galuga landfill, and waste per capita are needed to estimate the potential CH₄ in the Galuga landfill. These data will be inputted into the IPCC 2019 Refinement to the 2006 Guidelines for National Greenhouse Gas Inventories spreadsheet and automatically estimate the default data and specific data from Bogor City.
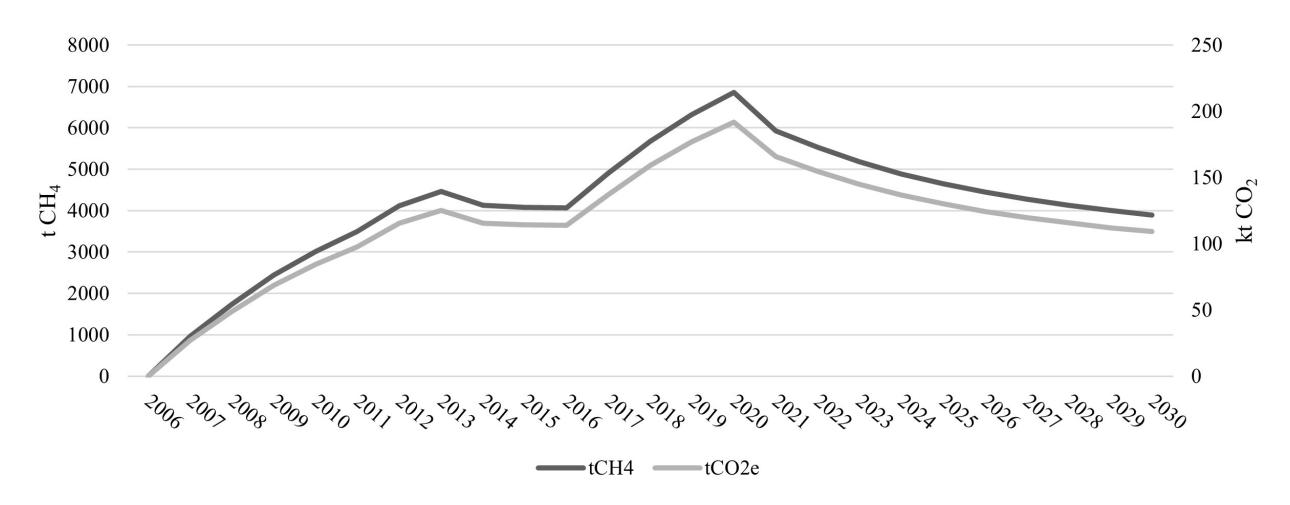
Figure 3 Potential and projected CH4 emissions at Galuga landfill 2006-2030
The total predicted GHG emissions from the existing conditions of the Galuga landfill were obtained assuming that the amount of waste entering the Galuga landfill has remained the same as the amount of waste processed at the Galuga landfill through composting and waste bank management. Therefore, we assume that the amount of waste entering the Galuga landfill is equivalent to that of landfill waste. CH₄ emissions generated in the landfilling stage at Galuga Landfill in 2030 amounted to 109 kt CO₂e. This result can be compared with landfilling in China using the sanitary landfill method without energy recovery, which produces CH₄ only 69 kt CO₂e (Du et al., 2017).
The results showed a decrease in CH₄ emissions starting from 2019-2030. This diminution can occur due to changes in the governance of the Galuga landfill, from poorly managed semi-aerobic (2006- 2018) to well-managed semi-aerobic (2019-2030). Therefore, changes in landfill governance affect the resulting CH₄ emissions. The MCF value for poorly managed semi-aerobic is 0.50, while well-managed semi-aerobic is 0.70 (IPCC 2006).
Potential CH₄ emissions at Galuga Landfill were estimated based on the backfilling process, which has yet to be conducted routinely like a sanitary landfill. The total estimated backfilling done by Galuga Landfill is four times per year and can potentially produce CH₄ emissions of 109 kt CO₂e in 2030. This amount of CH₄ gas emissions is greater than the CH₄ emissions generated by the Bandung City Landfill, which amounted to 76 kt in 2030. This disparity is because this study did not take into account GHG emissions from the transportation and composting process at Galuga Landfill.
Financial Feasibility of RDF Technology Implementation Plan in Waste Management at Galuga Landfill
The financial feasibility analysis of the plan to apply RDF technology in waste processing at Galuga Landfill is carried out by calculating various components of inflow and outflow using the assumption of a technical life of 20 years, which refers to the RDF process calculation data in the document of the Regulation of the Minister of Home Affairs of the Republic of Indonesia Number 7 of 2021 concerning Procedures for Calculating Retribution Rates in the Implementation of Waste Handling. The revenue and cost components may change throughout the year, but they are assumed to be constant for simplicity. Bank Indonesia's benchmark interest rate, or BI 7-Day Reverse Repo Rate (BI7DRR), of 5.75% is the discount rate in this cash flow.
The sale of RDF products is one of the revenue components. The RDF product results from processing municipal waste, with a total of 17,370.49 tons produced per year. Average daily waste production in Bogor City from 2006 to 2022 was 762.67 tons, with 114.40 tons of waste going to the RDF processing site every day, making up 15% of the total. This waste was then turned into 47.59 tons of RDF every day, or 17,370.49 tons of RDF every year. This percentage refers to the management capacity of the Cilacap RDF TPST, which manages 15% of the Cilacap Regency's waste generation and has a waste conversion factor for RDF products of 41.60% (DLH Cilacap, 2020).
Table III Investment Cost Components of the RDF Technology Implementation Plan at Galuga Landfill
| No | Component of Investment Cost | Amount (IDR) |
|---|---|---|
| 1 | Land | 3,000,000,000 |
| 2 | Civil works | 26,000,000,000 |
| 3 | Mechanical Equipment | 43,000,000,000 |
| 4 | Plant Facilities | 9,200,000,000 |
| Total | 81,200,000,000 |
The components of land, civil works, mechanical equipment, and plant facilities are obtained from the Permendagri reference, with a capacity of 146,730 tons per year or 120 tons per day. In addition, operational expenses are composed of four components: operators, electricity, fuel, and maintenance, with adjustments to operator wages based on the Bogor City minimum wage and adjustments to electricity prices per kWh and fuel prices in 2023. Details of operational expenses are presented in Table IV.
Table IV Components of Operational Costs of the RDF Technology Implementation Plan at Galuga Landfill Every Year
| No | Component Operational Cost | Amount (IDR) |
|---|---|---|
| 1 | Operator | 1,570,608,144 |
| 2 | Electricity | 1,394,991,675 |
| 3 | Fuel | 5,111,207,200 |
| 4 | Maintenance | 2,022,117,622 |
| Total | 10,098,924,641 |
Based on Table V, the NPV, B/C Ratio, and IRR values at a discount rate of 5.75% meet the feasibility criteria, making the project feasible. This plan is feasible because the project revenue is supported by the DLH Kota Bogor operational budget every year and the sales of RDF products. However, a decrease in these two factors could potentially only make the project plan feasible once a specific change occurs. In the operational expenditure aspect, fuel is the most sensitive component, so an increase in fuel price at a specific change limit can potentially make the project lose money. Therefore, Table VI analyzes the change limit of the RDF price component, DLH Kota Bogor operational budget, and fuel price.
Table V Financial Feasibility of Implementing RDF Technology in Galuga Landfill
| NPV (IDR) | IRR (%) | B/C Ratio | PP | Financial Feasibility |
|---|---|---|---|---|
| 17,562,717,862 | 19.45 | 1.09 | 4 Years | Feasible |
| 12 Months | ||||
Based on Table VI, at an interest rate of 5.75%, the plan to implement RDF technology in waste management can tolerate a 69.49% decrease in the selling price of RDF. A price decrease that exceeds this figure will make the project unviable. In the operational budget component of DLH Bogor City, the tolerance limit obtained is 80.77%. The project is no longer feasible if the budget is less than this amount. An increase in fuel prices that exceeds 129.35% makes the project unviable.
The RDF technology implementation plan allows for privatization. However, privatization must be considered reasonable because the project's B/C Ratio is only 1.09, indicating that it generates slightly more revenue than its total cost. Privatization will be better if it is supported by government grants or institutions focusing on the environment.
Table VI Results of Switching Value Analysis
| No. | Change | Limit of Changes |
|---|---|---|
| 1 | Decrease in RDF price | 69.49% |
| 2 | Decrease in the operational budget of DLH Bogor City | 80.77% |
| 3 | Increase in fuel price | 129.35% |
Conclusion
The Galuga landfill received a total of 195,787.10 tons of waste in 2022, with a projected increase of 2.43% by 2030 to reach 200,544.26 tons. Various factors, such as population size, Gross Regional Domestic Product (GRDP), and domestic investment (PMDN), influence the waste generation in Bogor City. Among these, population growth is the most significant and impactful factor.
The potential greenhouse gas (GHG) emissions from waste generated in Bogor City at the Galuga landfill are expected to decrease from 2023 to 2030. By 2030, GHG emissions from the Galuga landfill are estimated to reach 109 kilotons of equivalent CO2. This decrease is attributed to a shift in the governance of the landfill from Managed Poorly Semi Aerobic (2006-2018) to Managed Well Semi Aerobic (2019- 2030). Thus, enhancing the quality of landfill management is expected to lead to a reduction in methane (CH₄) emissions.
The proposed implementation of refuse-derived fuel (RDF) technology has been found to be financially viable, satisfying the feasibility criteria of Net Present Value (NPV), Internal Rate of Return (IRR), Benefit-Cost (B/C) Ratio, and Payback Period, with figures of IDR 17,562,717,862, 19.45%, 1.09, and 4 years and 12 months, respectively. These results suggest that RDF could be a sustainable waste management solution, offering economic and environmental benefits by reducing landfill waste and generating renewable energy. Integrating RDF technology could significantly impact on the waste management and energy sectors, promoting similar initiatives in other regions or industries.
As RDF technology is financially viable, several policy implications emerge across environmental, economic, and regulatory areas. First, governments may introduce various incentives to promote the adoption of RDF technology. Second, it may be necessary to implement policies that mandate stricter waste segregation at the source to enhance the quality of RDF. Finally, policies could be crafted to attract private investment through Public-Private Partnerships (PPPs) aimed at developing RDF infrastructure. Additionally, implementing this technology presents opportunities for collaboration with private sector Corporate Social Responsibility (CSR) initiatives and other institutions focused on environmental issues.
The financial feasibility of RDF technology requires further research, with a focus on detailed inflow and outflow components. The Environmental Agency of Bogor City (DLH Kota Bogor) should consider the costs and effectiveness of RDF in waste processing while conducting market surveys to assess the potential consumers of RDF products and their purchasing capacity.