
INFO ARTIKEL
Kata kunci:
dinding interaktif, augmented reality, edutainment, human centered design, user experience questionnaire
ABSTRAK
Dinding Interaktif Vokasi berbasis Augmented Reality (AR) dirancang untuk menampilkan konten dari Direktorat Jenderal Pendidikan Vokasi, meliputi profil dan karya inovatif melalui dinding interaktif. Aplikasi ini bertujuan menjadi pengalaman yang lebih imersif dan menarik, memungkinkan pengunjung untuk bermain, belajar, dan bersenang-senang secara bersamaan dengan teknologi AR. Penelitian ini bertujuan membantu pelajar dan pengunjung mengeksplorasi profil Direktorat Jenderal Pendidikan Vokasi melalui media interaktif berbasis AR. Metode yang digunakan adalah Human-Centered Design (HCD) untuk pengembangan produk dan User Experience Questionnaire (UEQ) untuk evaluasi kepuasan pengguna. Data diperoleh dari 20 responden di acara Vokasi Fest x Kampus Merdeka 2023. Hasil analisis menunjukkan aplikasi Dinding Interaktif Vokasi berbasis AR dinilai "Layak" untuk digunakan, dengan pengalaman pengguna yang interaktif dan menarik. Temuan ini menunjukkan potensi aplikasi sebagai media pembelajaran inovatif yang efektif dalam meningkatkan keterlibatan di lingkungan pendidikan.
Introduction
Augmented reality (AR) technology has penetrated various sectors, such as education, healthcare, entertainment, and military. It enables more immersive interactive experiences and is effective as an information medium (Alfitriani et al., 2021). In education, AR facilitates interactive learning by increasing student engagement. In the context of modern technology, interactive media that uses motion graphics or video to convey an intriguing message is further enriched by the integration of AR technology. The use of this technology allows users to interact with more immersive content and increases the effectiveness of message delivery in the digital age (Carolina, 2022). Therefore, since AR is an attractive visual medium, it can act as an interactive tool to help students who are less motivated in the learning process (Waliyuddin & Sulisworo, 2022).
Research has successfully used AR as a promotional media for Android-based tourist objects to detect target images (markers) and display 3D animation with tourist objects (Dewi & Ikbal, 2022). This research shows the effective utilization of AR as a promotional medium. The Vocational Interactive Wall application, based on Augmented Reality, also utilizes this technology. The Directorate General of Vocational Education in Indonesia uses this interactive wall as a 2D moving image information medium to display its profile.
One of the findings of previous research related to Augmented Reality is the use of the Marker-Based Tracking Method with campus building content as an Augmented Reality object in its application. This research aims to facilitate new students who want to find information about the location of the building that serves as the student's lecture (Yosephine et al., 2022). The results of these studies indicate that the use of augmented reality is an effective information medium. From this study, researchers were inspired by the effectiveness of Android-based Augmented Reality learning media, which is also very effective in providing users with an immersive learning experience (Prayitno et al., 2023).
Based on the existing problems, this research aims to help students or visitors who are keen to learn more about the Directorate General of Vocational Education in Indonesia, which uses Augmented Reality (AR) technology to create an Android-based application consisting of information from the Directorate General of Vocational Education. The use of a smartphone with augmented reality technology integrated into it makes it possible to take pictures of objects using the device's camera in real time without having to search for them online. Based on the description above, the author chose the research title, "Vocational Interactive Wall Design Based on Human-Centered Design with User Experience Questionnaire Measurement."
Method
The Human Centered Design (HCD) method was used in the design of this product. This approach is divided into three phases: ideation, inspiration, and implementation (Khairi et al., 2021; Bax, 2018). This method serves as a user-centered design framework for the creation of the system. To understand people or users, the HCD phase starts with understanding individuals and their needs. The HCD technique iterates to ensure users receive what they need (Khairi et al., 2021).
Figure 1 Stages of the HCD method Source: (Bax, 2018).
The inspiration phase involves the designer in the position that will use the system to understand the problem being faced so that the designer can detect real needs and problems. The goal of the ideation phase is to create a prototype and apply the concepts acquired in the previous phase. The implementation phase aims to overcome the problems identified in the previous phase; ideas and findings will be converted into something useful (Khairi et al., 2021; Bax, 2018). After a user-centered solution has been developed, the next step is to assess its efficacy by determining whether or not it meets the original objectives and making necessary adjustments as it evolves. At this stage, the researcher used the User Experience Questionnaire (UEQ) method to measure the user experience with the interactive product (Putu et al., 2022). UEQ measurements are considered useful because they provide comprehensive results for measuring user experience (Rasio Henim & Perdana Sari, 2020). HCD helps the development of products and services that are more user-friendly, efficient, and visually appealing and provide high customer satisfaction for businesses (Wijaya, 2019).
Population and Sample
Population can be concluded that research can be understood as all elements, including objects and subjects with certain qualities, based on the understanding of several experts (Amin et al., 2023). The study's population consisted of visitors to the Vokasi Fest X Kampus Merdeka 2023 exhibition. Meanwhile, a sample refers to a portion of the population that is used to describe the overall population (Amin et al., 2023). In quantitative research, the minimum recommended sample size is 20 samples, as the amount of data required depends on the level of user agreement during questionnaire participation (Schrepp, 2023). The data collected for this study were collected within two days of the event, and a total of 20 respondents were visitors to the Vokasi Fest X Kampus Merdeka 2023 event.
User Experience Questionnaire
The purpose of the UEQ questionnaire is to measure user experience with interactive products quickly and accurately through user assessment (Putu et al., 2022). UEQ is used in the third phase of HCD for measurement; UEQ can facilitate obtaining comprehensive results from measuring user experience (Rasio Henim & Perdana Sari, 2020). HCD can also shape UEQ development by providing insight into the needs, goals, and behaviors of target users. Understanding these aspects helps in formulating relevant and meaningful questions for the questionnaire. UEQ, on the other hand, serves as a tool to apply the principles of HCD by capturing user feedback and insights. The data collected from this questionnaire can be used for design iterations, bringing it more in line with user needs and preferences. There are 26 questions in this UEQ questionnaire, which are divided into six assessment categories: Attractiveness (how attractive the product looks overall), Clarity (how easy it is to use), Efficiency (whether the user completes the task or process without much difficulty), Precision (whether the user can control how the product interacts with the user), Stimulation (whether the product can inspire the user), and Novelty (how new and innovative the product is).
User Experience Measurement Stage with UEQ
User Experience Questionnaire (UEQ) can measure user experience more broadly and thoroughly because it includes an assessment based on six user experience scales. UEQ has three main aspects, namely attractiveness, pragmatic quality, and hedonic quality. Attractiveness is a pure value aspect, which is the user's impression of the system's attractiveness. Clarity, efficiency, and accuracy are aspects of pragmatic quality, referring to how well a product supports users in achieving their goals during the use of products, systems, and services. As well as that, stimulation and novelty are hedonic qualities that are meant to meet psychological needs rather than tasks, like getting pleasure from using renewable designs and products (Hinderks, 2020; Kollmorgen et al., 2022).
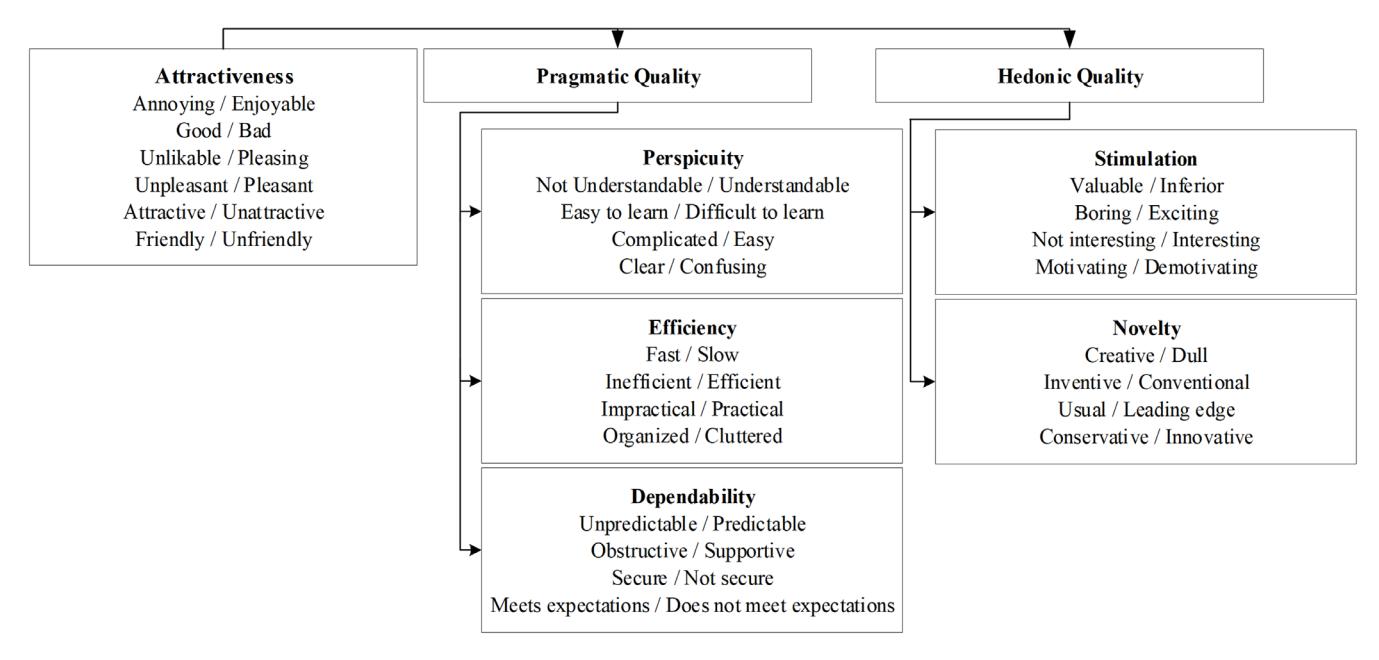
Figure 2 UEQ Scale Structure Assumptions of Pragmatic Quality and Hedonic Quality Source: (Schrepp, 2023).
The questionnaire contains 26 questions and has a rating from 1 to 7. Each question in the UEQ has a positive and negative value. Positive questions are found in the data items placed on the right side, namely 1, 2, 6, 7, 8, 11, 13, 14, 15, 16, 20, 22, and 26. Other positive questions are placed on the left side, namely 3, 4, 5, 9, 10, 12, 17, 18, 19, 21, 23, 24, and 25 (Lestari, n.d.). The pair of positive items highlights the negative questions in the UEQ questionnaire, as each question carries a contradictory meaning. The following is an example of the contents of the UEQ questionnaire. Pairs of significantly different attributes can represent the product from the questionnaire. Circles indicate the gradation between opposing attributes. By choosing the circle that matches their impression, respondents can agree with the attribute. Table I displays the questionnaire questions.
Table I 26 Variables as Basic UEQ Questionnaire Questions
| Question variable in the form of Adjectives | 1 | 2 | 3 | 4 | 5 | 6 | 7 | Question variable in the form of Adjectives | Number |
|---|---|---|---|---|---|---|---|---|---|
| annoying | 0 | 0 | 0 | 0 | 0 | 0 | 0 | enjoyable | 1 |
| not understandable | 0 | 0 | 0 | 0 | 0 | 0 | 0 | understandable | 2 |
| creative | 0 | 0 | 0 | 0 | 0 | 0 | 0 | dull | 3 |
| easy to learn | 0 | 0 | 0 | 0 | 0 | 0 | 0 | difficult to learn | 4 |
| valuable | 0 | 0 | 0 | 0 | 0 | 0 | 0 | inferior | 5 |
| boring | 0 | 0 | 0 | 0 | 0 | 0 | 0 | exciting | 6 |
| not interesting | 0 | 0 | 0 | 0 | 0 | 0 | 0 | interesting | 7 |
| unpredictable | 0 | 0 | 0 | 0 | 0 | 0 | 0 | predictable | 8 |
| fast | 0 | 0 | 0 | 0 | 0 | 0 | 0 | slow | 9 |
| inventive | 0 | 0 | 0 | 0 | 0 | 0 | 0 | conventional | 10 |
| obstructive | 0 | 0 | 0 | 0 | 0 | 0 | 0 | supportive | 11 |
| good | 0 | 0 | 0 | 0 | 0 | 0 | 0 | bad | 12 |
| complicated | 0 | 0 | 0 | 0 | 0 | 0 | 0 | easy | 13 |
| unlikable | 0 | 0 | 0 | 0 | 0 | 0 | 0 | pleasing | 14 |
| usual | 0 | 0 | 0 | 0 | 0 | 0 | 0 | leading edge | 15 |
| Question variable in the form of Adjectives | 1 | 2 | 3 | 4 | 5 | 6 | 7 | Question variable in the form of Adjectives | Number |
|---|---|---|---|---|---|---|---|---|---|
| unpleasant | 0 | 0 | 0 | 0 | 0 | 0 | 0 | pleasant | 16 |
| secure | 0 | 0 | 0 | 0 | 0 | 0 | 0 | not secure | 17 |
| motivating | 0 | 0 | 0 | 0 | 0 | 0 | 0 | demotivating | 18 |
| meets expectations | 0 | 0 | 0 | 0 | 0 | 0 | 0 | does not meet expectations | 19 |
| inefficient | 0 | 0 | 0 | 0 | 0 | 0 | 0 | efficient | 20 |
| clear | 0 | 0 | 0 | 0 | 0 | 0 | 0 | confusing | 21 |
| impractical | 0 | 0 | 0 | 0 | 0 | 0 | 0 | practical | 22 |
| organized | 0 | 0 | 0 | 0 | 0 | 0 | 0 | cluttered | 23 |
| attractive | 0 | 0 | 0 | 0 | 0 | 0 | 0 | unattractive | 24 |
| friendly | 0 | 0 | 0 | 0 | 0 | 0 | 0 | unfriendly | 25 |
| conservative | 0 | 0 | 0 | 0 | 0 | 0 | 0 | innovative | 26 |
UEQ Formulation
Respondents' answers will be converted to data and added to the "Data" page, but the response values will still be displayed on a scale of one to seven.
| Data Conversion | |||||||||||
|---|---|---|---|---|---|---|---|---|---|---|---|
| 1 | 2 | 3 | 4 | 5 | 6 | 7 | |||||
| \(\downarrow\) | \(\downarrow\) | \(\downarrow\) | \(\rightarrow\) | \(\downarrow\) | \(\downarrow\) | \(\downarrow\) | |||||
| -3 | -2 | -1 | 0 | 1 | 2 | 3 | |||||
Figure 3 Conversion data from UEQ scale 1 to 7 to -3 to 3 (Yehezkiel et al., 2023).
The respondents' responses were converted into weighted values between 1 and 7, resulting in a scale with values between -3 (strongly disagree with negative values) and +3 (strongly agree with positive values) or the other way around.
Result and Discussion
The choice to use illustrations created with Adobe Illustrator software in the inspiration section can provide several advantages and support the Human Centered Design (HCD) approach.
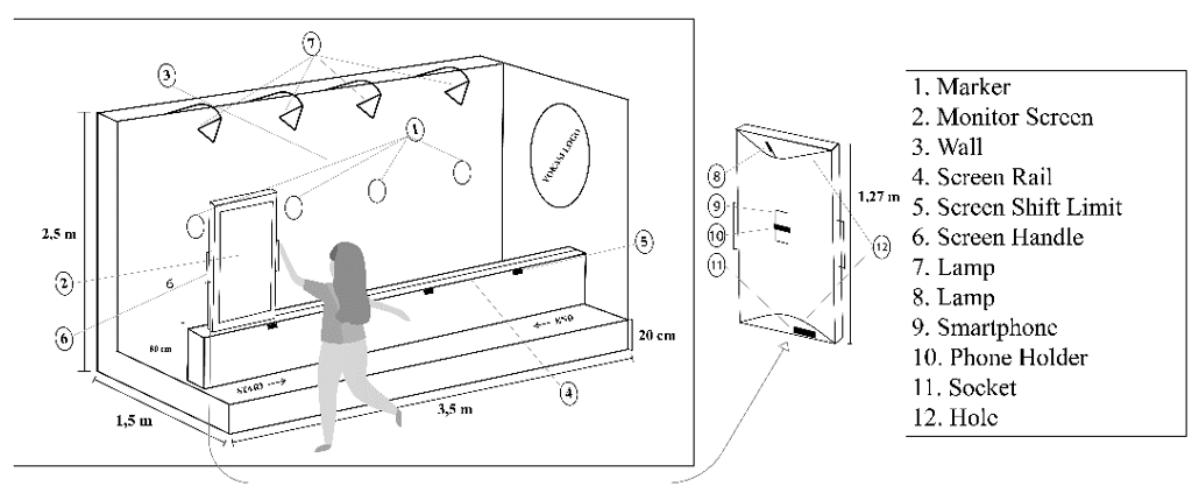
Figure 4 AR-based Vocational Interactive Wall Design and based on features. Source: Personal documentation, 2024
In the picture above, there is a marker as an object that will be detected by the camera before the content is displayed. The monitor screen is a supporting tool for this project because it can display vocational content on a full screen so that users get more experience. Then, the wall is a supporting object for the marker to make it look more immersive. Screen rails support screen movement to make it smoother and more efficient. The screen shift limit is a hint to the user that the screen must be moved until the specified limit mark so that the application can detect images effectively. The screen handle has the same function as the door handle to make it easier for users to shift the screen. Lights as wall and marker lighting. Then, behind the screen, there is a special lamp to help the application detect the marker. Mobile phones are hardware that runs the Augmented Reality-based Vocational Interactive Wall application. A mobile phone holder is a tool that holds the mobile phone and the fan as a mobile phone temperature cooler. Cell phones, screens, and lights use the socket as a power source. The holes on the top and bottom sides serve as ventilation to prevent the devices from overheating. The Vocational Interactive Wall can be interacted with using touch and physical shifts that shift the screen from left to right, and the application response is quite fast. The content released is the profile of the Directorate General of Vocational Education, which aims to showcase the vocational programs that were implemented previously.
Ideation
The activity diagram in Figure 5 illustrates the process flow of the AR application developed. The marker model used is image tracking. When the camera detects the marker, the application will render the issued object and display the object.
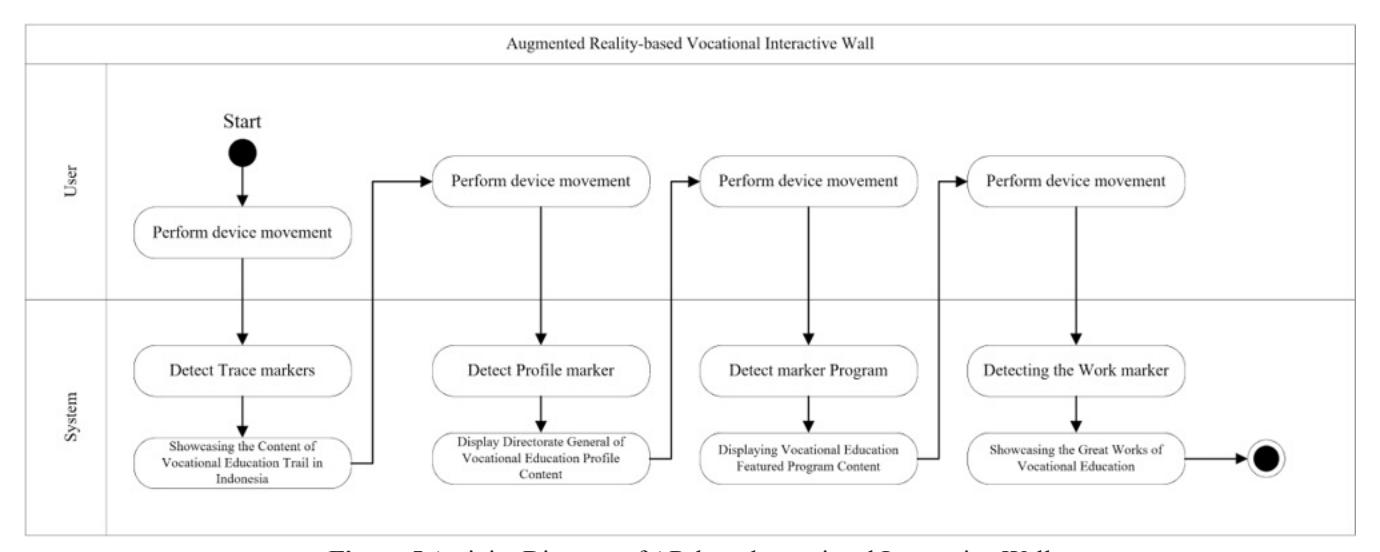
Figure 5 Activity Diagram of AR-based vocational Interactive Wall Source: Personal documentation, 2024
AR-based Vocational Interactive Wall product logo.
Figure 6 AR-based vocational Interactive Wall Application product logo. Source: Personal documentation, 2024
The idea of this logo is to represent the product name and illustration of student activities from the vocational campus. This logo is made simple with dominant text for easy recognition and a learning activity background in blue with a professional impression. This logo is made with the Adobe Photoshop application, using the Azonix font and the Vocational Interactive Wall image as the background so that users can see that this application is an Augmented Reality-based vocational Interactive Wall product.
Figure 7 Augmented Reality (AR)-based Vocational Interactive Wall Marker created with Adobe Illustrator. Source: Personal documentation, 2024
Figure 7 shows the result of the Augmented Reality (AR)-based Vocational Interactive Wall marker using the Adobe Illustrator application. This image will later be a marker of the Augmented Reality (AR) based on Vocational Interactive Wall application.
Figure 8 A. AR content in the form of a Video History of Vocational Education in Indonesia; B. Vocational Education Flagship Program; C. Profile of Directorate General of Vocational Education; D. Innovative Work of Vocational Education in the form of video portrait. Source: Personal documentation, 2024
Each marker detected by the camera will display the content in Figure 8. The first image discusses the history of Indonesian Vocational Studies from its establishment until now. The second picture displays programs that are the flagship of Vocational Education. The third picture explains the profile of the Directorate General of Vocational Education. The fourth picture displays the innovative works of Vocational Students.
Figure 9 Wireframe of Augmented Reality (AR) based on Vocational Interactive Wall Application. Source: Personal documentation, 2024
In Figure 9, the application only displays the camera when it is opened and will display content in the form of images or videos if the camera detects the marker, as in Figure 7.
Figure 10 The wireframe of the Augmented Reality (AR) based on Vocational Interactive Wall Application was requested by respondents. A. Camera B. Detects Marker; C. Outputs Content; D. There are buttons that can be interacted with. Source: Personal documentation, 2024
Figure 10 is a wireframe of the application after collecting several respondent requests. Respondents expect the application to display content; respondents or users can interact with it. For example, if the respondent leads to the featured program marker, he can touch the screen and interact with the content. If implemented, this method has the potential to attract other users.
Implementation
In the implementation stage, the authors conduct continuous iterations, transforming prototypes into final solutions, and pay attention to technical, design, and usage aspects that ensure our product or service meets the needs and expectations of users. One of them is the 3D model of the Interactive Wall, in Figure 11.
Figure 11 3D Modelling of Vocational Interactive Wall based on Augmented Reality. Source: Personal documentation, 2024
The picture above is a 3D illustration of an augmented reality (AR)-based vocational interactive wall, which already resembles its original form.
Figure 12 Product display of Vocational Interactive Wall Source: Personal documentation, 2024
Then, after the design is completed, the design components are built in an exhibition so visitors can use them. At that moment, the researcher gathered 20 respondents, whose data is shown in Table II.
Table II UEQ Questionnaire Results that Have Been Converted to a Scale of -3 to 3
| ITEMS | ||||||||||||||||||||||||||
|---|---|---|---|---|---|---|---|---|---|---|---|---|---|---|---|---|---|---|---|---|---|---|---|---|---|---|
| 1 | 2 | 3 | 4 | 5 | 6 | 7 | 8 | 9 | 10 | 11 | 12 | 13 | 14 | 15 | 16 | 17 | 18 | 19 | 20 | 21 | 22 | 23 | 24 | 25 | 26 | |
| 3 | 3 | 3 | 2 | 3 | -3 | 3 | -1 | 2 | -2 | 3 | 3 | 3 | 2 | 1 | -1 | 3 | 2 | 2 | -2 | 3 | 3 | 3 | 1 | 3 | -2 | |
| 0 | 1 | -2 | 3 | 1 | 0 | 1 | 3 | 3 | 1 | 0 | 1 | 3 | 1 | 2 | 1 | 3 | -2 | 2 | 0 | 3 | 3 | 1 | -2 | 3 | 1 | |
| 3 | 3 | 3 | 3 | 3 | 3 | 3 | 3 | 3 | 3 | 3 | 3 | 3 | 3 | 3 | 2 | 3 | 3 | 3 | 3 | 3 | 3 | 3 | 3 | 3 | 3 | |
| 2 | 3 | -3 | -3 | -2 | 1 | 2 | -2 | 2 | -1 | 1 | 1 | 0 | 1 | 1 | 1 | 2 | 1 | 1 | 1 | 0 | -1 | 1 | 1 | 2 | 1 | |
| 2 | 1 | 2 | 1 | -1 | 2 | 2 | 0 | 0 | 2 | -1 | 1 | 2 | 2 | 2 | 1 | 2 | 1 | 0 | -1 | 0 | -2 | 1 | 0 | 1 | 1 | |
| 0 | 1 | 0 | 0 | 0 | 0 | 0 | -1 | 1 | 1 | -1 | 1 | -1 | 0 | -1 | 0 | 1 | 1 | 1 | -1 | 1 | -1 | 2 | 1 | 1 | -1 | |
| 2 | 2 | -2 | -2 | -2 | 3 | 3 | 2 | -3 | -2 | 3 | -3 | 3 | 2 | 1 | 3 | -3 | -3 | -2 | 3 | -3 | 2 | -3 | -3 | -3 | 3 | |
| 0 | 3 | 0 | 3 | 3 | 3 | 3 | -3 | 3 | -3 | 3 | 3 | 3 | 3 | 3 | 3 | 3 | 3 | 3 | 3 | 3 | 3 | 3 | -2 | 1 | 0 | |
| RE | 3 | 3 | 1 | 3 | 2 | 3 | 2 | -1 | 1 | 1 | 2 | 2 | 3 | 3 | 2 | 2 | -1 | 1 | 2 | 2 | 2 | 2 | 2 | 0 | 0 | 1 |
| SP ON | 1 | 2 | 2 | 2 | 1 | 0 | 2 | 1 | -1 | 0 | 1 | 2 | 2 | 2 | 2 | 2 | 2 | 1 | 3 | -2 | 2 | -2 | 1 | 0 | 3 | -2 |
| DE | 1 | 1 | 0 | 1 | 1 | 1 | 1 | 0 | 1 | 0 | 1 | 1 | 2 | 1 | 1 | 1 | 2 | 2 | 1 | 2 | 2 | 2 | 3 | 2 | 2 | 3 |
| N | 2 | 3 | 2 | 3 | 3 | 2 | 2 | 2 | 3 | -2 | 2 | 3 | 2 | 3 | 2 | 3 | 3 | 3 | 3 | 3 | 2 | 2 | 1 | 3 | 3 | -3 |
| 3 | 3 | 3 | 3 | 3 | 3 | 3 | 2 | 2 | -2 | 3 | 3 | 1 | 2 | 1 | 2 | 3 | 3 | 2 | 3 | 3 | 2 | 2 | -2 | 3 | 2 | |
| 1 | -1 | 0 | 0 | 3 | 2 | 1 | -1 | 2 | -1 | 2 | 1 | 3 | 0 | 2 | 2 | 3 | 2 | 1 | -1 | 1 | 1 | 2 | 3 | 2 | 3 | |
| 0 | 0 | 0 | -1 | 0 | 1 | 1 | 1 | 0 | -1 | 0 | 0 | 0 | 0 | 0 | 0 | 0 | 0 | 0 | 0 | 0 | 0 | 0 | 0 | 1 | 0 | |
| -1 | 1 | 0 | 2 | 2 | 0 | 0 | 2 | 0 | 0 | 0 | 0 | 0 | 0 | 0 | 1 | 2 | 1 | 0 | 1 | 1 | 2 | 1 | 0 | 2 | 0 | |
| 2 | 3 | 0 | 3 | 2 | -2 | 1 | 0 | 3 | 2 | 2 | 3 | 1 | 1 | 3 | 3 | 3 | 1 | 2 | 1 | 2 | 1 | 3 | 3 | 2 | 2 | |
| 2 | 2 | 2 | 3 | 3 | 1 | 3 | 3 | 2 | 3 | 2 | 2 | 3 | 2 | 3 | 2 | 3 | 2 | 2 | 3 | 3 | 3 | 3 | 2 | 3 | 3 | |
| 2 | 2 | 2 | 2 | 2 | 2 | 2 | 1 | 2 | -2 | 2 | 2 | 2 | 2 | 2 | 2 | 2 | 2 | 2 | 2 | 2 | 2 | 2 | 2 | 2 | 2 | |
| 2 | 3 | -1 | -2 | 2 | 0 | 2 | 0 | 2 | 2 | 2 | 2 | 3 | 0 | 2 | 2 | 3 | 3 | 2 | 2 | 3 | 2 | -2 | 1 | 2 | 2 |
The results of the respondent data that have been obtained are entered into the "Data" tab. The respondent's score scale shows a rating of 1 to 7. It will then be converted automatically into the "DT" tab with a scale of -3 to 3. Table III displays the results of the respondent data.
Table III Per-person Scale Average
| Respondent | Scale means per person | |||||
|---|---|---|---|---|---|---|
| Number | Attractiveness | Perspicuity | Efficiency | Dependability | Stimulation | Novelty |
| 1 | 1.83 | 2.75 | 1.5 | 1.75 | 1.25 | 0 |
| 2 | 0.67 | 2.5 | 1.75 | 2 | 0 | 0.5 |
| 3 | 2.83 | 3 | 3 | 3 | 3 | 3 |
| 4 | 1.33 | 0 | 0.75 | 0.5 | 0.5 | -0.5 |
| 5 | 1.17 | 1 | -0.5 | 0.25 | 1 | 1.75 |
| 6 | 0.5 | 0.25 | 0.25 | 0 | 0.25 | -0.25 |
| 7 | -0.33 | 0 | -0.25 | 0 | 0.25 | 0 |
| 8 | 1.33 | 3 | 3 | 1.5 | 3 | 0 |
| 9 | 1.67 | 2.75 | 1.75 | 0.5 | 2 | 1.25 |
| 10 | 1.67 | 2 | -1 | 1.75 | 1 | 0.5 |
| 11 | 1.33 | 1.5 | 2 | 1 | 1.25 | 1 |
| Respondent | Scale means per person | |||||
|---|---|---|---|---|---|---|
| Number | Attractiveness | Perspicuity | Efficiency | Dependability | Stimulation | Novelty |
| 12 | 2.83 | 2.5 | 2.25 | 2.5 | 2.5 | -0.25 |
| 13 | 1.83 | 2.5 | 2.25 | 2.5 | 3 | 1 |
| 14 | 1.5 | 0.75 | 1 | 1.25 | 2 | 1 |
| 15 | 0.17 | -0.25 | 0 | 0.25 | 0.5 | -0.25 |
| 16 | 0.33 | 1 | 1 | 1 | 0.75 | 0 |
| 17 | 2.33 | 2.25 | 2 | 1.75 | 0.5 | 1.75 |
| 18 | 2.17 | 2.75 | 2.75 | 2.5 | 2.25 | 2.75 |
| 19 | 2 | 2 | 2 | 1.75 | 2 | 1 |
| 20 | 1.5 | 1.75 | 1 | 1.75 | 1.75 | 1.25 |
Next, calculate the main result of UEQ, which will be the reference for the benchmark calculation. The average and variance of the average results of the resulting data transformation per specified scale are used to build the overall scale and the assumption scale (Attractiveness, Pragmatic Quality, and Hedonistic). The results of the mean, variance, and standard deviation are shown in Table IV below:
Table IV Mean, Variance, and Standard Deviation of UEQ Results
| Item | Mean | Variance | Std. Dev. | No. | Left | Right | Scale |
|---|---|---|---|---|---|---|---|
| 1 | 1.5 | 1.4 | 1.2 | 20 | annoying | enjoyable | Attractiveness |
| 2 | 2.0 | 1.4 | 1.2 | 20 | not understandable | understandable | Perspicuity |
| 3 | 0.6 | 3.1 | 1.8 | 20 | creative | dull | Novelty |
| 4 | 1.3 | 3.9 | 2.0 | 20 | easy to learn | difficult to learn | Perspicuity |
| 5 | 1.5 | 2.8 | 1.7 | 20 | valuable | inferior | Stimulation |
| 6 | 1.1 | 2.8 | 1.7 | 20 | boring | exciting | Stimulation |
| 7 | 1.9 | 1.0 | 1.0 | 20 | not interesting | interesting | Stimulation |
| 8 | 0.6 | 3.0 | 1.7 | 20 | unpredictable | predictable | Dependability |
| 9 | 1.4 | 2.5 | 1.6 | 20 | fast | slow | Efficiency |
| 10 | -0.1 | 3.4 | 1.8 | 20 | inventive | conventional | Novelty |
| 11 | 1.5 | 1.7 | 1.3 | 20 | obstructive | supportive | Dependability |
| 12 | 1.6 | 2.2 | 1.5 | 20 | good | bad | Attractiveness |
| 13 | 1.9 | 1.7 | 1.3 | 20 | complicated | easy | Perspicuity |
| 14 | 1.5 | 1.2 | 1.1 | 20 | unlikable | pleasing | Attractiveness |
| 15 | 1.6 | 1.2 | 1.1 | 20 | usual | leading edge | Novelty |
| 16 | 1.6 | 1.2 | 1.1 | 20 | unpleasant | pleasant | Attractiveness |
| 17 | 2.0 | 2.6 | 1.6 | 20 | secure | not secure | Dependability |
| 18 | 1.4 | 2.6 | 1.6 | 20 | motivating | demotivating | Stimulation |
| 19 | 1.5 | 1.6 | 1.3 | 20 | meets expectations | does not meet expectations | Dependability |
| Item | Mean | Variance | Std. Dev. | No. | Left | Right | Scale |
|---|---|---|---|---|---|---|---|
| 20 | 1.1 | 3.1 | 1.8 | 20 | inefficient | efficient | Efficiency |
| 21 | 1.7 | 2.3 | 1.5 | 20 | clear | confusing | Perspicuity |
| 22 | 1.4 | 2.8 | 1.7 | 20 | impractical | practical | Efficiency |
| 23 | 1.5 | 2.7 | 1.6 | 20 | organized | cluttered | Efficiency |
| 24 | 0.7 | 3.4 | 1.8 | 20 | attractive | unattractive | Attractiveness |
| 25 | 1.8 | 2.1 | 1.4 | 20 | friendly | unfriendly | Attractiveness |
| 26 | 1.0 | 3.4 | 1.8 | 20 | conservative | innovative | Novelty |
The typical evaluation value is the standard average value per scale between -0.8 and 0.8; numbers >0.8 indicate a positive evaluation, while values < -0.8 indicate a negative review (Schrepp, 2023). It can be concluded that the Augmented Reality (AR)-based vocational Interactive Wall Application has a positive impression of each scale, namely, Attractiveness, Clarity, Efficiency, Accuracy, Stimulation, and Novelty, which can be seen in Table V.
Table V Average Results on 6 UEQ Variables
| UEQ Scales (Mean and Variance) | ||
|---|---|---|
| Perspicuity | 1.700 | 1.19 |
| Stimulation | 1.438 | 0.98 |
| Attractiveness | 1.433 | 0.71 |
| Dependability | 1.375 | 0.83 |
| Efficiency | 1.325 | 1.36 |
| Novelty | 0.775 | 0.99 |
The results of calculating the three parts of UEQ can be seen in Table VI. These are attractiveness, pragmatic quality, and hedonic quality. Attractiveness is a pure valence dimension, Pragmatic Quality is an aspect that describes the quality of user interactions related to tasks or goals, and Hedonic Quality is a description of aspects related to pleasure when using the product. The results obtained by the UEQ evaluation for the attractiveness aspect had a value of 1.43, and for pragmatic quality, they had a value of 1.47. The Hedonic Quality received a value of 1.11. Table VI illustrates this.
Table VI Average Results of Each Aspect of UEQ
| Pragmatic and Hedonic Quality | ||||||||
|---|---|---|---|---|---|---|---|---|
| Attractiveness | 1.43 | |||||||
| Pragmatic Quality | 1.47 | |||||||
| Hedonic Quality | 1.11 | |||||||
The final results of the user experience analysis from the UEQ questionnaire are displayed on the "Benchmark" tab shown in Figure 13.
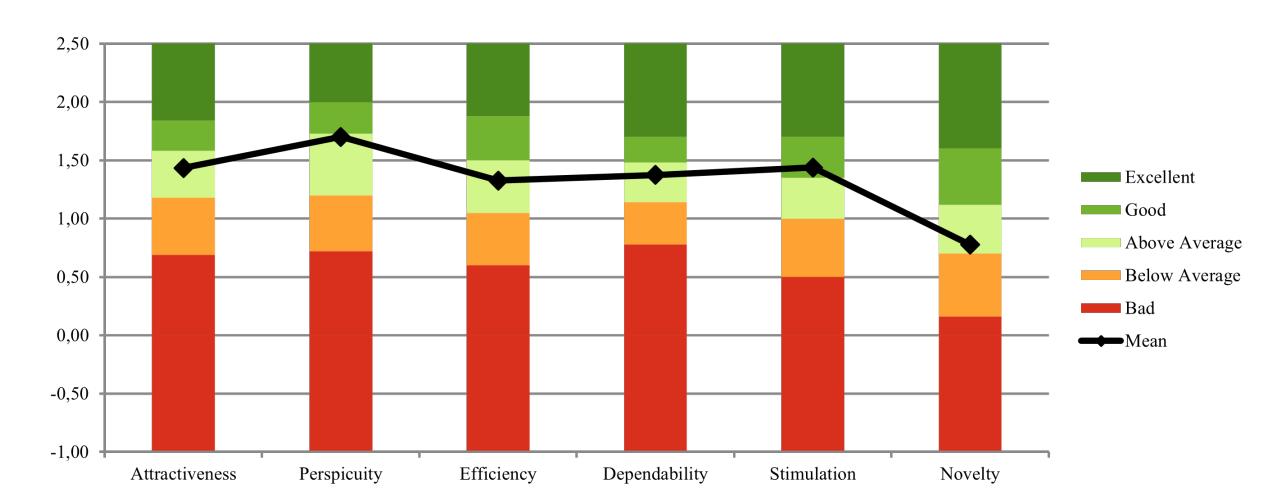
Figure 13 Benchmark Data Set Results. Source: Personal documentation, 2024
Based on the results of the "Benchmark" tab, it can be seen that for UEQ aspects, namely Attractiveness (1.43), Clarity (1.70), Efficiency (1.33), Accuracy (1.38), and Novelty (0.78) they are in the good enough category, and Stimulation (1.44) is in the good category.
Discussion
The attractiveness rating scale gets a score above the average of 1.43 (Above Average). Attractiveness shows an assessment that is influenced by a sense of comfort and a sense of fun while playing. Users feel happy playing the Augmented Reality (AR)-based Vocational Interactive Wall application because it has a good level of attractiveness. Players give opinions about this game as an interactive product because it provides a pleasant user experience, is easy to use, and provides an exhibition experience through augmented reality technology.
The stimulation rating scale shows users the direct benefits of the augmented reality (AR)-based vocational interactive wall application and motivates users who are curious about the profile of the Directorate General of Vocational Education. Provides an interesting and exciting impression because the delivery of information is packaged in an interactive learning model in the form of Augmented Realitybased applications. This scale gets an average score of 1.44 (good).
The novelty rating scale shows the level of innovation of the Augmented Reality (AR)-based vocational Interactive Wall application in application development by getting an average score of 0.78 (above average). Users feel that what is available in this application is creative and innovative, and supporting the delivery of information in an interactive learning model by utilizing augmented reality technology will be more effective and provide solutions to monotonous exhibitions.
The efficiency rating scale shows how quickly users complete the fulfillment of their tasks, such as watching the four contents of the Augmented Reality (AR)-based Vocational Interactive Wall application. Users feel that the Augmented Reality (AR)-based Vocational Interactive Wall application game is quite practical when played and provides a display that is well organized. The efficiency scale gets an average value of 1.33 (above average).
Accuracy shows an assessment that is influenced by the level of ease with which players predict what to do, provides a sense of security when playing, and has the ability to support users in achieving their goals, namely increasing knowledge and successfully watching the four vocational education courses. The accuracy scale has an average value of 1.38, which is above average. This shows how much the user can control interactions in the Augmented Reality (AR)-based Vocational Interactive Wall app.
Aspects of ease of understanding and learning, as well as the level of complexity in the application, influence the assessment of clarity. The clarity rating scale gets a value above the average of 1.70 (Above Average). There are obstacles from user experience related to the Clarity rating scale, seen from users feeling that the Augmented Reality (AR)-based Vocational Interactive Wall application is still found on some displays that are confusing for users, such as on the interface display.
Conclusion
With the results of the Augmented Reality-based vocational Interactive Wall design with the Human Centered Design (HCD) method approach, the Interactive Wall prototype design is produced following the wishes and needs of the user. The resulting prototype design has several features, namely: marker, monitor screen, wall, screen rail, screen shift limit, screen handle, lamp, smartphone, smartphone holder, and hole. This interactive wall design will help visitors to the Vokasi Fest x Merdeka Belajar 2023 event who want to know the Directorate General of Vocational Education profile according to user needs.
From the results of research using the User Experience Questionnaire (UEQ), the Augmented Reality (AR)-based Vocational Interactive Wall application shows several aspects that affect user experience. The Clarity Scale gets an average value of 1.70, the Accuracy Scale 1.38, the Efficiency Scale 1.33, the Stimulation Scale 1.44, the Attractiveness Scale 1.43, and the Novelty Scale 0.78. The study's conclusion says that this app gives users a pleasant and easy-to-use experience and an exhibition experience through augmented reality technology. The app's attractiveness, stimulation, novelty, efficiency, accuracy, and clarity are some of the things that affect users' experiences.
However, the novelty part gets a score that is considered sufficient. This is because, during the research, users easily understood how to use the Vocational Interactive Wall, so the Clarity scale got the highest score.
Acknowledgement
The author would like to thank Batam State Polytechnic and Vocational Education for the tremendous support and cooperation in the smooth creation of the Augmented Reality (AR)-based Vocational Interactive Wall and the procurement of the Vokasi Fest X Kampus Merdeka 2023 Event. I would also like to thank Team Digiars for supporting the research process. In addition, I would like to express my sincere appreciation to Mr. Riwinoto and Nanda Putra Perkasa, who have mentored me and the team. I also want to express my special thanks to Mr. Doni as the exhibition organizer who helped with this project. To my teammate Muhammad Irsyad Khairi, who helped me make the application, the event would not have been as successful as expected without the amazing support and cooperation from all parties.