
Keywords:
Basepoint, Baseline, shoreline, SPOT 6, DSAS
Beach is a very dynamic environment because, in that environment, various processes occur, such as sedimentation, abrasion, and transportation. Likewise, the shoreline has a dynamic nature that can change. Shoreline Changes can affect a country's maritime boundaries. This is because the changing shoreline can change the draw of the Baseline, which is the reference for measuring the maritime boundary. Therefore, it is necessary to monitor the shoreline where the Basepoint and Baseline are located. In this study, measurements of shoreline changes were made using SPOT 6 data, which has a spatial resolution of 1.5 m. Shoreline changes were calculated using the DSAS. From the calculation results, the average rate of accretion in the Basepoint 167 area is 5.63 m/ year. In the area around Basepoint 168, the average accretion rate is 2.27 m/year. In the area around Basepoint 180, an average accretion rate of 15.11 m/year is obtained. The accretion process results in a change in the shoreline, resulting in a change in the configuration of the low water line, which is the location where the Basepoint is placed. Thus, changes in the shoreline can affect Indonesia's existing maritime boundaries.
INFO ARTIKEL
ABSTRAK
Kata kunci:
titik dasar, garis pangkal, garis pantai, SPOT 6, DSAS
Pantai adalah lingkungan yang sangat dinamis karena dalam lingkungan tersebut, berbagai terjadi proses seperti sedimentasi, abrasi, dan transportasi. Demikian pula, garis pantai memiliki sifat dinamis yang berubah-ubah. Perubahan garis pantai juga dapat memengaruhi batas laut suatu negara. Hal ini karena perubahan garis pantai dapat mengubah tata letak garis pangkal, yang merupakan acuan untuk mengukur batas laut negara. Oleh karena itu, penting untuk memantau garis pantai di tempat titik dasar dan garis pangkal berada. Perubahan garis pantai dalam penelitian ini diukur menggunakan citra satelit SPOT 6 yang memiliki resolusi spasial 1,5 meter. DSAS digunakan sebagai alat untuk mengukur perubahan garis pantai. Dari hasil perhitungan, rata-rata laju akresi di area Titik Dasar 167 adalah 5,63 m/tahun. Ratarata laju akresi di sekitar Titik Dasar 168 tercatat sebesar 2,27 meter per tahun. Laju
pertumbuhan garis pantai di sekitar Titik Dasar 180 mencapai rata-rata 15,11 meter setiap tahunnya. Proses akresi mengakibatkan perubahan garis pantai, sehingga terjadi perubahan konfigurasi garis air rendah yang merupakan lokasi titik dasar ditempatkan. Dengan demikian, perubahan garis pantai dapat memengaruhi penarikan batas laut Indonesia.
Introduction
The shoreline is the boundary where land and sea come together along the coast (Ciecholewski, 2023). Therefore, shorelines are vulnerable to change. The shifting position of the shoreline serves as evidence of this. Two processes, namely accretion and abrasion, cause shoreline changes. Accretion is the gradual accumulation of sediment transported from terrestrial or river sources into the marine environment, resulting in a seaward displacement of the shoreline (Hein & Kirwan, 2024). Abrasion is the process of eroding the shoreline due to waves and currents, so the shoreline changes toward the land (Idris et al., 2024). Therefore, shoreline change is an environmental problem. Furthermore, alterations in the shoreline can impact the Baseline's withdrawal, a crucial reference for determining the nation's maritime borders. The Baseline is the line used as a reference for withdrawing the maritime boundary (Arsana, 2007). Baselines are formed by connecting the Basepoint (Johan, 2009). The shoreline that advances towards the sea due to accretion will cause the Basepoint and Baseline's position to shift to the sea (Schofield & Arsana, 2012). Conversely, abrasion causes shoreline erosion, leading to the retreat of the shoreline's configuration and position inland.
Consequently, the Basepoint and Baseline also shift inland. Shifting the position of the Basepoint and Baseline will cause uncertainty in determining the outer limits of a country's jurisdiction. Consequently, it is crucial to track shoreline alterations at the locations of Indonesia's Basepoint and Baseline. There are several methods available for monitoring Baseline changes, including direct field measurements, aerial photo analysis, and remote sensing analysis. Measurement of shoreline changes directly in the field can be done using GPS and then measuring the coordinates of several points along the shoreline, then comparing the results of the coordinates obtained with the previous year's sea map (Opa, 2011). Then, in 2021, shoreline mapping research using UAV (Unmanned Aerial Vehicle) technology will be conducted in the Ujung Genteng area (Sinurat et al., 2021). Additionally, numerous studies have employed remote sensing data, such as Landsat and Sentinel, to examine shoreline fluctuations. For instance, Landsat imagery from 2010 was used to quantify the shoreline shifts along the northern coasts of Semarang and Demak (Parman, 2010). Landsat images were also used to detect shoreline changes in 2015 in Jembrana Regency using a near-infrared channel (Suniada, 2015).
In 2010, Landsat imagery was used to study shoreline changes in Kendal Regency, and shoreline extraction was conducted with RGB 542 visual interpretation (Arief et al., 2011). The 2022 Sentinel-2A image data is used to look at how the shoreline has changed in Semarang. The DSAS (Digital Shoreline Analysis System) is used to figure out how the shoreline has changed (Zaidan et al., 2022). DSAS was used to conduct shoreline change calculations, incorporating corrections from DEM and sea tide data (Lubis, 2021). This study utilized SPOT 6 imagery data to calculate shoreline changes. The digitized shoreline was corrected with DEM and tide data, and then the changes were calculated using DSAS. By using SPOT 6 imagery at two different epochs, it is possible to calculate shoreline changes with wide coverage and high spatial resolution. Images with high spatial resolution can identify shoreline changes with fairly good accuracy (Mukhtar, 2018). Djunarsjah et al. (2021) conducted research on the Basepoint and Baseline of the Republic of Indonesia. However, this research has not been associated with the phenomenon of shoreline change. This study aims to inform government management of shoreline dynamics that could affect Indonesia's Basepoint and Baseline. Changes to these shorelines can have significant social impacts, particularly on traditional fishing areas, by altering access to vital marine resources upon which coastal communities depend.
Method
The research area of this thesis is on the shoreline, which is around:
- 1. Basepoint Number 168, Lahewa, North Nias Regency
- 2. Basepoint Number 167, Wunga Island
- 3. Basepoint Number 180, Beoga Bireuen Aceh Regency.
| Basepoint | Coordinate (longitude, latitude) |
|---|---|
| Basepoint 167 | (97° 04' 48", 1° 12' 47") |
| Basepoint 168 | (97° 03' 38", 1° 24' 19") |
| Basepoint 180 | (96° 49' 57", 5° 16' 31") |
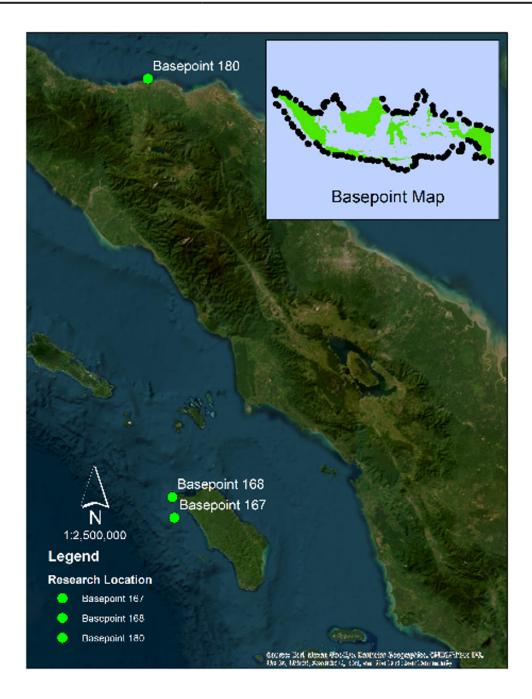
Figure 1 Research Location and Basepoint Map
Based on research conducted by Djunarsjah et al. (2021), the three Basepoints include the Basepoint and Baseline, whose conditions are not optimal. The evidence indicates that the positions of these Basepoints do not comply with the provisions stipulated in the 1982 United Nations Convention on the Law of the Sea (UNCLOS) and Indonesian Government Regulation (PP) No. 38 of 2002 concerning the List of Geographical Coordinates of the Archipelagic Baseline Points of Indonesia. Both regulations specify that Basepoints must be located at the low-water line. However, the research conducted by Djunarsjah et al. (2021) found that several existing Basepoints are not precisely situated at the low-water line but rather have shifted or been affected by shoreline changes due to erosion, accretion, or other factors. Therefore, the changes in the shoreline in the North Nias, Wunga Island, and Bireun areas will be calculated and associated with the Basepoint and Baseline conditions that are not optimal.
There are several data used in this study, namely:
Google Earth Image Data
Before calculating shoreline changes, in this study, the identification of the Basepoint and Baseline is not optimal due to changes in the shoreline. This is done by using google earth images with different observation epochs. The study sources its Google Earth images from various providers, specifically Maxar Technologies and Landsat.
Basepoint and Baseline Data
We also used Basepoint data and Baseline in this study to determine the maritime boundaries of the Republic of Indonesia. Basepoint and Baseline data can be found in the attached copy of Government Regulation Number 38 of 2002 (2002), which is about the List of Geographical Coordinates of Baseline Points of the Indonesian Archipelago, as well as the changes that were made to it by Government Regulation Number 37 of 2008.
Indonesia Maritime Boundary Inventory
We obtained this data from research results (Djunarsjah et al., 2021). Based on the data obtained, 50 cases of Basepoint and Baseline are not optimal. We categorize these conditions into 4 types of anomalies.
Table II Classification of Non-optimal Basepoint and Baseline Conditions
SPOT 6 Image
This study used high-resolution satellite imagery to calculate shoreline changes. The data was sourced from the National Research and Innovation Agency, BRIN. The image used is the SPOT 6 image, which has a spatial resolution of 1.5 meters. When compared to images from other satellites such as Landsat, which has a spatial resolution of 30 meters, SPOT 6 imagery is far superior in terms of spatial resolution. Thus, the SPOT 6 image can represent the actual shoreline better than the Landsat image. Then, apart from its high resolution, another reason for using SPOT 6 images in this study is that SPOT images are suitable for use in the Baseline and Baseline conditions study. The Basepoint for the maritime boundary claim is determined by the Basepoint survey. A painting sheet with a scale of 1:5000 depicts the survey results. With a map scale of 1:5000, an accuracy of 1 mm on the map corresponds to an accuracy of 5 meters in reality for the Basepoint survey results. Therefore, we need an image with a spatial resolution higher than 5 meters. SPOT 6 images can provide multispectral images with near-infrared and visible light channels (Li et al., 2016). SPOT 6 has image sensor specifications; there are panchromatic (450- 745 nm), blue (450-520 nm), green (530-590 nm), red (625-695 nm), and near infrared (760-890 nm) (Mhangara et al., 2020).
Digital Elevation Model
DEM data is used to correct the shoreline's position. The Geospatial Information Agency (BIG) obtains DEMNAS data by direct download for free on the BIG-provided web.
Tidal Data
In addition to using DEMNAS data, we also use tidal data for shoreline corrections. We obtained the data from observations at BIG's tide stations. Tidal data from 2019 observations are used.
Data Processing Methods
There are two methods in this research, namely:
Methods of Identification of Baseline and Baseline Conditions Caused by Shoreline Changes
From the 50 cases of non-optimal Basepoint and Baseline conditions based on maritime boundary inventory data, a selection of cases was conducted due to shoreline changes. Figure 2 displays a flowchart that represents the steps taken.
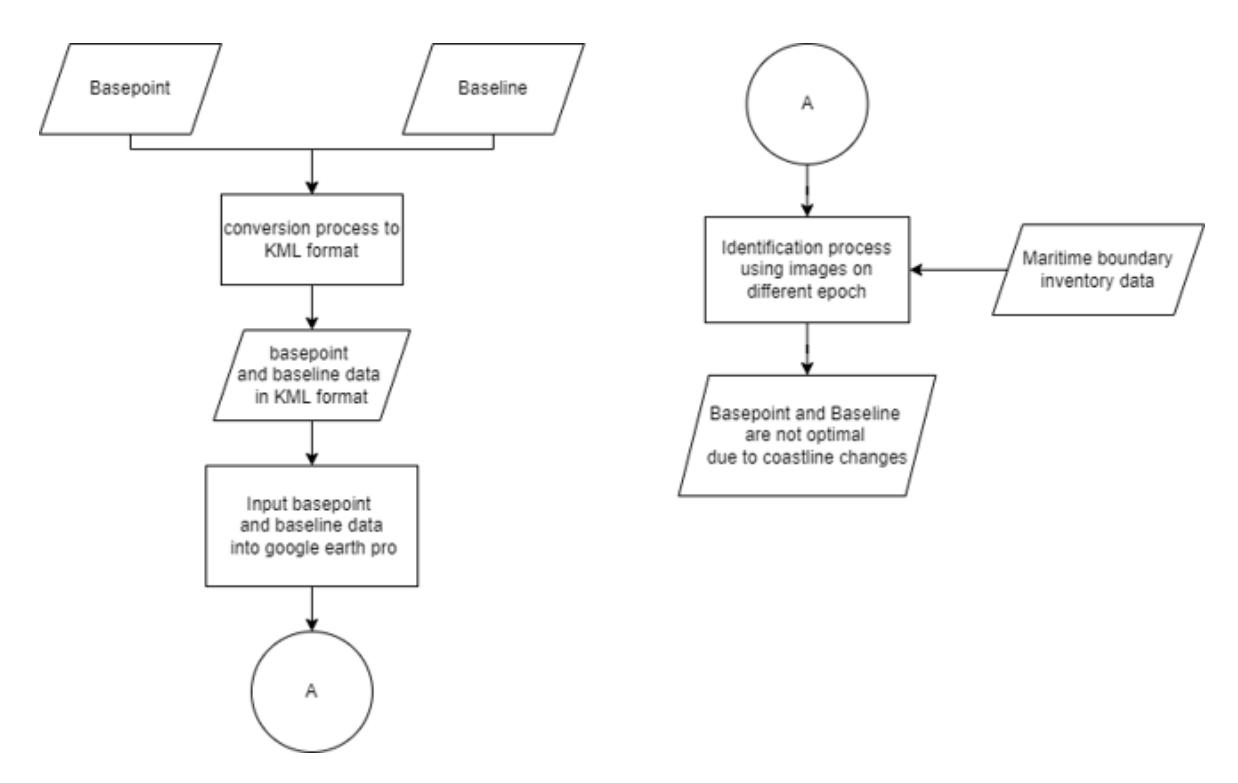
Figure 2 Flowchart of Identification of Basepoint and Baseline Conditions Caused by Shoreline Changes
This process is conducted using the Google Earth Pro platform because it can provide multitemporal satellite images quickly and easily.
Shoreline Change Identification Methods
Following the case selection, the size of the shoreline changes is calculated. This analysis was conducted utilizing the DSAS (Digital Shoreline Analysis System) software. The steps taken in calculating shoreline changes can be seen in Figure 3.
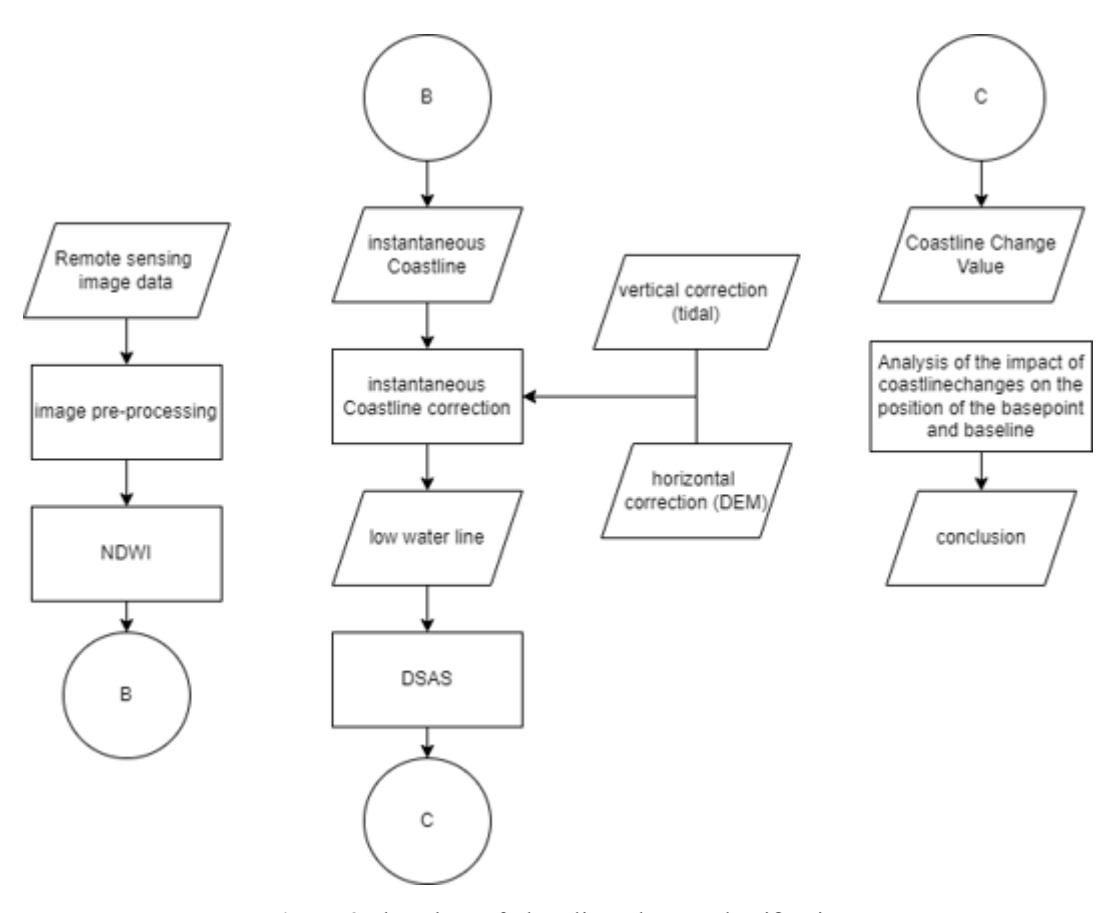
Figure 3 Flowchart of Shoreline Change Identification
The first process was pre-processing the data, which consisted of radiometric and atmospheric corrections, panchromatic and multispectral image fusion, and performing a subset of the research area. Next, we use the NDWI transformation process to distinguish between water bodies and land objects. The formulation of the NDWI is (McFeeters, 1996):
\[NDWI = \frac{Green - NIR}{Green + NIR}\] Equation 1
Information:
- a. The pixel value of the water object will be positive.
- b. Green indicates the reflectance value of the green channel
- c. NIR shows the reflectance value of the NIR channel
The result of the NDWI transformation, if the pixel value is less than or equal to zero, can be assumed not to be a water body object. In contrast, if the pixel value is more significant than zero, then the pixel is considered to be a water body object. Although the NDWI transformation is influenced by coastal typology and land cover, the results have high geometric accuracy for shoreline extraction compared to other water indices (Wicaksono & Wicaksono, 2019). Subsequently, the shoreline was digitized using GIS software.
Figure 4 Comparison Illustration between the Low Water Line as A Basepoint and the Imagery Shoreline
The shoreline formed is instantaneous. In this study, the shoreline needed is a shoreline that refers to the LAT (Lowest Astronomical Tide). Figure 4 provides a clearer illustration. Therefore, a method is required to adjust the immediate shoreline position. The technique used in this study is based on trigonometric theory, which can be seen in Figure 5 (Lubis, 2021).
Figure 5 Illustration of Calculating the Horizontal Shift of the Instantaneous Shoreline
According to the figure above, it takes the value of the horizontal shift (a) to correct for the instantaneous shoreline. By using the tangential formula, then:
\[a = \frac{b}{\tan \theta}\] Equation 2
Information:
Ѳ : Slope angle. a : Horizontal shift.
b : The difference between LAT and the prediction of instantaneous sea level.
The results of DEMNAS data processing yield the slope value. The difference between the LAT value and the instantaneous sea level prediction is the result of processing tidal data using the T_Tide algorithm in Matlab software. The algorithm employs tidal harmonic analysis, utilizing the least squares method for computational purposes (Pawlowicz, Beardsley & Lentz, 2002).After an instantaneous shoreline correction, shoreline changes were quantified using the Digital Shoreline Analysis System (DSAS). DSAS is a software add-on to ArcGIS. It can be downloaded free on the USGS (United States Geological Survey) website. DSAS performs calculations using the intersection points of the transect line and two shorelines at different epochs.
Results and Discussion
The results of the current research can be classified into those based on identification of Baseline and Baseline conditions caused by shoreline changes and on shoreline change identifications.
Results of Identification of Baseline and Baseline Conditions Caused by Shoreline Changes
According to the identification results, 8 cases of non-optimal Basepoint and Baseline conditions (Djunarsjah et al., 2021) resulted from shoreline change. Furthermore, six cases came from the Baseline class crossing the mainland, while the other two cases were from the Basepoint class on land. The following are examples of cases where the Basepoint and Baseline are not optimal due to changes in the shoreline, which can be seen in Table II.
Table III Examples of Cases of Basepoint and Baseline that Are Not Optimal due to Shoreline Changes
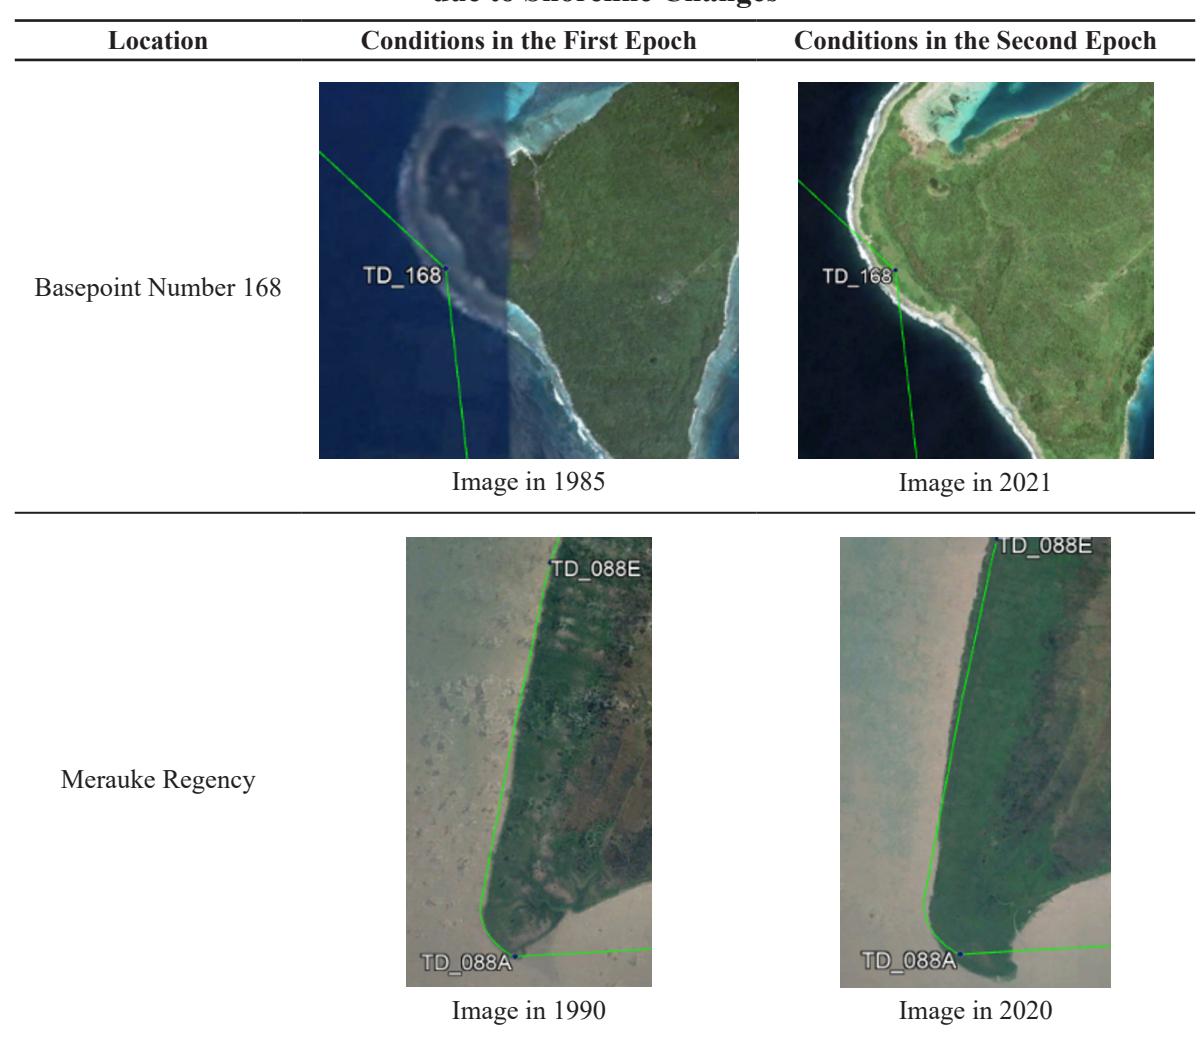
In the picture above, the conditions in the first epoch of the Baseline do not intersect the land, and the Basepoint is not on land. However, over time, land expansion occurs due to accretion, causing the Basepoint and Baseline position to be less optimal. Namely, the Basepoint is on land, and the Baseline intersects the land.
Results of Shoreline Changes Identification
We will enter the shoreline data into the ArcGIS software's DSAS plug-in after digitizing the shoreline. Next, we calculate the changes in the shoreline. The following is the result of shoreline changes at each research location.
1. Result of Calculation of Shoreline Change in the Area Around Basepoint Number 168
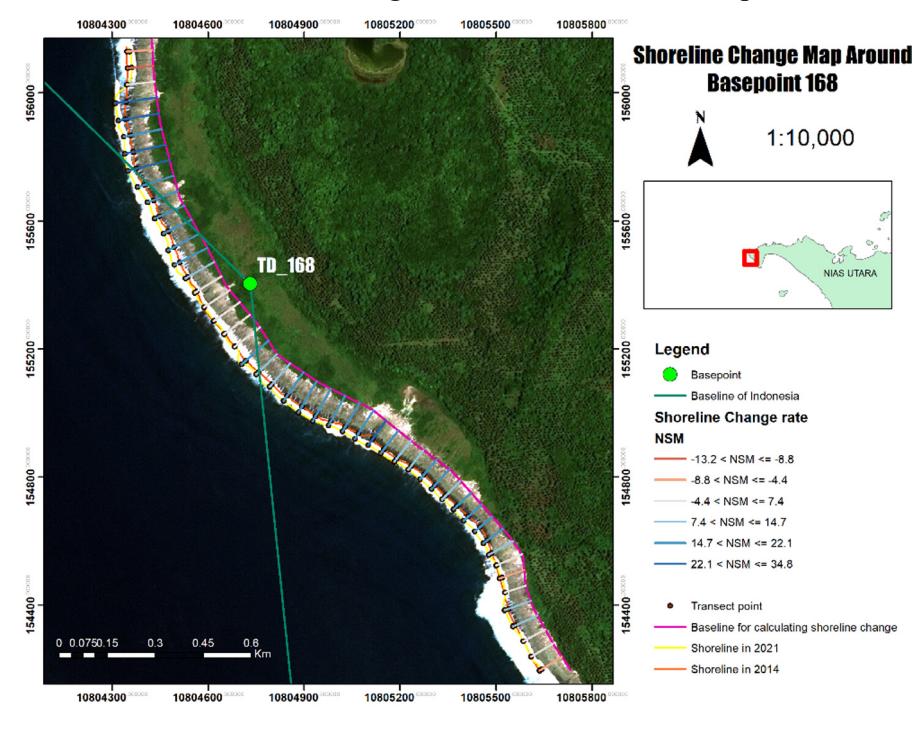
Figure 6 Map of Shoreline Change in the Area Around Basepoint Number 168
In the area around Basepoint 168, the dominant coastal change phenomenon is accretion. The formation of 19 transects indicates this phenomenon. 83.67% of the transects have a positive value indicating accretion. The average accretion value obtained is 15.47 m. The average abrasion value obtained is -5.34 m. Therefore, the average accretion rate obtained is 2.27 m/year, and the average abrasion rate is 0.78 m/year.
2. Result of Calculation of Shoreline Change in the Area Around Basepoint Number 167
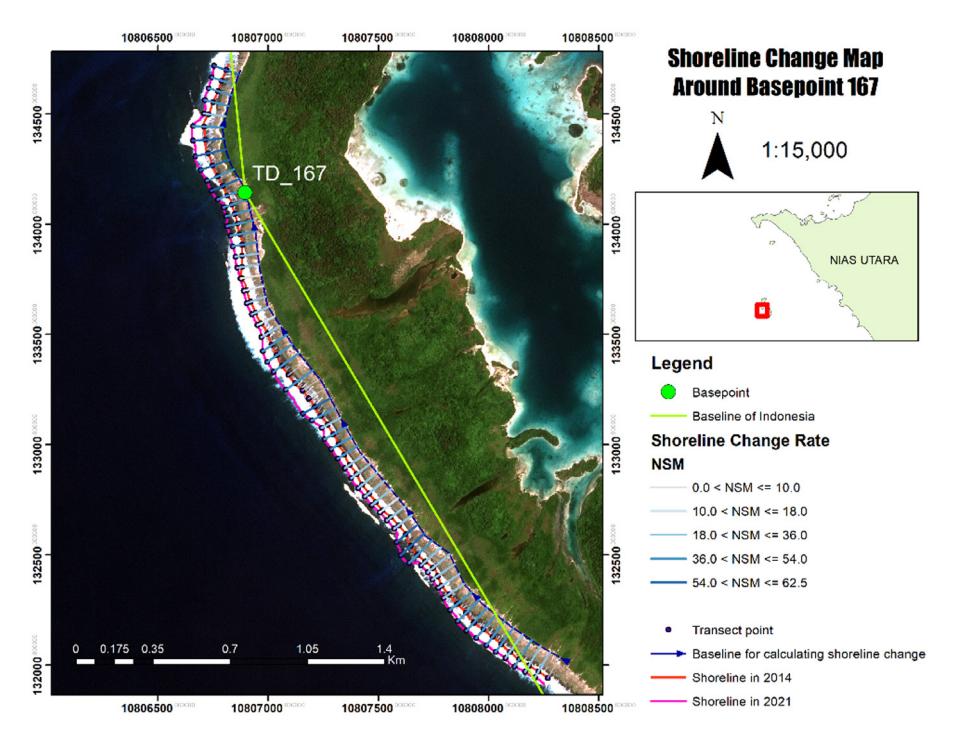
Figure 7 Map of Shoreline Change in the Area around Basepoint Number 167
In the area around the Basepoint, 167 transects were formed, namely 61 transects. All of these transects have positive values, indicating that the research location has 100% accretion. The average accretion value obtained is 38.37 m, and the average accretion rate is 5.63 m/year.
3. Calculation of Shoreline Change in the Area Around Basepoint 180
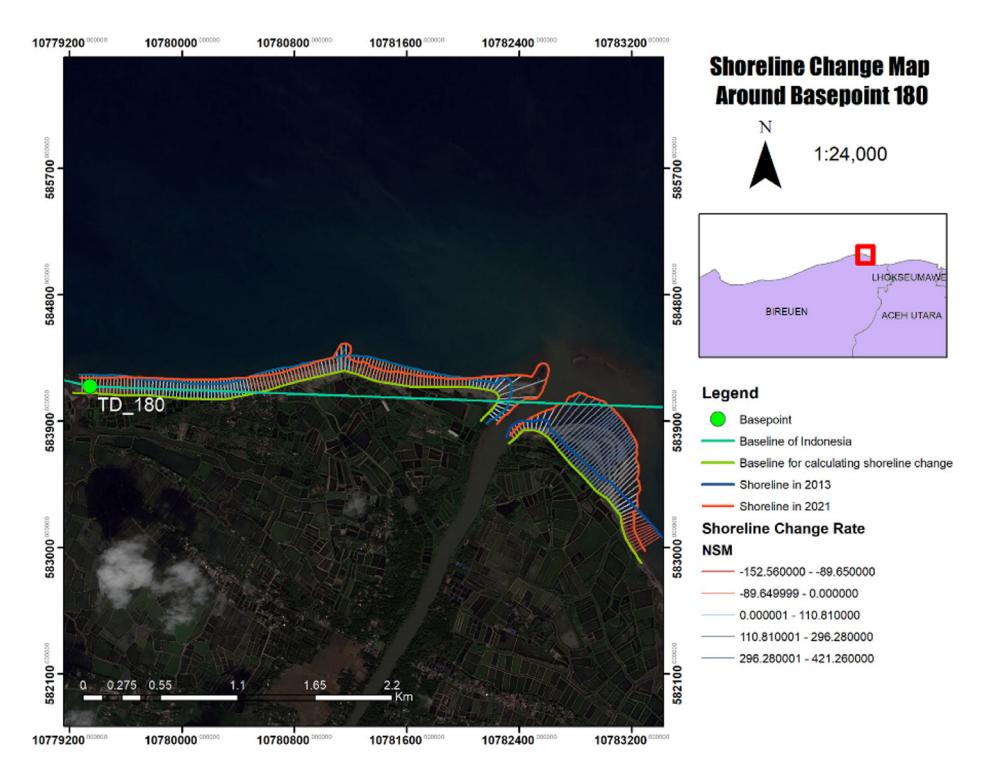
Figure 8 Map of Shoreline Change in the Area around Basepoint Number 180
The transect formed in the area around Basepoint 180 is 182 transects. A positive value on the transect indicated that accretion occurred in 93 transects, or 51% of the transects formed. The average value of accretion that occurs is 132.42 m. The value of the average rate of accretion formation is 15.11 m/year.
Discussion
Once the shoreline change rate is determined, the next step is to calculate the area difference between the Baseline and the Basepoint caused by the change. To achieve this, the first thing to do is to create a new Basepoint based on the low water line in 2021 that has been made.
The Impact of Shoreline Changes on the Position of the Basepoint and Baseline
The new Basepoint is then manually digitized. Next, a line is formed by connecting a new Basepoint with two adjacent Basepoints. Next, we calculate and construct a polygon that connects all the Basepoints. Thus, it can be seen that there is an increase in the area marked in the red shaded area, which can be observed in Figure 9, Figure 10, and Figure 11.
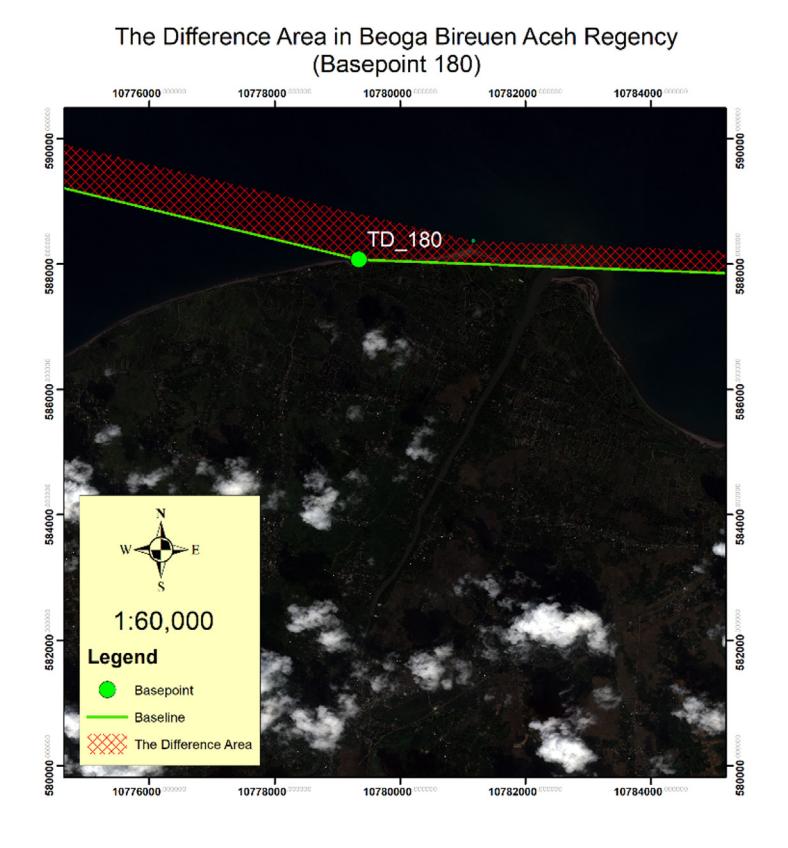
Figure 9 The Difference Area in Beoga Bireuen Aceh Regency (Basepoint 180)
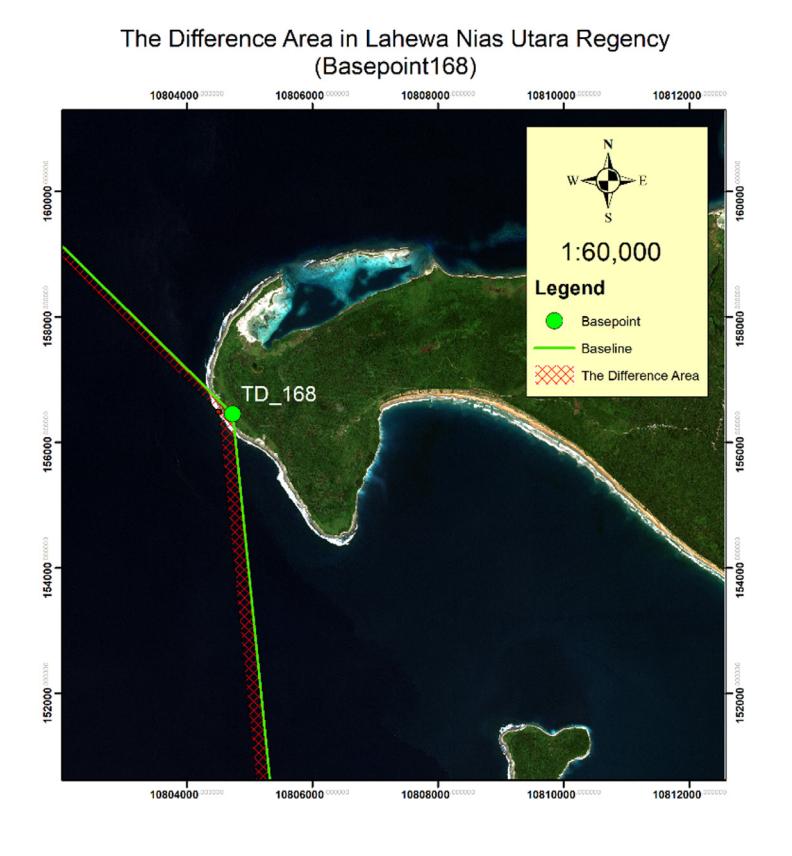
Figure 10 The Difference Area in Lahewa, North Nias Regency (Basepoint 168)
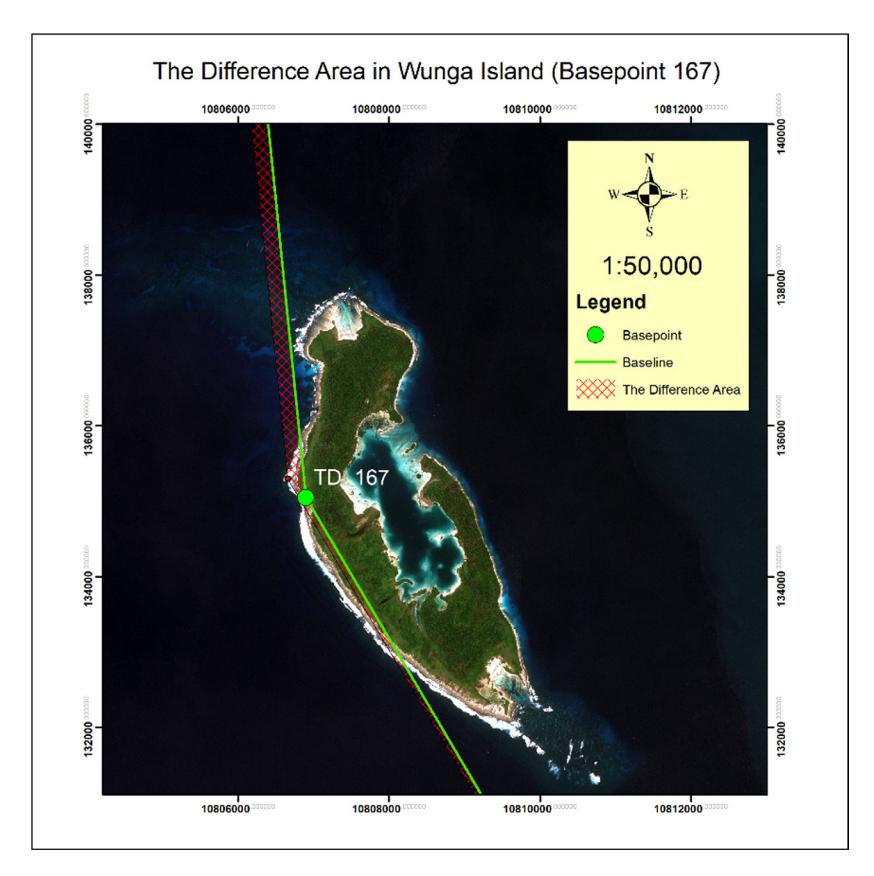
Figure 11 The Difference Area in Wunga Island (Basepoint 167)
From the three figures above, it can be seen that at the three research locations, there was an accretion phenomenon. The area around Basepoint 180, or Boega, Bireun Regency, Aceh, has a positive value for the resultant area change of 51.87 km2. This positive value indicates an accretion phenomenon at the research location. Then in the area around Basepoint 167 and Basepoint 168, due to the accretion phenomenon, there was an increase in the area of 22.94 km².
By the data obtained above, it can be proven that in addition to being an environmental problem, changes in maritime boundaries also have an impact on the Basepoint and Baseline used in drawing the country's maritime boundaries. Changes in shoreline caused by accretion phenomena can change the configuration of the shoreline. Thus, the configuration of the low water line will also change. This makes the position of the Basepoint unstable because the low water line is where the Basepoint is laid (Amfa et al., 2017; Arddinatarta et al., 2016; Djunarsjah et al., 2022; Siburian et al., 2020). An unstable Basepoint will also affect the drawing of a straight archipelagic Baseline because a straight archipelagic Baseline is formed by connecting the Basepoint. In addition to a straight archipelagic Baseline, Indonesia also uses a normal Baseline in drawing maritime boundaries. The normal Baseline is the line along the low water line along a coast (United Nations Convention on the Law of the Sea, 1982). The normal Baseline also changes when the low water line changes its configuration. Changes in this Baseline will cause changes in a country's territorial waters.
In addition to affecting the withdrawal of maritime boundaries, abrasion can also cause several problems, such as land use degradation. An example is residential land in coastal areas that has been reduced due to abrasion. Residential land will eventually disappear if we do not address the phenomenon of abrasion. In addition, abrasion can also hinder the process of developing coastal economic zones in an area.
Legal Aspects in Renewal of Baseline and Baseline
Based on the results obtained, two classes of Basepoint and Baseline conditions are caused by shoreline changes. The Basepoint is on the mainland, and the Baseline intersects the mainland. The accretion phenomenon drives both classes, causing the shoreline to advance towards the sea. Because of unstable natural conditions that can change the shoreline, UNCLOS 1982 article 7 number 2 says that the Baseline can be changed by the convention. This means that the Basepoint and Baseline can be moved. This provision is based on the principle of "Land Dominates the Sea," which means that land is the legal source of state power to expand the territorial area towards the sea. The International Court of Justice has recognized this principle. This principle was affirmed in the International Court of Justice's decision in the Maritime Delimitation in the Black Sea case involving Romania and Ukraine. In that case, the ICJ considered geographical and historical factors, including the shoreline and sovereignty over land areas, in determining the maritime boundary between the two states (International Court of Justice, 2009). This decision demonstrates that land serves as the starting point and reference for determining maritime boundaries, consistent with the principle that "land dominates the sea."
Furthermore, during the 78th session of the International Law Commission (ILC), the ILC highlighted the impact of sea-level rise on maritime boundaries and the importance of stability in Baseline determination. The ILC raised several key points during this session regarding the updating of Basepoints and Baselines due to sea-level rise. A state may undertake updates if it possesses adequate capacity to conduct regular hydrographic surveys. As an example, the International Law Commission (2023) raised concerns that using a fixed Baseline approach without having to update Basepoints and Baselines could be unsafe for navigation because the charts might not reflect the physical conditions. These points further strengthen a state's argument for updating Basepoints and Baselines in response to changes in the shoreline. Therefore, resolving land sovereignty issues takes priority before addressing maritime boundary issues.
The updating of Baseline and Basepoint is also regulated in Government Regulation 38 of 2002 concerning the List of Geographical Coordinates of Baseline Points for the Indonesian Archipelago. There are 6 chapters contained in the regulation. The fourth chapter focuses on supervising and guiding the geographical coordinates of the Basepoint to prevent potential errors, incompleteness, and changes. Based on the regulation, the Basepoint and Baseline are not optimal because shoreline changes can be renewed. The renewal ensures that UNCLOS 1982 provisions govern maritime boundary withdrawal Basepoints and Baselines. Therefore, updates on this Baseline and Basepoint can benefit Indonesia, as it can maximize the drawdown of maritime boundaries.
Conclusion
Based on the identification results using Google Earth Pro, for 50 cases, the Basepoint and Baseline were not optimal. 8 cases were obtained due to changes in the shoreline. 6 cases came from the Baseline class crossing the mainland, and 2 classes from the Basepoint were on the mainland. The DSAS platform then selected 3 sample cases from the 8 cases to calculate shoreline changes. The average accretion rate obtained in the Basepoint area, namely Wunga Island, is 5.63 m/year. The area around Basepoint 168, specifically Lahewa, has an average accretion rate of 2.27 m/year. In the area around TD 180 Boega, Kab. Bireun has an average accretion rate of 15.11 m/year. These results indicate that these accretion rates lead to shoreline changes, which subsequently alter the configuration of the low water line—the location of the Basepoints. Because the straight archipelagic Baseline is made by connecting the Basepoints, the instability of these Basepoints has a direct effect on how the Baseline is drawn. Consequently, any alteration in the straight archipelagic Baseline introduces uncertainty in Indonesia's traditional fishing and shipping areas, resulting in legal ambiguity concerning the rights of fishermen and traditional sailors in utilizing marine resources. The findings of this research are expected to serve as a reference for the Indonesian government in maintaining shorelines at Indonesian Basepoint locations, ensuring legal
certainty of Indonesia's maritime boundaries. Future studies will focus on identifying shoreline changes at other Indonesian Basepoints and Baseline locations to provide a comprehensive understanding and support ongoing maintenance efforts.
Acknowledgement
We express our gratitude to colleagues whose insights and expertise significantly contributed to this research. This study was made possible through the support of the Hydrographic Research Group at the Institut Teknologi Bandung (ITB).