
INFO ARTIKEL
Kata kunci:
urbanisasi, peri-urban, alih fungsi lahan, Cellular Automata Markov, zonifikasi
ABSTRAK
Tekanan urbanisasi telah mendorong ekspansi wilayah perkotaan Bandung ke wilayah Timur, terutama di Kecamatan Cileunyi, Rancaekek, dan Jatinangor. Sebagai wilayah peri-urban Kota Bandung yang menjadi zona peralihan antara kawasan perkotaan dan perdesaan, tantangan pengembangannya semakin kompleks, wilayah tersebut memiliki keterbatasan secara fisik namun tidak menghambat terjadinya perubahan tata guna lahan. Penelitian ini bertujuan untuk memprediksi perubahan tutupan lahan dan pola zonifikasi di wilayah peri-urban Kota Bandung bagian Timur dengan menggunakan model Cellular Automata Markov. Hasil penelitian menunjukkan pertumbuhan perkotaan di wilayah peri-urban Kota Bandung, khususnya di Kecamatan Cileunyi, terjadi secara signifikan membentuk zona bingkai kota-desa (zobikodes). Hal ini
mengindikasi adanya persaingan kuat antara kepentingan pembangunan dengan upaya pelestarian lingkungan. Model zonifikasi yang dihasilkan dapat menjadi dasar bagi perumusan kebijakan tata ruang yang lebih efektif untuk mengendalikan urban sprawl dan menjaga keseimbangan ekologis di wilayah peri urban.
Introduction
Indonesia is the fourth most populous country in the world in 2023 after India, China, and the United States, with approximately 277.7 million people (Annur, 2023). According to UN data, by 2030 it is estimated that 60.4% of the world's population will be concentrated in urban areas, or about 8.5 billion people, and in 2050 it is estimated to reach 68.4%, or about 9.7 billion people (United Nations, 2019, 2023). This phenomenon also occurs in Indonesia, where the urban population in 2020 reached 56.7% and is predicted to reach 63.4% in 2030 (BPS Indonesia, 2010; Silver, 2015).
The increase in the urban population is triggered by the high rate of urbanization (Silver, 2015). Urbanization not only signifies the movement of people from rural to urban areas but also involves spatial changes in land use, lifestyle transitions, and the culture of rural communities to urban environments (Harvey, 1985; Rijal & Tahir, 2022). Urbanization is a by-product of capitalism, which is used as a tool to shape and transform urban space. Urbanization allows for the absorption of surplus capital through the construction of road infrastructure, public facilities, real estate, and others, which support economic growth (Harvey, 1985).
Currently, urbanization is no longer focused only on city centers, but it has spread to suburban areas (peri-urban) or what is called extended urbanization (Brenner & Schmid, 2012; Pratama et al., 2021). The most dynamic urbanization process in the world occurs on the outskirts of African and Asian cities (Angel et al., 2016, cited in Follmann et al., 2023; McGranahan, 2015). The development of urbanization that spreads to the suburbs does not diminish the influence of capitalists, but rather contributes to the development of real estate, infrastructure, and industry (Pratama et al., 2021; Schmid, 2023; Harvey, 1985). To keep capitalists in check and the growth of peri-urban areas under control, the government needs to be involved in directing the process of extended urbanization. This can be done through land use policies and infrastructure development (McGee, 2005). Peri-urban itself is a transitional zone for land use, which preserves social and demographic characteristics located between urban and rural areas (McGee, 2008; Pryor, 1971). The outermost boundary of the peri-urban area is usually 30 km from the main city center (McGee, 2014).
Several things contribute to the growth of peri-urban areas, which is a type of urbanization. These include the lack of land in cities (Sinurat, 2020), the ease of access to them, the presence of transportation networks, facilities, and infrastructure, as well as lower incomes and land prices (Barbosa et al., 2022; Baum-Snow, 2007; Puspita et al., 2020; Robert et al., 2019). Other studies mentioned industrialization as a driving factor for urbanization in peri-urban areas (Harvey, 1985; Monte-Mór, 2014). Extended urbanization globally impacts the targeted peri-urban areas, such as the conversion of agricultural land, increasing population density, socio-economic changes in the population, pollution, deforestation, uncontrolled urbanization and development, land use conflicts between agriculture and urban development, congestion, arrangement of water bodies, and other resources (Barbosa et al., 2022; Darwin et al., 2019; Hardati, 2011; Rajendran et al., 2024; Woltjer, 2014). Specifically, each country's periurban areas experience different impacts as a result of extended urbanization. 1) Extended urbanization in China has led to increased competition and fragmentation of the economy in peri-urban areas (McGee, 2005). 2) In European peri-urban areas, there has been a decrease in biodiversity, landscape integrity, and environmental quality (Wandl & Magoni, 2017). 3) A lot of problems exist in developing countries like Indonesia, such as pollution of soil and waterways, poverty, the rise of informal settlements as places where social inequality is felt, and people losing access to land in peri-urban areas (Rajendran et al., 2024; Wandl & Magoni, 2017). 4) The occurrence of environmental degradation and water crisis in periurban areas in South Asia (Follmann et al., 2023).
Extended urbanization also occurs in the peri-urban areas of Bandung City. In the period 2010- 2020, the population of Bandung City increased by 49,287 people with an average growth rate of 0.21% (BPS Kota Bandung, 2011, 2021). Due to limited land in Bandung City, peri-urban areas to the east have developed rapidly. This is evident in the urban sprawl towards Cileunyi and Rancaekek Districts in Bandung Regency and Jatinangor District in Sumedang Regency. These three districts are part of the National Strategic Area (KSN) of the Bandung Basin Urban Area (Perpres No. 45, 2018). Part of Cileunyi District is the North Bandung Area, which functions as a protected area (Perda Prov. Jabar No. 2, 2016); Rancaekek District is a flood-prone area, and Jatinangor District is prone to soil movement and functions as an educational KSP area (Perda Prov. Jabar No. 9, 2022). Figure 1 provides further details.
This study aims to predict land cover changes and zoning patterns in the East Bandung peri-urban area using the Cellular Automata Markov model. The study uses secondary data. It is assumed that the practice of extended urbanization occurs in areas that have high land cover change. By guessing how land will change and how it will be zoned in this peri-urban area, the government can make good spatial planning rules to stop cities from growing too big and to keep the environment healthy in these areas. For example, they can make rules for building infrastructure and managing space, especially for Bandung Regency and Sumedang Regency.
This research is highly relevant because Bandung, as a center of urban growth in West Java (Kompasiana.com, 2021), is experiencing significant urban development pressure extending into its periurban areas. Furthermore, this study fills a gap in previous research, which only highlighted predictions of land cover change due to urbanization, by comprehensively examining predictions of zonification models for these peri-urban areas.
Figure 1 Research Area Orientation
Method
This study uses a spatial approach by utilizing secondary data from Landsat 7 ETM+ satellite imagery in 2003; Landsat 8 OLI/TIRS in 2016 and 2021 with a map scale of 1:60,000; and data from related agencies. Data on the number of extended urbanizations is not processed so that it has weaknesses in practice. Areas with high land cover changes are assumed to be areas with the most immigrants (extended urbanization).
The analysis method is a spatial analysis method through supervised satellite image classification with land cover classes in the form of vegetation, agriculture, and built-up land. Supervised image classification can be considered correct and qualified if the accuracy exceeds 80% (Fardani et al., 2020). The Cellular Automata Markov analysis method (Kang et al., 2019) can perform land development prediction modeling. The determination of 2036 as the predicted year is due to the fastest validity period of the RT/RW in the study area, namely the RT/RW of Bandung Regency. Spatial pattern plan variables are not included in this analysis, ensuring that the results align with field trends without intervention. When figuring out the size of the mapping accuracy percentage, Kappa validation tests are used to find out how many errors there is in classifying areas.
After the analysis for predicting land cover in 2036 is completed, the next stage is to determine the zoning model of the peri-urban area. The determination of this model uses the land use triangle continuum theory from Yunus (2001, 2008a). This theory can be seen in Figure 2, while the study variables used are shown in Table I, and the research stages are shown in Figure 3.
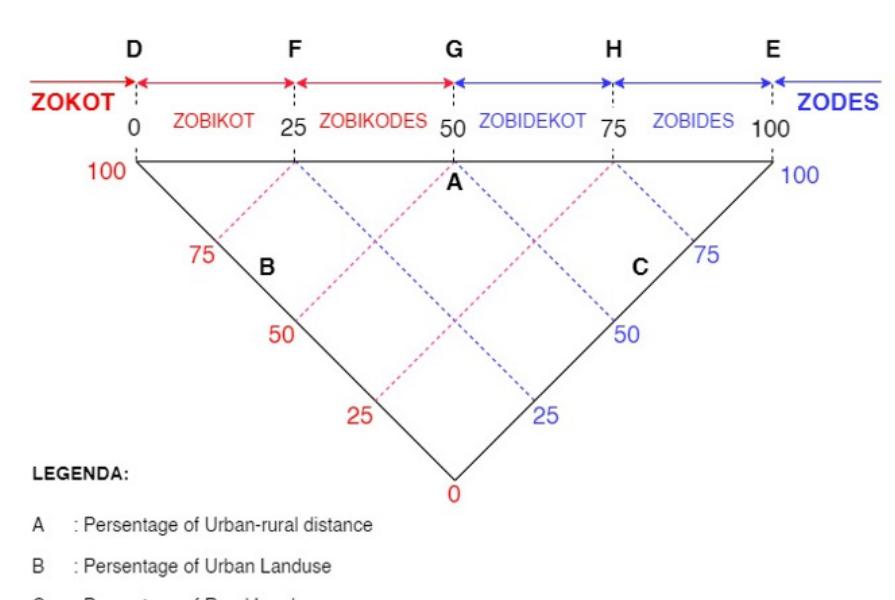
Figure 2 Peri-urban Area Zonification Model Theory (Land Use Triangle: Continuum) Source: (Redrawing from Yunus, 2001, 2008b)
Table I Research Variables for Land Cover Predicting
| No | Variabel | (Yusuf et al., 2018) | (Nugroho & Handayani, 2020) | (Fardani et al., 2020) | (Jauzi et al., 2020) | Author |
|---|---|---|---|---|---|---|
| 1 | Data Elevation Model | √ | - | √ | √ | √ |
| 2 | City distance | - | √ | √ | √ | √ |
| 3 | Population density | √ | - | - | √ | √ |
| 4 | Slope | √ | - | √ | √ | √ |
| 5 | Distance to river | √ | √ | - | - | - |
| 6 | Distance from road | √ | √ | √ | √ | √ |
| 7 | Land cover | - | - | - | √ | - |
| 8 | Distance to industry | - | - | - | - | √ |
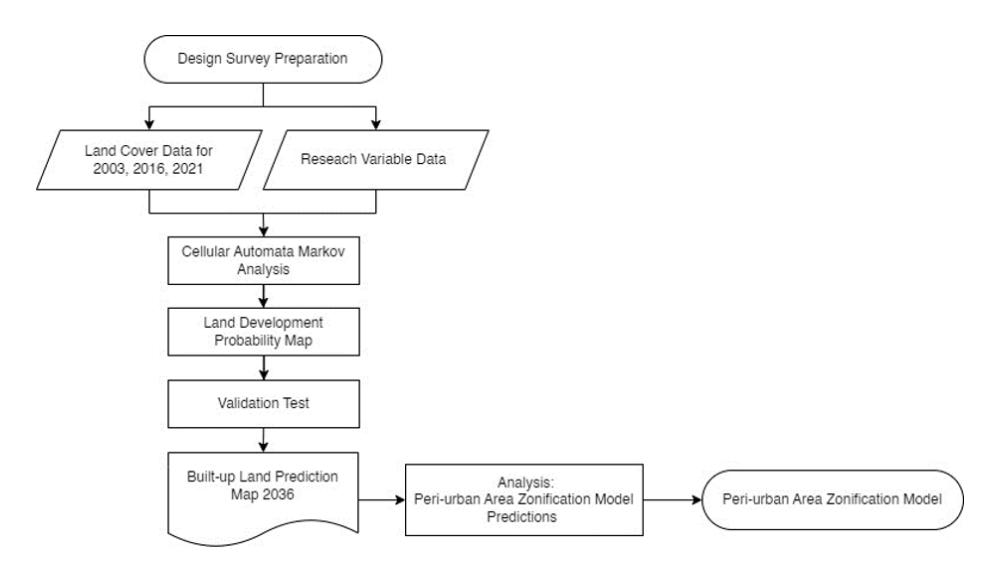
Figure 3 Research Flow Chart
Results
In accordance with the research stages above, the first analysis conducted is the 2036 land cover prediction. This analysis uses Landsat 7 ETM+ spatial data in 2003, Landsat 8 OLI/TIRS in 2016, and 2021 using the cellular automata Markov method.
Land Cover Prediction
The training sample on the Landsat 7 image in 2003 was conducted with a natural band composite (RGB 321). In contrast, we used a natural composite band (RGB 432) for the Landsat 8 OLI/TIRS image in 2016. The samples consisted of three land cover classes: vegetation, agriculture, and built-up land. Sample classification is used because the land cover, including forests and mixed gardens, is extensive and therefore categorized as vegetation. The study area readily displays agricultural classification, in addition to the presence of LSD (Protected Rice Field Land) data. The image quickly identifies the main object of study, which is the built-up land classification. Landsat image data for 2003, 2016, and 2021, as well as the results of the 2036 analysis, can be seen in Table II, Figure 4, and the graph in Figure 5.
Tabel II Land Cover Data from Image Classification Results for 2003, 2016, 2021, and Land Cover Prediction in 2036
| No | Districts | Land Cover | Landcover Area (Ha) | Percentage (%) | Prediction in 2036 | |||||
|---|---|---|---|---|---|---|---|---|---|---|
| 2003 | 2016 | 2021 | 2003 | 2016 | 2021 | Area (Ha) | % | |||
| 1 | Cileunyi | Vegetation | 969,39 | 586,71 | 452,17 | 30,77% | 18,62% | 14,35% | 490,68 | 15,60% |
| Farming | 1.504,13 | 1.358,96 | 1.231,58 | 47,74% | 43,13% | 39,09% | 731,84 | 23,27% | ||
| Built-up | 677,19 | 1.205,08 | 1.467,01 | 21,49% | 38,25% | 46,56% | 1.922,41 | 61,13% | ||
| Total | 3150,71 | 3150,75 | 3150,76 | 100,00% | 100,00% | 100,00% | 3.144,93 | 100,00% | ||
| Rancaekek | Vegetation | 55,78 | 6,44 | 1,58 | 1,24% | 0,14% | 0,04% | 1,31 | 0,03% | |
| Farming | 3.676 | 3.309,29 | 2.900,27 | 81,82% | 73,65% | 64,55% | 2.761,20 | 61,60% | ||
| 2 | Built-up | 761,15 | 1.177,53 | 1.591,39 | 16,94% | 26,21% | 35,42% | 1.720,28 | 38,38% | |
| Total | 4492,93 | 4493,26 | 4493,24 | 100,00% | 100,00% | 100,00% | 4.482,79 | 100,00% | ||
| Jatinangor | Vegetation | 812,23 | 475,53 | 321,08 | 31,34% | 18,35% | 12,39% | 389,53 | 15,07% | |
| 3 | Farming | 1.114,62 | 1.082,44 | 1054,84 | 43,01% | 41,77% | 40,71% | 738,43 | 28,57% | |
| Built-up | 664,48 | 1.033,39 | 1215,46 | 25,64% | 39,88% | 46,90% | 1.456,87 | 56,36% | ||
| Total | 2591,33 | 2591,36 | 2591,38 | 100,00% | 100,00% | 100,00% | 2.584,83 | 100,00% | ||
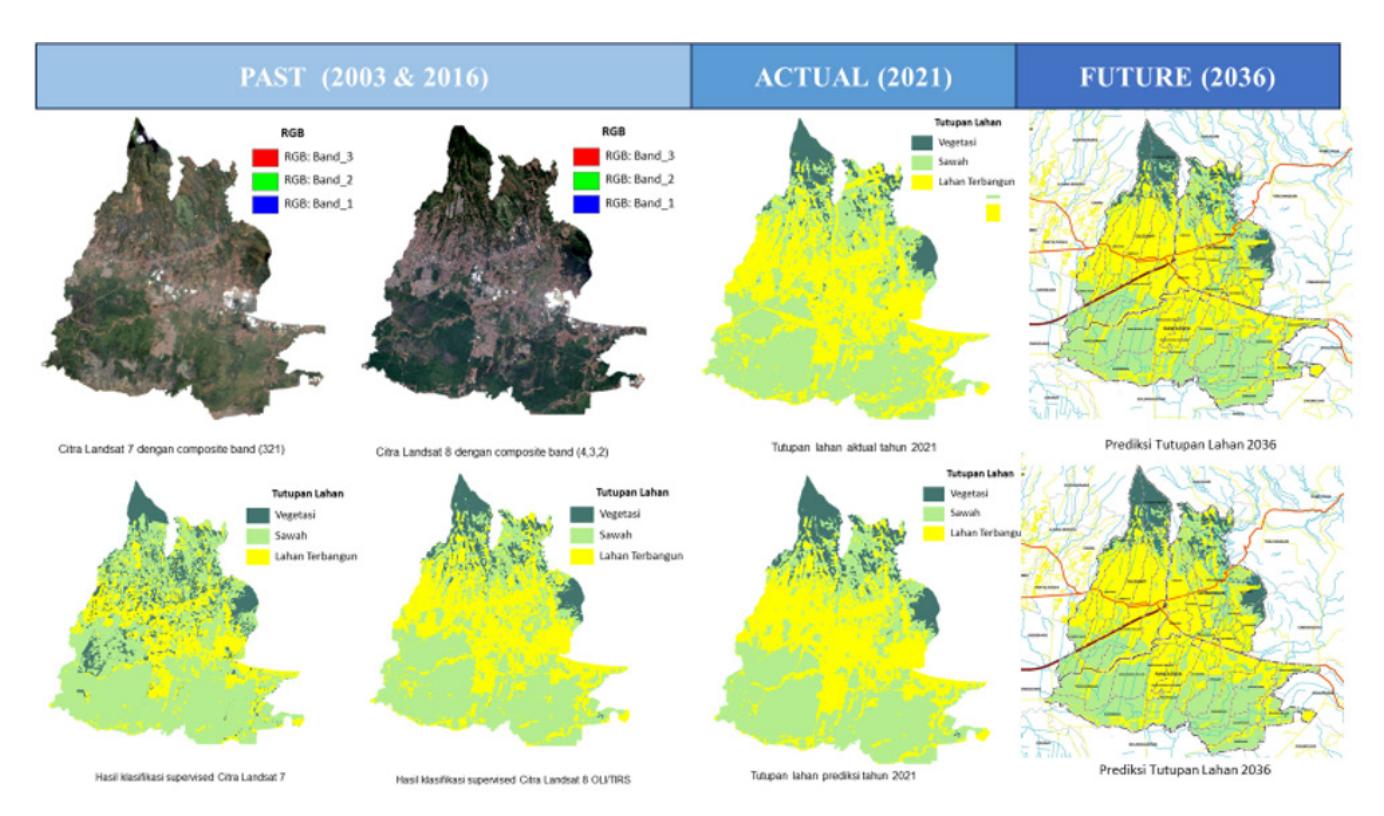
Figure 4 Transformation and Processing Land Cover Prediction in 2036
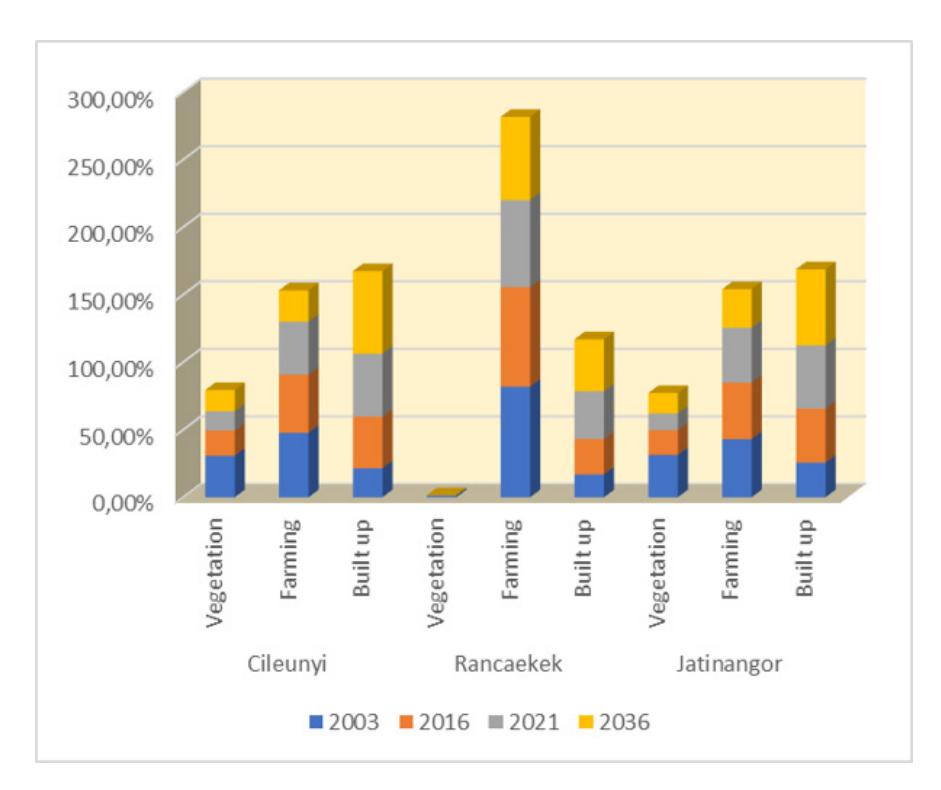
Figure 5 Land Cover Development in 2003, 2026, 2021 and Prediction in 2036
Based on the land cover prediction for 2036, the land cover in the study area experienced both growth and shrinkage. Growth occurred in built-up areas and vegetation land cover, which resulted from agricultural land conversion. On the other hand, shrinkage is limited to areas with agricultural land cover.
- 1. The built-up area in 2036 grew by 19.44% or 830.89 ha from the built-up area in 2021. Cileunyi District experienced the largest growth in built-up areas, followed by Rancaekek District and Jatinangor District. The built-up area in Cileunyi District is predicted to grow by 579.38 ha from 2021 to 2036. In Rancaekek District, the built-up area is predicted to grow by 425.55 ha, while Jatinangor District is expected to see an increase of 361.37 ha in built-up area. Based on observations and analysis, the high conversion rate from agricultural land to built-up in Cileunyi and Rancaekek Districts is due to the numerous access points to Bandung City and their proximity to the secondary development center of Bandung City is located in Gede Bage District. The highest prediction of the built-up area until 2036 is found in Cileunyi District, at 61.13%, followed by Jatinangor District at 56.36% and Rancaekek District at 38.38% of the total land area.
- 2. Vegetation land cover experienced growth in 2036 due to the conversion of agricultural land into mixed plantations (besides becoming built-up areas). Based on the observation and analysis results, vegetation land cover in Jatinangor District is predicted to increase by 122.74 ha in 2036, by 81.04 ha in Cileunyi District, and by 1.25 ha in Rancaekek District.
- 3. The agricultural land experienced a reduction across the entire study area. Between 2021 and 2036, the agricultural land cover decreased by 955.22 ha (for both built-up areas and vegetation/ mixed plantations). Cileunyi District had the largest reduction in agricultural land, amounting to 499.74 ha, while in Jatinangor District, the agricultural land cover decreased by 316.41 ha, and in Rancaekek District, it decreased by 139.07 ha.
The prediction of built-up land development, specifically urban sprawl until 2036, indicates that it will occur evenly in Cileunyi District, which is in the northern part and a protected area within the North Bandung Area. According to the data from 2003 to 2021, there has been an increase in the area built up in this part, which is identified as a population settlement. The encroachment of the city that occurs to the north must be stopped immediately and controlled because it will reduce the protected area, which has a fatal impact on the area below in the form of landslides and floods. The prediction of built-up land development in this case, urban sprawl for Jatinangor District, occurs in the central and southern parts. The East and North are still green. This tendency is influenced by its physical condition, which is prone to soil movement. The prediction of built-up land development in this case, urban sprawl in Rancaekek District, occurs along the corridor of national roads and local roads. This Rancaekek District is prone to flood disasters, but the access factor and the many facilities built along the national road corridor make the development trend expand to a radius of 1 km behind. Green land/agriculture, which is identified as a rural area, is in the southern part.
Prediction of Peri-Urban Zoning Model
After obtaining the land cover prediction, the next step is to create a model predicting the zoning of peri-urban areas in the districts of Cileunyi, Rancaekek, and Jatinangor. The peri-urban areas predicted to experience rapid development are Cileunyi District, followed by Jatinangor District and Rancaekek District. The determination of this model is based on the percentage of built-up area development mapped into the land use matrix of the continuum triangle by Yunus (2001, 2008b). This matrix describes four zoning models for peri-urban areas based on the proportion of the built-up area to the total land area: 1) City Frame Zone (Zobikot), with a built-up area > 75%, 2) City Village Frame Zone (Zobikodes), with a built-up area ranging from 50-75%, Village City Frame Zone (Zobidekot) with a built-up area ranging from 25-50% or agricultural area around 50-75% of the total area, and 3) Village Frame Zone (Zobides) with a built-up area of 0-25% or agricultural area of 75-100%. For further details, refer to Table III and the built-up land maps for the years 2003, 2016, 2021, and the prediction for 2036 in Figure 6.
Table III Peri-Urban Land Use Triangle: Continuum Classification
| Land Use Characteristic | |||||
|---|---|---|---|---|---|
| No | Zona | Rural | Urban | ||
| 1 | Zona Bingkai Kota (Zobikot) | <25-0% | >75-100% | ||
| 2 | Zona Bingkai Kota-Desa (Zobikodes) | >25-50% | >50-75% | ||
| 3 | Zona Bingkai Desa-Kota (Zobidekot) | >50-75% | <50-25% | ||
| 4 | Zona Bingkai Desa (Zobides) | >75-100% | <25-0% | ||
(Source: Yunus, 2008b) Built-up Area 2003 Built-up Area 2016 Built-up Area 2021 Built-up Area 2036
Figure 6 Built-up Are in 2003,2026, 2021 and Prediction in 2036
Looking back at 2003, the peri-urban zoning of Jatinangor District (Zobidekot) was more developed than Cileunyi and Rancaekek Districts, which are currently in the Zobides position. This is due to the development of Jatinangor District as an educational area, which is beginning to thrive. In 2021, the third position of all districts is in the Zobidekot zonification model. The prediction of the peri-urban zoning model for 2036 comprises two scenarios: Zobikodes for Cileunyi and Jatinangor Districts and the Zobidekot model for Rancaekek District. It is predicted that the development of Cileunyi District, based on the Bandung Regency Spatial Plan (RTRW) and field conditions, will focus heavily on residential areas and settlements, as well as trade and services.
The prediction of the peri-urban zonification model for Jatinangor District is influenced by its function as an Educational Strategic Development Zone (KSP Pendidikan). Currently, there are several universities in the area, such as Ikopin, IPDN, Unwin, Unpad, and ITB. The development of Jatinangor District is closely related to the issue of forming an administrative city in Jatinangor. Land speculation and development investments are abundant in this district, besides educational facility development. Rancaekek District is predicted to have slower development in its zoning model. According to the RTRW and field conditions, industrial activities, housing, and settlements, as well as agriculture, dominate land use. Further details on the development of zoning in the suburban areas of the research area can be seen in Table IV, while a detailed analysis for the 2036 prediction can be found in Table V and Figure 7.
Table IV Zonification of Peri-urban Area Transformation from 2003, 2016, 2016, 2021, & Prediction in 2036
| Districts | Percentage of Built-up Area (%) | Zonification of Peri-urban Area | |||||||
|---|---|---|---|---|---|---|---|---|---|
| No | 2003 | 2016 | 2021 | 2036 | 2003 | 2016 | 2021 | 2036 | |
| 1 | Cileunyi | 21,49% | 38,25% | 46,56% | 61,13% | Zobides | Zobidekot | Zobidekot | Zobikodes |
| 2 | Rancaekek | 16,94% | 26,21% | 35,42% | 38,38% | Zobides | Zobidekot | Zobidekot | Zobidekot |
| 3 | Jatinangor | 25,64% | 39,88% | 46,90% | 56,36% | Zobidekot | Zobidekot | Zobidekot | Zobikodes |
| No | Districts | Land Cover | Area (Ha) | % | Land Use Characteristics (%) | ||
|---|---|---|---|---|---|---|---|
| Rural | Urban | Zona | |||||
| 1 | Cileunyi | Vegetation | 490,68 | 15,60 | 38,87 | 61,12 | Zobikodes |
| Farming | 731,84 | 23,27 | |||||
| Built-up | 1.922,41 | 61,12 | |||||
| Total | 3.144,93 | 100 | |||||
| 2 | Rancaekek | Vegetation | 1,31 | 0,02 | 61,61 | 38,37 | Zobidekot |
| Farming | 2.761,20 | 61,59 | |||||
| Built-up | 1.720,28 | 38,37 | |||||
| Total | 4.482,79 | 100 | |||||
| 3 | Jatinangor | Vegetation | 389,53 | 15,06 | 43,62 | 56,36 | Zobikodes |
| Farming | 738,43 | 28,56 | |||||
| Built-up | 1.456,87 | 56,36 | |||||
| Total | 2.584,83 | 100 |
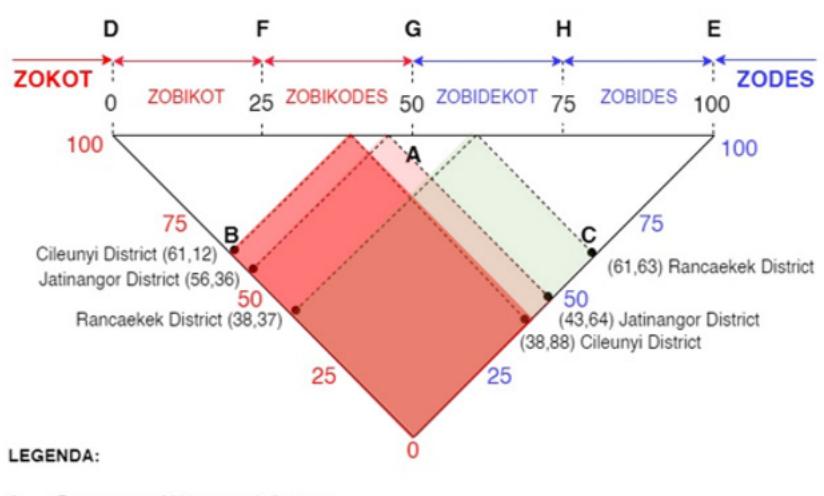
Figure 7 The Zonification Model Prediction of Eastern Bandung Peri-Urban Area in 2036
Discussion
The results of the study indicate that the urbanization process in the peri-urban areas of Eastern Bandung City, especially in Cileunyi, Rancaekek, and Jatinangor Districts, has caused significant changes in land use patterns. Predictions of land cover changes until 2036 indicate a significant increase in built-up land, which has implications for reducing agricultural land area and changes in vegetation distribution. This phenomenon is in line with the concept of extended urbanization which has been widely studied in various previous literature (Brenner & Schmid, 2012; Pratama et al., 2021).
The increase in urban land characteristics in Cileunyi District, which reached 61.12%, shows the attractiveness of this area as a residential and economic development area, especially because of its proximity to the center of Bandung City and its high accessibility. The rapid urbanization process of
Cileunyi District cannot be separated from its function as the center of WP Cileunyi-Rancaekek and the center of PKLP Cileunyi-Rancaekek, which functions as the development of trade and service areas, housing, settlements, industry, agriculture, plantations, and conservation. The thing that must be anticipated and controlled from its development is the urban sprawl phenomenon that is starting to move north of Cileunyi District, which is part of the North Bandung Area (KBU) and functions as a protection.
Similar things happened in Jatinangor and Rancaekek Districts, although on a slightly lower scale. Development in Jatinangor District has not spread massively to disaster-prone areas. This condition must be maintained and controlled so that the balance of nature is maintained. This also applies to the Rancaekek District, which is vulnerable to flooding. The development of built-up land must be controlled so that the runoff is not high, so that water is absorbed into the ground, or so that it can be collected in retention ponds. Studies on urban sprawl and its effects on urban ecology (Barbosa et al., 2022; Darwin et al., 2019) have said that this shows a conflict between the need for development and the need to protect the environment.
Zoning prediction analysis using Markov Cellular Automata shows that regional growth patterns tend to follow the urban-rural frame zoning pattern (zobikodes), which is a general characteristic of peri-urban areas. This data indicates that the peri-urban area of Eastern Bandung City is undergoing a transformation that is not only influenced by population growth and infrastructure needs but also by economic and social factors and applicable spatial planning regulations. The zoning model produced in this study can be a basis for local governments in designing more effective spatial planning policies to control uncontrolled urban expansion.
However, there are several challenges in implementing urban sprawl control policies. One of these challenges is the lack of spatial planning regulations that effectively balance development needs with environmental preservation. For example, although Cileunyi District is partly included in the North Bandung Area, which has the status of a protected area, urbanization pressure remains high, which has the potential to cause environmental degradation if not properly regulated. Likewise, Rancaekek District is developing as an industrial hub, trade and service center, agricultural zone, and residential area. Due to its flood-prone nature, this district requires greater attention in spatial planning to prevent increasing environmental impacts from changes in land use, particularly the presence of industry. Meanwhile, Jatinangor District is developing rapidly because it is part of the West Java Provincial Strategic Education Area, which includes the IPDN, Ikopin, ITB, and UNPAD campuses. Its existence has accelerated the growth of housing and settlements, as well as trade and services. Therefore, it is not surprising that Jatinangor has become an administrative city since the early 2010s.
This study lacks primary data on the number of actors in extended urbanization, making its practice difficult to describe. Land cover change-based zonification predictions are based on what happens in places where there is a lot of land change, which may not fully reflect how the local community's economy works. To get a fuller picture of how the Eastern Bandung City peri-urban area has changed over time, more research is needed that looks at both space and society and the economy.
Overall, the results of this study confirm that extended urbanization in the peri-urban area of Eastern Bandung City requires a more comprehensive management strategy. The resulting zonification model can be used as a reference in sustainable spatial planning, especially in controlling the negative impacts of urban expansion on the ecological balance and welfare of local communities. The government and related stakeholders need to collaborate in designing evidence-based policies to address the challenges of urbanization in peri-urban areas more effectively. This effective spatial policy is intended to control urban sprawl and maintain ecological balance in peri-urban areas, such as preparing development infrastructure and spatial control policies, especially for Bandung Regency and Sumedang Regency.
Conclusion
This study reveals that extended urbanization in the peri-urban area of Eastern Bandung City has caused significant changes in land use, especially an increase in built-up land and a decrease in agricultural land. This study uses the Markov Cellular Automata model to predict how land use will change until 2036 and create a zoning model that shows how long-term urbanization happens.
The study found that the built-up areas of Cileunyi and Jatinangor Districts grew a lot, forming a zobikodes zonification pattern. Rancaekek District, on the other hand, is still in the zobidekot category, with a lot of industrial and agricultural activities. This means that the urbanization process of Cileunyi and Jatinangor Districts is faster than Rancaekek. This transformation shows that the peri-urban area is not only an extension of the city but also experiences pressure from various economic factors, infrastructure, and spatial planning regulations.
The main contribution of this study to science is in providing a predictive model based on spatial data that can be used to formulate more adaptive and sustainable spatial planning policy strategies. This study also highlights the importance of integrating spatial and socio-economic approaches in understanding the complex phenomenon of urbanization. To keep ecological balance and stop urban sprawl in the periurban areas of Eastern Bandung City, we need a better way to run the government. This can be done by planning infrastructure better and having stricter rules about where people can and cannot live. The study's results should help local governments and other interested parties produce more flexible and longlasting spatial planning and control policies. This way, they can find a balance between economic growth and protecting the environment in peri-urban areas.