
INFO ARTIKEL
Kata kunci:
teknologi informasi, motivasi, kualitas penyusunan anggaran
ABSTRAK
Penelitian ini bertujuan untuk mengetahui dan menganalisis pengaruh faktor-faktor yang mempengaruhi kualitas penyusunan anggaran pendapatan belanja daerah (APBD) dengan motivasi sebagai variabel moderating di Kota Medan. Penelitian ini memiliki populasi sebanyak 76 orang responden dari 34 satuan kerja pemerintah daerah (SKPD) di Kota Medan. Sampel yang digunakan yaitu sampel jenuh, seluruh populasi dijadikan sebagai sampel. Pengolahan data menggunakan uji structural equation modelling (SEM) dengan Smart-PLS. Penelitian ini menyimpulkan bahwa kompetensi sumber daya manusia dan pemanfaatan teknologi informasi berpengaruh signifikan terhadap kualitas penyusunan APBD, sedangkan variabel motivasi tidak dapat memoderasi terhadap kualitas penyusunan APBD di kota Medan.
Introduction
The implementation of regional autonomy has significantly reshaped the financial and accounting frameworks within local governments, fostering greater transparency and accountability (Verasvera, 2016). This shift is supported by a series of central regulations, such as Law No. 17 of 2003 on State Finance and Law Nos. 32 and 33 of 2004 on Regional Autonomy and Fiscal Balance, as well as subsequent regulatory updates, which have collectively strengthened governance structures in regional budgeting.
The transition toward performance-based budgeting requires essential preconditions for success. These include (1) robust leadership and commitment at every administrative level, (2) continuous refinement of planning and budgeting procedures, (3) adequate resourcing in terms of funds, time, and personnel, (4) clear systems of rewards and sanctions, and (5) a determined organizational will to implement reforms (BPKP, 2005). However, the fulfilment of these prerequisites remains uneven across Indonesian regions.
Despite regulatory efforts, the quality of budget planning and formulation in many regional governments remains suboptimal. This is evident in the persistent gap between planning and implementation and the disproportionate allocation of budgets toward indirect expenditures. In the case of Medan City, these challenges are reflected in recurring qualified opinions (WDP) from the Audit Board of the Republic of Indonesia (BPK) and underutilization of budget due to incomplete infrastructure projects. Additionally, deficiencies in human resources and lack of motivation among budget officers further constrain the implementation of performance-based budgeting. These problems highlight the need for empirical investigation into the determinants of budgeting quality, especially the roles of human competence, information technology utilization, and motivational factors.
As digital transformation accelerates in public administration, various studies emphasize how the use of information technology (IT) in budgeting processes enhances the quality of financial planning and improves transparency. Recent works suggest that integrating IT into the budgeting process can significantly streamline operations and foster better decision-making in government spending (Celestin, 2025; OECD, 2023). Furthermore, the utilization of advanced technologies such as blockchain is contributing to more accountable and transparent public budgeting systems (Celestin, 2025). However, despite the growing reliance on digital tools, challenges related to effective integration and the alignment of digital strategies with the public sector continue to persist (World Bank, 2023).
Funding for development through intergovernmental transfers—such as general allocation funds, special autonomy funds, and adjustment funds—has grown under decentralization. However, the actual outcomes of these transfers vary widely across regions. For example, high transfer receipts do not always translate into improved human development index (HDI) scores, poverty alleviation, or inclusive growth (Ministry of Finance, 2022). Such variation indicates inefficiencies in planning, allocation, and execution processes that require further scrutiny.
The distribution of intergovernmental transfer funds, including the general allocation fund (Dana Alokasi Umum/DAU) and village funds (Dana Desa), has long served as a principal instrument in Indonesia's fiscal decentralization policy. However, the effectiveness of these fiscal allocations in enhancing regional development outcomes—such as the human development index (HDI), poverty reduction, and economic growth—remains a subject of ongoing debate. Empirical studies have indicated that a high per capita transfer allocation does not necessarily correlate with improved development performance at the regional level.
Furthermore, economic growth could have a negative impact on HDI when it is not accompanied by equitable distribution and targeted poverty reduction strategies. In this context, village funds serve a strategic function when they are directed toward needs-based programs that effectively reach disadvantaged populations (Sijabat, 2024).
Concerning the quality of spending in the APBD, there are several ongoing issues. A significant worry is the poor quality of regional planning. Moreover, the disconnect between planning and budgeting
continues to be a prevalent concern in many areas. These issues are worsened by the reality that a large share of the APBD is directed toward indirect expenditure instead of direct spending.
The Medan City government is a public sector organization located in North Sumatra Province that has adopted economic policies aimed at encouraging a more dynamic and progressive economic development. As a public sector entity, the Medan City government bears the responsibility of delivering public services intended to improve the welfare and well-being of its citizens. This process involves managing regional finances and utilizing the revenue generated to maximize the existing potential for regional growth. Medan functions as an autonomous region with a decentralized governance model. Consequently, with the decentralization of local governance and the growing public demand for transparency and accountability, the Medan City government needs to create a financial management system that improves the effectiveness and efficiency of its operations while ensuring adherence to regulations, orderliness, and responsibility.
The local government budget is reflected in the APBD, which acts as the annual financial blueprint for the region. The regional financial agency or badan keuangan daerah (BKD) supervises budgeting and treasury responsibilities, playing a vital role in planning expenditures and managing the Medan City government's financial matters. Public funds acquired through the APBD must be allocated to programs and initiatives that enhance regional development and community welfare. Given the constraints of budgetary resources, funds must be managed efficiently and effectively to meet the unlimited needs of the population. As a result, budget planning must be arranged according to priority programs that correspond with public needs. Budget formulation is a technical process, with finance, figures, and estimates being fundamental components of the budgeting process. However, beyond these technical aspects, the human element plays a crucial role as individuals prepare budgets and communities operate within them. Budgeting is recognized as a core component of short-term planning and serves as the foundation of control systems (Lubis, 2017).
As the administrative center of North Sumatra Province, Medan covers an area of 265,100 hectares and has a population of 2,097,610 residents, making it the most densely populated region in the province. The city's workforce consists of 21,087 employees, including 19,619 central government employees and 2,468 local government employees. In 2019, the total APBD revenue was IDR 2,628.1 billion, with indirect personnel expenditures reaching IDR 1,266.9 billion and direct personnel expenditures totaling IDR 268.7 billion.
The quality of APBD preparation in Medan has not reached an optimal level, as evidenced by the city's local government financial report (LKPD), which received a qualified opinion (WDP) from 2015 to 2019, as indicated in Table I.
Table I Medan LKPD Report 2015-2019
| 2018 2019 |
|---|
| √ √ |
Source: https://www.bpk.go.id/
Based on the table above, it is evident that the budget preparation quality in Medan City remains suboptimal. Additionally, the low budget absorption rate is attributed to unfinished physical projects under government agencies with significant budget allocations, such as the public works department
(PU), the sanitation and landscaping department (DKP), and the housing, settlement, and spatial planning department (DISPERKIM) of Medan City. The incomplete implementation of APBD preparation in Medan is also due to a lack of human resources that are capable of developing performance-based budgeting as expected, as well as a lack of commitment from all organizational components.
Furthermore, based on the most recent data from the 2023 financial report of the Medan City government, the municipality recorded a budget surplus (SiLPA) of IDR 68.68 billion. This figure represents the difference between the surplus/deficit in the budget realization report (LRA) and net financing. In addition, in 2021, Medan City's actual revenue reached IDR 5.02 trillion, representing 96.43% of the budgeted amount, while actual expenditure stood at IDR 4.49 trillion, or 78.5% of the allocated budget. This indicates poor budget quality, as the allocated budget remains excessively high compared to its realization.
The APBD and RAPBD preparation process has undergone several reforms following the latest regulation that replaces the Minister of Home Affairs Decree No. 29 of 2002, which is the Minister of Home Affairs Regulation No. 77 of 2020 on Technical Guidelines for Regional Financial Management. The 2020 regulation establishes principles of financial management that emphasize transparency, accountability, participation, and results-oriented budgeting. This reflects a significant shift from the previously applied top-down approach toward a more responsive model that addresses public needs.
Furthermore, for the preparation of the Regional Revenue and Expenditure Budget (APBD) for Fiscal Year 2025, the government issued Minister of Home Affairs Regulation No. 15 of 2024 on Guidelines for the Preparation of the 2025 Regional Budget. This regulation underscores the importance of policy synchronization between central and local governments, the utilization of regional government information systems, and the allocation of budgetary resources for strategic issues such as stunting reduction and inflation control.
Despite these reforms, regional budgeting still requires further improvement. Numerous public complaints highlight issues regarding budget allocations that fail to align with actual needs and priorities and lack economic efficiency and effective considerations. Therefore, an improved budget preparation mechanism is essential to assist local governments in developing APBD in a manner that aligns with the objectives of the Medan City government while complying with existing laws and regulations.
APBD Budgeting Preparation Quality
The preparation of the APBD in Indonesia is regulated by the Minister of Home Affairs Regulation No. 33 of 2019, which outlines the guidelines and preparation schedule for these budgets within a fiscal year (January to December). The process begins with the regional development planning forum (Musrenbang), followed by the formulation of the general budget policy (KUA) and temporary budget priorities and ceilings (PPAS). It concludes with the ratification of the draft of APBD (RAPBD) and its final approval during a plenary session of the regional house of representatives (DPRD). The quality of the APBD preparation can be assessed through several dimensions, including:
a. Economic Value
The economic aspect evaluates regional expenditures through the lens of increasing budget allocations, reflecting broader expenditure coverage. Analyses indicate that regional budgets in all surveyed locations have increased by 5% to 10% annually and are considered to meet this economic criterion.
b. Efficiency
The efficiency of the APBD preparation is assessed by the outcomes produced relative to the allocated budget and time frame. Field observations reveal that none of the surveyed locations achieved significant outcomes from their expenditures, and the normative timelines for the APBD
preparation were frequently disregarded, leading to delays. However, Medan City merged as an exception.
c. Effectiveness
The effectiveness of expenditure is judged based on the perceived benefits to stakeholders. Findings from field studies indicate that surveyed regions did not regard their expenditures as particularly impactful or meaningful, treating them as routine. In contrast, Medan City distinguished itself by prioritizing direct expenditures over indirect ones, thereby achieving more satisfactory results.
d. Equity (Fairness)
The principle of equity in the APBD preparation concerns allocating budgets to support disadvantaged or low-income populations through fair procedures. Despite a commitment to poverty alleviation in regional budgets, financial constraints often hinder the ability to allocate adequate funds for poverty reduction initiatives. Additionally, the burden of personnel expenditure poses a challenge in most surveyed regions.
e. Accountability
Accountability pertains to the accuracy and completeness of documentation related to expenditure processes, ensuring traceability. Field studies revealed no procedural violations in the APBD preparation across most locations, except for those under legal scrutiny. While documentation was frequently available and traceable, North Sumatra Province was noted as less accountable in this regard.
f. Responsiveness
Evaluating responsiveness focuses on the transparency of the APBD preparation process, ensuring community stakeholders can contribute and engage meaningfully. Most surveyed regions facilitated public participation through Musrenbang and open hearings and offered additional channels for public involvement, such as hotline services to encourage community engagement.
According to the Minister of Home Affairs Regulation No. 33 of 2019 for Fiscal Year 2020, the APBD preparation process, is based on the following principles:
- 1. Alignment with governance needs and financial capacity.
- 2. Consistence with public interest and overarching statutory regulations.
- 3. Guided by the regional government work plan (RKPD), general budget policy (KUA), and temporary budget priorities and ceilings (PPAS).
- 4. Timeliness in accordance with legal stipulations.
- 5. Participatory engagement.
- 6. Compliance with statutory regulations while considering efficiency, economy, effectiveness, accountability, fairness, propriety, and public benefit.
Budget formulation results from a structured planning process that starts with government policy creation and extends to the implementation of activities in each organizational unit.
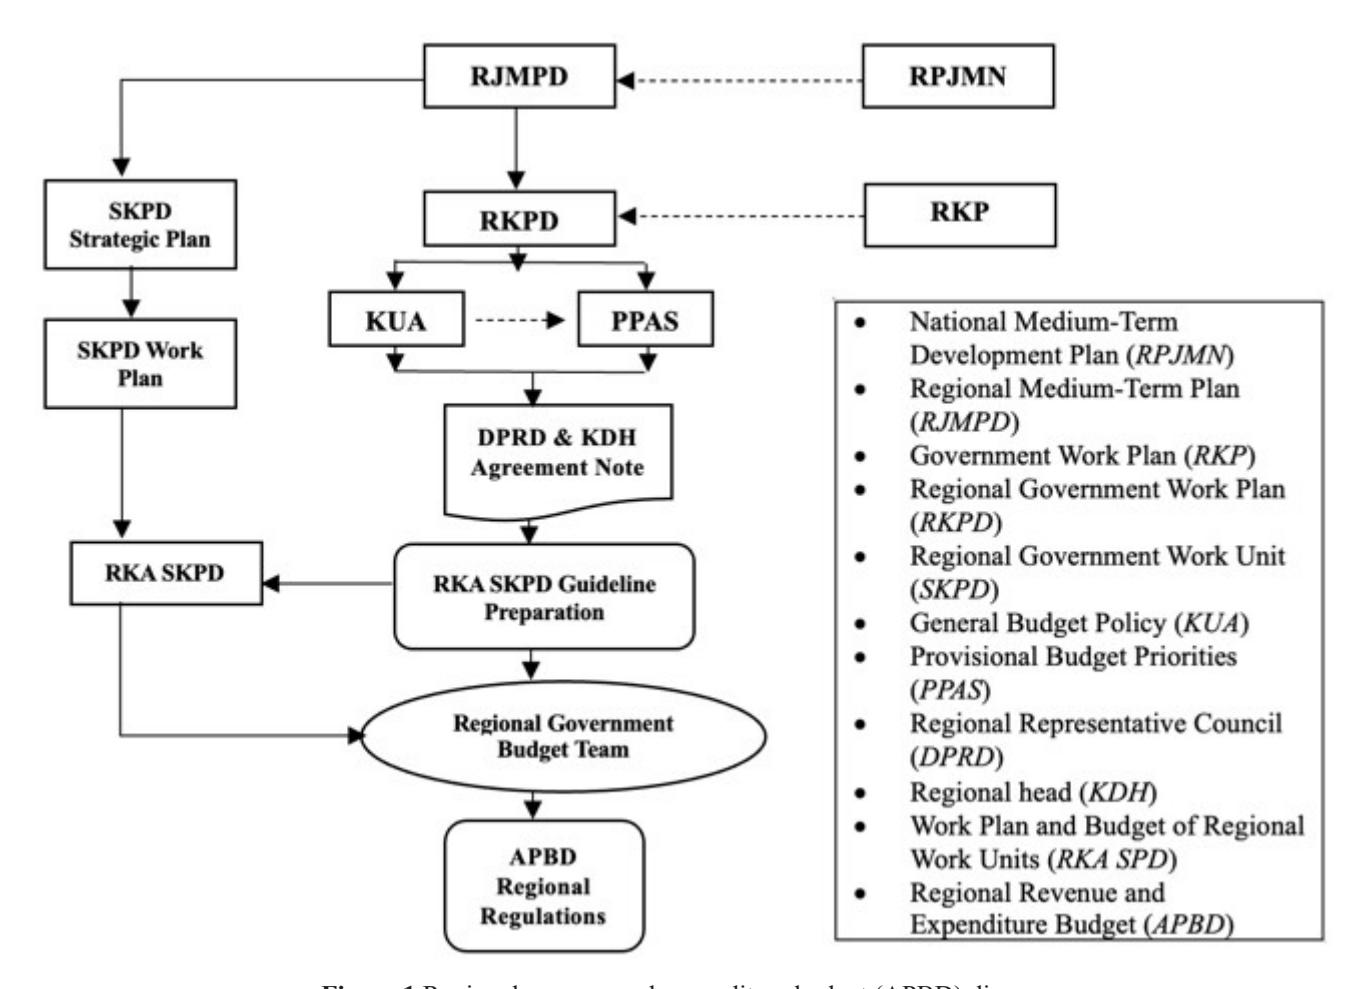
Figure 1 Regional revenue and expenditure budget (APBD) diagram
The diagram above illustrates that budget formulation in local governments begins with regional medium-term development (RJMDP), which then leads to the formulation of the regional government work plan (RKPD). Subsequently, the local government submits a draft of the general budget policy (KUA) and the provisional budget ceiling and priorities (PPAS)—both of which align with the RKPD to the regional house of representatives (DPRD). Based on the discussions regarding KUA and PPAS, the budget allocation plan (PPA) is established through a mutual agreement between the DPRD and the local government. This agreement results in the formulation of the regional revenue and expenditure budget (APBD) for the corresponding fiscal year, which is officially enacted through a regional regulation (PERDA).
Information Technology
The integration of information technology (IT) is pivotal in optimizing and expediting budget preparation processes. IT facilitates efficient processing, management, retrieval, compilation, storage, and manipulation of data, thereby ensuring the generation of high-quality information that is pertinent, accurate, and timely for various entities, be they personal, commercial, or governmental. This information serves as a foundational strategic asset in the decision-making continuum (Sutabri, 2012).
Information technology comprises hardware and software components, including computers, electronic office equipment, factory equipment, and telecommunications tools(Mulyadi, 2014). According to Kadir (2014), information technology is categorized into six main groups:
- 1. Input Technology: Devices like mice and scanners that capture data.
- 2. Output Technology: Displays information on monitors and produces hard copies via printers.
- 3. Software Technology: Programs that provide instructions for hardware and generate information.
- 4. Storage Technology: Solutions ensuring data is secure and accessible.
- 5. Telecommunication Technology: Facilitates long-distance communication and data transmission.
- 6. Processing Machines: Execute data storage and application processes.
The integration of IT in regional budget preparation enhances effectiveness and efficiency. Factors influencing its adoption include
- 1. Social Factors: Cultural values and interpersonal agreements affecting technology use.
- 2. Individual Sentiment: Personal enjoyment and satisfaction with technology in task completion.
- 3. Complexity: The perceived difficulty of using new technology.
- 4. Task Fit: The alignment between user needs and the technology used.
- 5. Long-term Consequences: Impact on flexibility and employment prospects from technology use.
- 6. Facilitating Conditions: External support factors for technological implementation.
Overall, leveraging IT in budget preparation not only boosts efficiency but also aids in informed decision-making across organizations.
Method
The causal framework of this quantitative study is presented below.
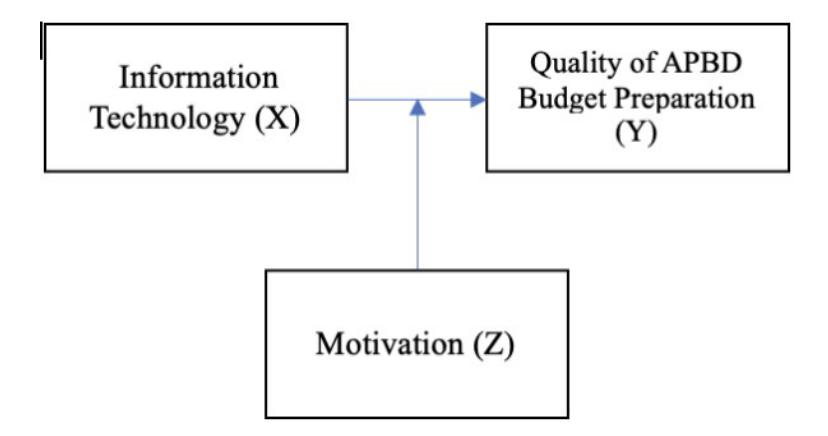
Figure 2 Research framework
The use of information technology serves as an independent variable, while the quality of regional budget planning is the dependent variable, with motivation as a moderating variable. Information technology is essential in improving task completion, especially during the budget preparation process for regional revenue and expenditure. It facilitates the processing, retrieval, organization, and editing of information, ensuring it is relevant, accurate, and timely for decision-making in personal, business, and governmental contexts (Sutabri, 2012).
Motivation refers to an individual's intrinsic desires, needs, and goals that drive specific behaviors or actions. A high level of motivation among employees significantly influences their performance, affecting overall organizational effectiveness. In this study, motivation is considered as a moderating factor that could influence the effectiveness of information technology utilization in improving budget preparation quality. This study will explore the moderating effect of motivation on the relationship between information technology and budget quality (Celestin, 2025).
Hypothesis
H1: The utilization of information technology plays a significant role in the quality of regional budgeting preparation.
Motivation refers to an individual's intrinsic desires, needs, and goals that drive specific behaviors or actions. A high level of motivation among employees significantly influences their performance, affecting overall organizational effectiveness.
H2: Motivation serves as a moderating variable in the relationship between the utilization of information technology and the quality of regional budgeting preparation.
This study employs a causal research design to examine the correlation between the independent variable—information technology utilization—and the dependent variable—quality of the APBD preparation, with motivation serving as a moderating variable. The central focus is on how motivation influences the relationship between the two variables.
Population
This study employs a population within the Medan City Government, totaling 34 regional apparatus organizations (OPDs). These include the regional house of representatives secretariat (DPRD Secretariat), the regional secretariat with two divisions, 24 departments, eight agencies, one civil service police unit (Satpol PP), one regional inspectorate, and 21 districts. In this study, a total of 76 respondents participated.
Sample
The study employs a saturated sampling technique (census), where the entire population is included as the sample. Questionnaires were distributed to officials directly responsible for budget preparation within the OPD, including financial administration officers (PPK-OPD), technical activity implementation officers (PPTK), expenditure treasurers, and assistant expenditure treasurers.
Data Collection
- 1. This study administered questionnaires as a method to collect data for respondents (Sugiyono, 2014). This method is effective for large, geographically dispersed groups and can be administered by mail or online. A Likert scale was employed to measure attitudes and perceptions, breaking down variables into measurable indicators for developing questionnaire items, which are rated from highly positive to highly negative.
- 2. In this study, direct interviews were conducted with the human resources department (HRD) to gather qualitative data relevant to the research aims, as it is useful for preliminary studies or gaining in-depth insights, especially for smaller groups (Sugiyono, 2014).
- 3. Document analysis was performed to examine organizational documents, including the company's history, structure, and job descriptions, to enhance understanding and validate other data sources, as defined by Srujaweni (2014).
- 4. The literature review explores relevant theories and concepts (Widodo, 2017), consulting various sources related to the physical work environment, organizational culture, discipline, and employee performance to create a robust conceptual foundation.
Data Analysis
This study employs the partial least squares (PLS) approach for data analysis, a variance-based structural equation modeling (SEM) technique that offers flexibility without the strict assumptions required by traditional SEM methods (Ghozali & Latan, 2015). PLS does not assume a specific data distribution, allowing for non-parametric testing of parameter significance (Chin, 1998). The PLS-SEM analysis features two sub-models: the measurement model, which evaluates the relationships between indicators and latent variables, and the structural model, which examines relationships among latent variables
(Ghozali & Latan, 2015). Data analysis was performed using Smart PLS version 3.0 on a computerbased system.
Descriptive Statistical Analysis
The purpose of descriptive statistical analysis is to provide insights into the demographic profile of respondents, used to summarize and present collected data without making generalizable inferences (Sugiyono, 2012). An overview of research variables by examining absolute frequency distribution, which includes key statistical measures such as mean (average), actual range, and standard deviation.
Measurement Model Evaluation (Outer Model)
The outer model, or measurement model, defines the relationship between indicator variables and latent constructs (Ghozali, 2008). Evaluating this model focuses on validity and reliability to confirm measurement accuracy (Ghozali & Latan, 2015).
Validity Assessment:
- Convergent validity examines the correlation between indicators and their respective constructs. Factor loadings above 0.70 indicate strong associations; values over 0.50 are acceptable in exploratory research (Ghozali & Latan, 2015).
- Discriminant validity ensures that each construct is distinct, assessed through cross-loadings and the square root of average variance extracted (AVE), where the AVE value must exceed the correlations between constructs.
Reliability Assessment:
• Construct reliability is evaluated using composite reliability (CR) and Cronbach's alpha, with CR being preferred for its accuracy. If the CR value exceeds 0.70, it indicates reliability (Ghozali & Latan, 2015).
This study employs reflective indicators, evaluated through convergent and discriminant validity tests, along with composite reliability to ensure internal consistency.
Structural Model Evaluation
The inner model illustrates the relationships between latent variables based on substantive theory (Ghozali, 2008). The structural model is evaluated using theR-square (R²) coefficientfor dependent constructs,t-tests, and the significance of path coefficients (Ghozali, 2008).
To assess the model's significance, the bootstrap method, a non-parametric approach, is applied. This is because PLS-SEM does not assume normal data distribution, making traditional parametric significance testing inapplicable (Hair et al., 2014). The key evaluation criteria for the structural model are as follows:
Path Coefficient
The construction of a path diagram within the PLS-SEM framework serves to visually illustrate the conceptual model of the study, facilitating clearer interpretation and analysis. Moreover, the goodnessof-fit test is employed to evaluate the extent to which the proposed model aligns with empirical data (Sinulingga, 2013). The influence of exogenous (independent) variables on endogenous (dependent) variables is assessed through the path coefficient analysis, leading to the following equation:
Quality of the APBD Budgeting Preparation= β X +e
β = path coefficient
X = Information Technology
e = Error
Quality of the APBD Budgeting Preparation = βX + ωXZ + e
β = patch coefficient
X = Information Technology
Z = Motivation
ω = Path coefficient moderating effect
e = Error
Effect Size
Effect size in moderation analysis evaluates the interaction between an independent variable and a moderating variable's influence on a dependent variable. In SmartPLS 3.0 M3, moderation effects can be tested using four approaches: product indicator, two-stage, hybrid, and orthogonalizing (Ghozali & Latan, 2012). The effect size (f²) measures each exogenous latent variable's contribution to the R² value, with thresholds indicating weak (0.02), moderate (0.15), and strong (0.35) effects. The effect size for moderation models can be calculated using a specific formula.
\[f^{2} = \frac{R^{2}_{interaction \, model} - R^{2}_{main \, effects \, model}}{1 - R^{2}_{main \, effects \, model}}\]
Chin et al. (2003) argue that if the calculated effect size is weak, the interaction effect will not significantly influence the model. By determining the effect size of each exogenous variable, researchers can evaluate the relative importance of variables contributing to the formation of the endogenous variable in the study.
Prediction Relevance ()
The Partial Least Squares (PLS) model is also evaluated using the Q² predictive relevance to assess the model's predictive capability. The Q² statistic measures how well the observed values are reconstructed by the model and its parameter estimates. A Q² value greater than 0 indicates that the model has predictive relevance, whereas a Q² value less than 0 suggests that the model lacks predictive power (Chin, 1998, cited in Ghozali, 2012:42). value is calculated using the following equation:
\[Q^2 = 1 - (1 - R^2)\] where R² represents the R-square of the endogenous variable. The Q² value ranges between 0 and 1, with values closer to 1 indicating a stronger predictive capability of the model.
Results and Discussion
This study uses partial least squares (PLS) software, which serves to determine significant influence in measuring latent variables. The evaluation of the measurement model (outer model) involves analyzing the correlation between constructs and their respective indicators to assess validity and reliability through confirmatory factor analysis (CFA).
Model Measurement (Outer Model)
Construct validity examines the extent to which a measurement appropriately represents the theoretical framework underlying a construct. A strong correlation between the construct and its indicators, coupled with a weak link to other variables, is vital for establishing construct validity, which includes convergent and discriminant validity. The reliability of the construct is measured using composite reliability, which offers a more accurate assessment of internal consistency among the indicators than alternative methods. the analysis output, the measurement model (outer model) can be evaluated by conducting convergent validity, discriminant validity, and reliability tests with parameter estimation shown below.
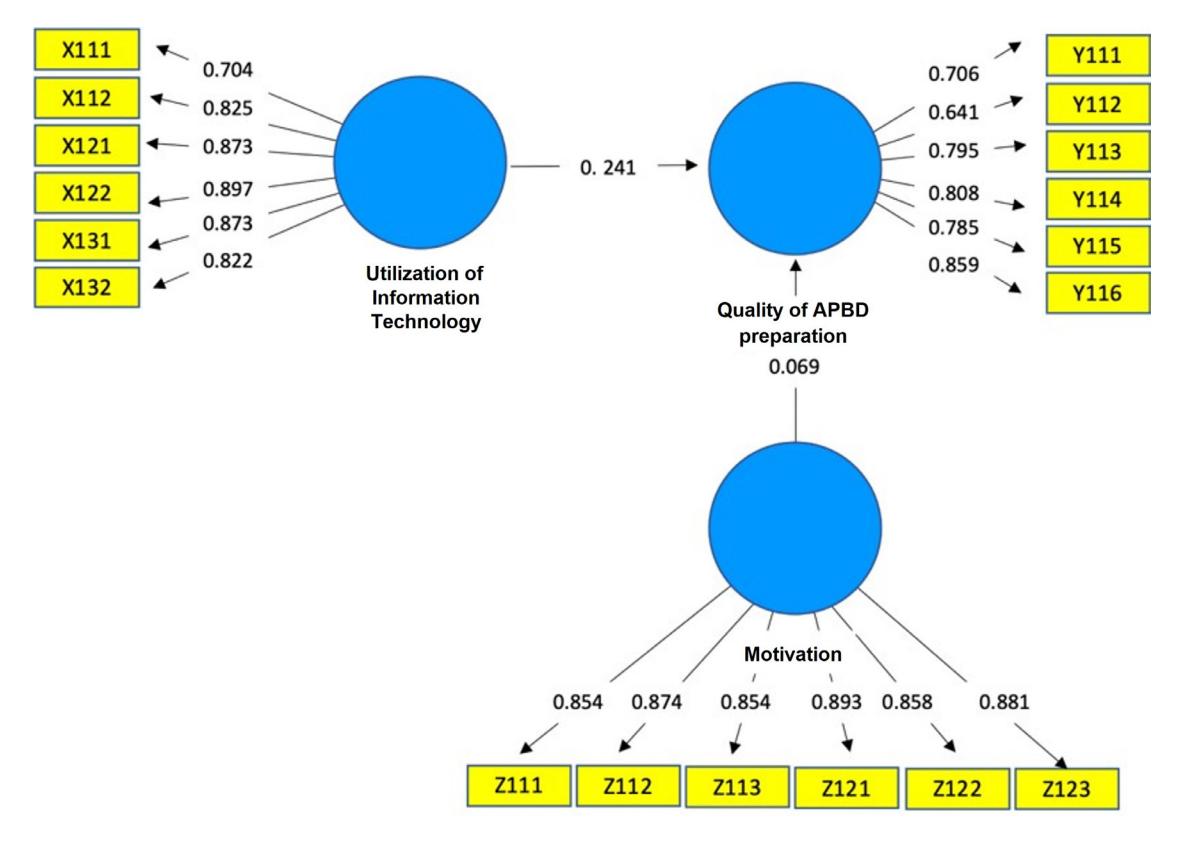
Figure 3 PLS Algorithm output calculation Source: PLS output
Convergent Validity
Convergent validity is assessed by examining the loading factor values for each construct. A loading factor above 0.7 is considered ideal for valid measurement, while values between 0.5 and 0.6 are acceptable, and those below 0.5 should be removed. The PLS algorithm method is used for calculating factors.
Based on Table II, key indicators are as follows:
- 1. For the utilization of information technology (X1) variable, it is X122, with a loading factor of 0.897. Therefore, the statistical recommendation is to prioritize improvements in indicator X122.
- 2. The strongest indicator in shaping the quality of budget preparation (Y) is Y116, with a loading factor of 0.859. Thus, focus on enhancing the indicator to improve the quality.
- 3. For motivation (Z), the dominant indicator is Z121 with a loading factor of 0.893. Prioritizing improving indicator Z121 is recommended for enhancement.
Table II Loading Factor Output Before Reduction
| Variable | Indicator | Loading Factor | Description |
|---|---|---|---|
| Information Technology (X) | X111 | 0,704 0,825 0,873 0,897 0,873 0,822 | Valid |
| X112 | Valid | ||
| X121 | Valid | ||
| X122 | Valid | ||
| X131 | Valid | ||
| X132 | Valid | ||
| Quality of APBD Budget Preparation (Y) | Y111 | 0,706 0,641 0,795 0,808 0,875 0,859 | Valid |
| Y112 | Not Valid | ||
| Y121 | Valid | ||
| Y122 | Valid | ||
| Y131 | Valid | ||
| Y132 | Valid | ||
| Motivation (Z) | X111 | 0,854 0,874 0,854 0,893 0,858 0,881 | Valid |
| X112 | Valid | ||
| X121 | Valid | ||
| X122 | Valid | ||
| X131 | Valid | ||
| X132 | Valid |
Source: PLS output
Based on Table II, indicators that are deemed valid when the loading factor value is below 0.5. This issue stems from biases in the questionnaire items provided to respondents. Given the presence of indicators that are unsuitable for measuring their respective latent variables, a reduction process is necessary. Reducing invalid indicators enhances the average variance extracted (AVE) and composite reliability values, which can be compared in the appendix. Below is shown the reduction of indicators for each variable using the PLS algorithm.
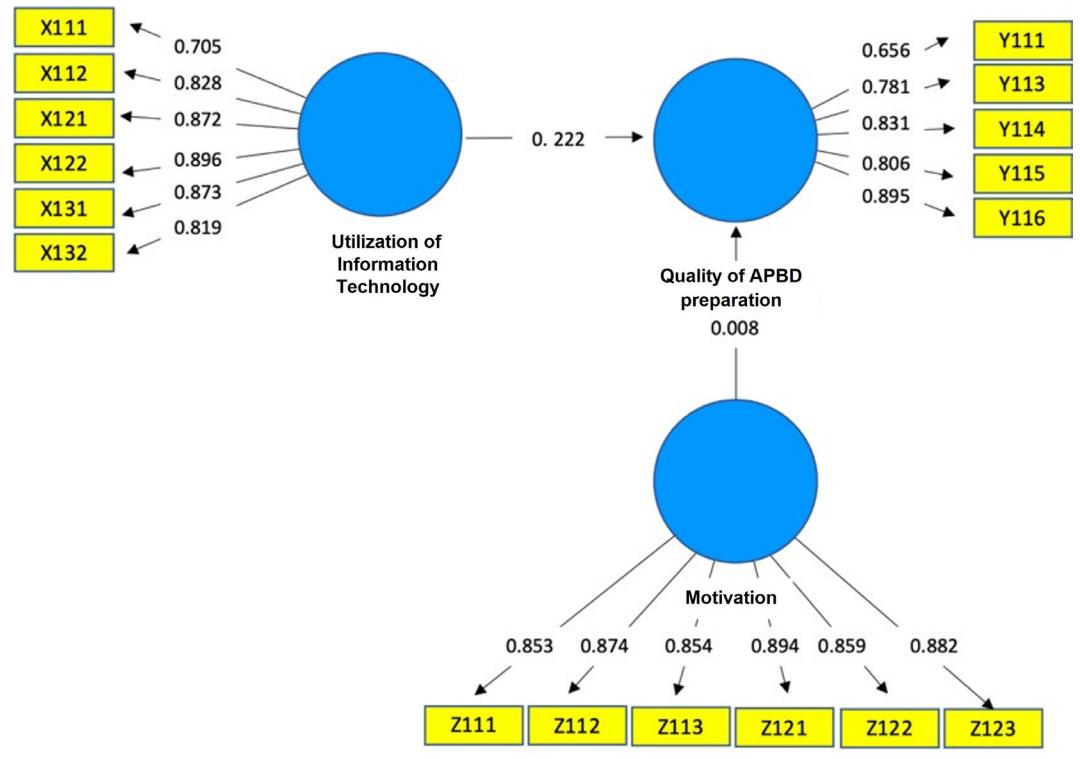
Figure 4 PLS output calculation algorithm after reduction 1 Source: PLS output
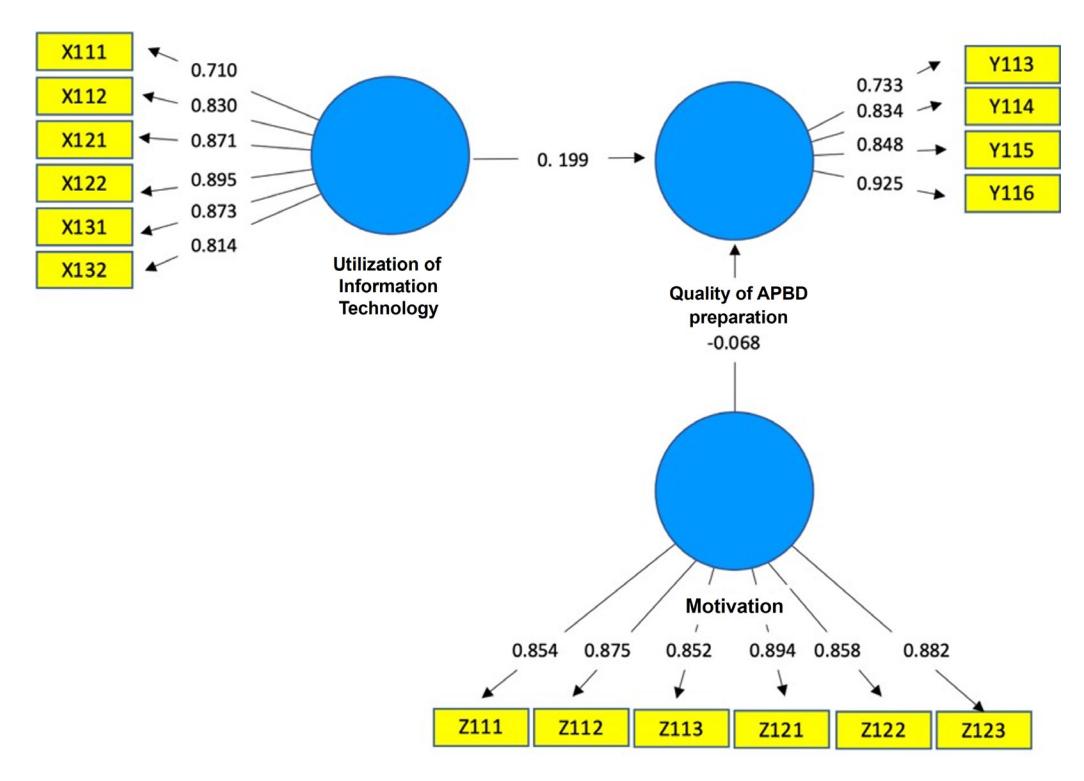
Figure 5 PLS output calculation algorithm after reduction 2 Source: PLS output
The coefficient for information technology utilization is 0.199, indicating that a one-unit increase leads to a 0.199% rise in the quality of regional budget preparation, assuming other variables are constant. This suggests a positive influence of information technology utilization on budget quality. Based on this output, the loading factor values indicators after the reduction process can be observed below and are valid as the value is above 0.5.
Table III Loading Factor Values before Reduction
| Indicator | Loading Factor | Description |
|---|---|---|
| Valid | ||
| Valid | ||
| Valid | ||
| Valid | ||
| Valid | ||
| X132 | Valid | |
| Valid | ||
| Valid | ||
| Valid | ||
| Y132 | Valid | |
| Valid | ||
| Valid | ||
| Valid | ||
| Valid | ||
| Valid | ||
| X132 | Valid | |
| X111 X112 X121 X122 X131 Y121 Y122 Y131 X111 X112 X121 X122 X131 | 0,710 0,830 0,871 0,895 0,873 0,814 0,733 0,843 0,848 0,925 0,854 0,875 0,852 0,894 0,858 0,882 |
Source: PLS output
Discriminant Validity Output
The discriminant validity test assesses whether an indicator has the highest loading factor on its associated construct compared to others. It can be evaluated through cross-loading values from PLS algorithm in SmartPLS software, as shown in Table IV. It indicates that indicators correlate more strongly with their associated construct, with values exceeding 0.7. This confirms the indicators constructs effectiveness validating based on the discriminant validity test.
Table IV Cross Loading Output
| Indicator | Information Technology (X) | Quality of APBD Budget Preparation (Y) | Motivation (Z) |
|---|---|---|---|
| X111 | 0,710 | 0,560 | 0,586 0,636 0,652 0,573 0,558 |
| X112 | 0,830 | 0,599 | |
| X121 | 0,871 | 0,585 | |
| X122 | 0,895 | 0,590 | |
| X132 | 0,873 | 0,598 | |
| Y111 | 0,814 | 0,511 | 0,529 0,630 0,536 0,620 0,623 0,854 |
| Y112 | 0,663 | 0,733 | |
| Y121 | 0,594 | 0,843 | |
| Y122 | 0,509 | 0,848 | |
| Y131 | 0,583 | 0,925 | |
| Y132 | 0,620 | 0,579 | |
| Z112 | 0,618 | 0,640 | 0,875 0,852 0,894 0,858 0,882 |
| Z121 | 0,552 | 0,602 | |
| Z122 | 0,591 | 0,636 | |
| Z131 | 0,662 | 0,607 | |
| Z132 | 0,649 | 0,650 |
Source: Research output, 2021 (Data processed using SmartPLS)
Reliability Output
A reliability test was conducted alongside construct validity testing to evaluate the consistency and accuracy of the measurement instrument. Composite reliability was used to assess the true reliability of each construct, with a value above 0.70 indicating reliability (Hartono & Abdillah, 2015). As shown in Table V, all constructs exceeded this threshold, demonstrating strong reliability and consistency for the indicators used in this study.
Table V Composite Reliability Output
| Variable | Composite Reliability | Description | |
|---|---|---|---|
| Information Technology (X1) | 0,932 | Reliable | |
| Quality of APBD Budget Preparation (Y) | 0,905 | Reliable | |
| Motivation (Z) | 0,949 | Reliable | |
Source: Research output, 2021 (Data processed using SmartPLS)
Average Variance Extracted (AVE)
The assessment of convergent validity requires evaluating the average variance extracted (AVE), with values exceeding 0.50 indicating validity (Ghozali & Hengky, 2015). All constructs in Table VI meet this criterion.
Table VI Average Variance Extracted (AVE) Output
| Variable | AVE Value | Description |
|---|---|---|
| Information Technology (X1) | 0,696 | Valid |
| Quality of the APBD Budget Preparation (Y) | 0,706 | Valid |
| Motivation (Z) | 0,755 | Valid |
Source: PLS output
Based on figure 5, it is determined that the previous R-Square has a moderating effect as below:
Tabel VII R-Square with No Moderating Effect Output
| Variable | R-Square |
|---|---|
| Quality of the APBD Budget Preparation (Y) | 0,835 |
Source: PLS output
Table VII reveals an R-square value of 0.835, meaning information technology utilization explains 83.5% of the variance in the quality of regional budget preparation. This high value suggests strong explanatory power. The remaining 16.5% is influenced by external factors, such as local government policies. The R-square calculation without the moderating effect will be used to determine effect size in the discussion.
Cronbach Alpha Value
It is evident, from Table VIII, that the Cronbach alpha value is above 0.7, which suggests that each variable is reliable to demonstrate consistency.
Table VIII Cronbach Alpha Output
| Variable | Cronbach Alpha | Description |
|---|---|---|
| Information Technology (X1) | 0,911 | Reliable |
| Quality of the APBD Budget Preparation (Y) | 0,859 | Reliable |
| Motivation (Z) | 0,935 | Reliable |
Source: Research output, 2021 (Data processed using SmartPLS)
Inner Model Structural Result
After confirming that the estimated model meets the criteria for convergent validity, discriminant validity, and reliability, the next step is to evaluate the structural model (inner model). This involves analyzing the relationships between latent constructs by examining path coefficients and their significance (Ghozali, 2018). In partial least squares (PLS) analysis, the structural model is assessed using the R-square value for the dependent variable and path coefficients for independent variables. The t-statistic is used to determine significance. The results from the PLS algorithm in SmartPLS, particularly regarding the moderating variable, are illustrated in Figure 6.
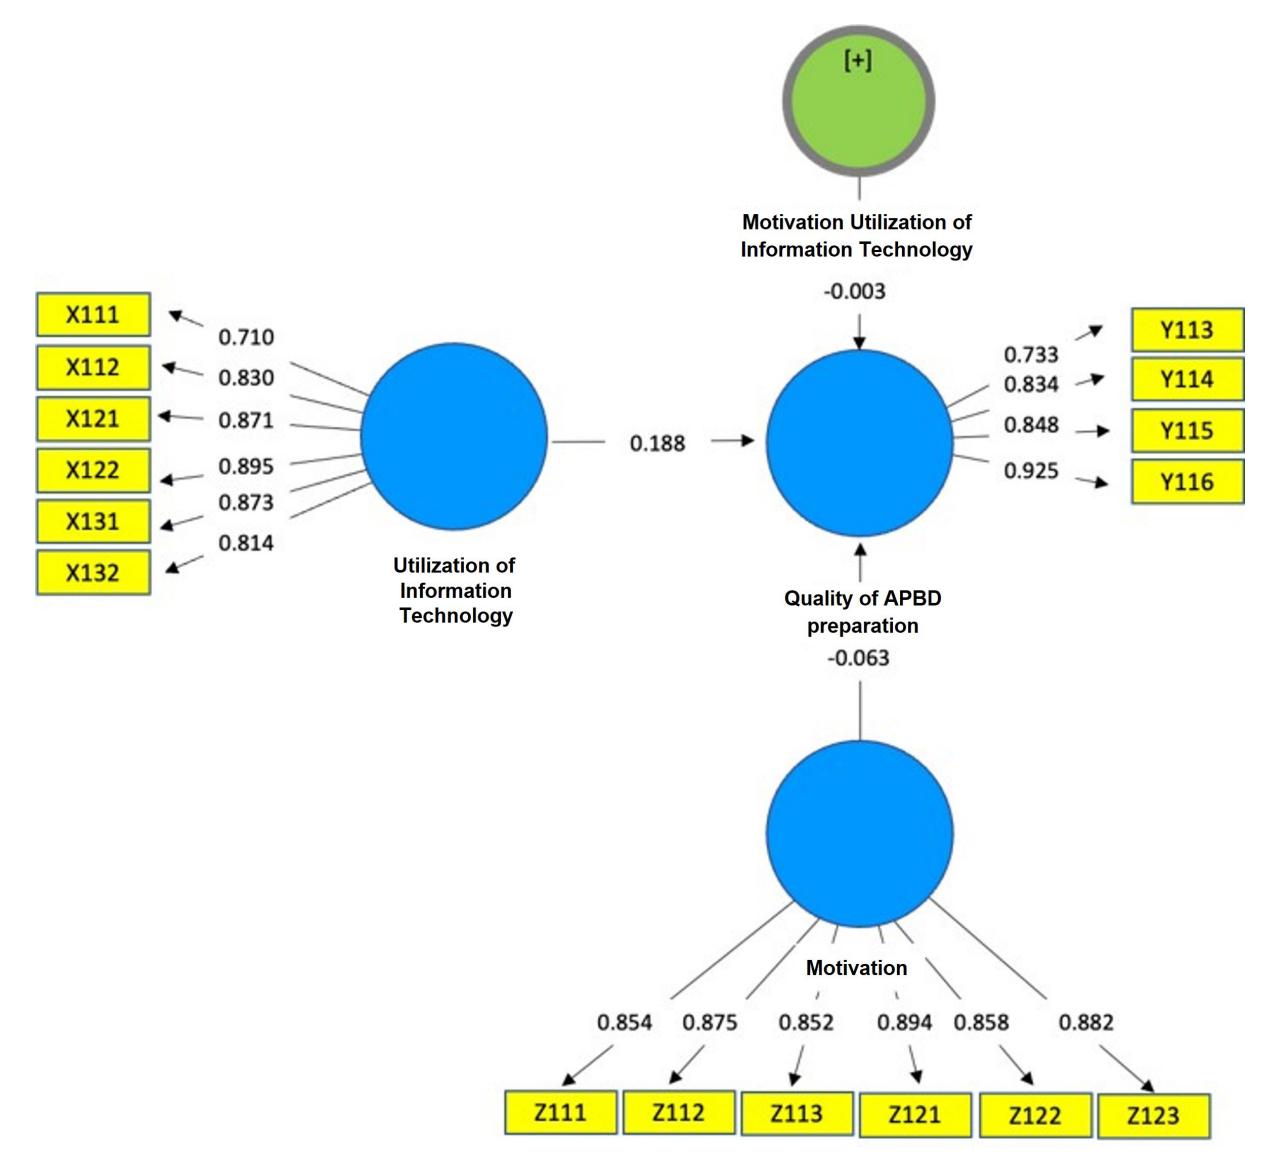
Figure 6 Coefficient path value and R-Square with moderating effect
According to the path diagram in Figure 17, motivation (Z) is the most significant factor affecting the quality of regional budget planning and preparation, with a path coefficient of 6.269. The structural equation can be defined accordingly.
Quality of Regional Budget Planning and Preparation = 0.188×Utilization of Information Technology−0.063×Motivation−0.003×(Motivation×Utilization of Information Technology
The interaction coefficient between motivation and utilization of information technology is -0.003, indicating that a one-unit increase in IT utilization leads to a 0.003% decrease in budget planning quality, assuming other variables remain constant. This suggests that the interaction may influence the overall relationship with budget planning quality.
Adjusted R-Square Coefficient Output
If the R-Square is below 0.5 or 50%, it indicates a poor correlation between two variables. However, the value attained from the R-Square model based on table 9 is 0.838, or 83.3%, which interprets that motivation in utilizing information technology is able to determine the quality of the APBD budget preparation. The remaining 16.2% is attributed to external factors (e. g., government policies, etc.).
Table IX R-Square with Moderating Effect
| Variable | R-Square |
|---|---|
| Quality of the APBD Budget Preparation (Y) | 0,838 |
Source: PLS output
Effect Size Output ()
The effect size () measures the interaction between the independent and moderating variables on the dependent variable. Calculated using values of 0.02, 0.15, and 0.35 for small, moderate, and large effect sizes (Ghozali, 2008), reflects each variable's contribution to R-Square. The R-Square values from tables 7 and 9 are used to calculate this model's effect size.
\[f^{2} = \frac{R^{2}_{interaction \, model} - R^{2}_{main \, effects \, model}}{1 - R^{2}_{main \, effects \, model}}\]
Below shows the result of 0.0185 that the motivation variable has a low contribution to the quality of the APBD budget preparation.
\[f^2 = \frac{0,838 - 0,835}{1 - 0.838} = 0,0185\]
Prediction Relevance Output ()
Prediction relevance (Q²), commonly referred to as Stone-Geisser's test, is used to evaluate the predictive capability of a model through the blindfolding procedure and is specifically applicable to endogenous constructs with reflective indicators. In this context, a Q² value of 0.02 is classified as weak, 0.15 as moderate, and 0.35 as strong (Ghozali, 2008). The Q² value ranges from 0 to 1, with higher values suggesting greater model robustness. The prediction relevance () can be calculated using the following formula:
\[Q^2 = 1 - (1 - R1^2) - (1 - R2^2)\]
R-Square value from table 7 and 9 is attained to calculate:
\[Q^2 = 1 - (1 - 0.838) - (1 - 0.835)\]
= 1 - 0,455
= 0,545
In this study, the calculated Q² value is 0.545, indicating a high level of predictive capability, as it accounts for 54.5% of the variance in the research data. This result suggests that the moderating variable demonstrates strong predictive relevance, surpassing the threshold of 0.35, and further emphasizes the model's improvement in quality as the Q² value approaches 1.
Hypothesis Result
Hypothesis testing was conducted using t-statistics values from bootstrapping. A hypothesis is supported if the t-statistic exceeds 1.96 at a 5% significance level (two-tailed) (Abdillah & Jogiyanto, 2015). The findings are shown on table X:
| Table | X | T-Sta | tistics | Output |
|---|
| Exogen | Endogen | Path Analysis | T Statistics | P Value | Conclusion |
|---|---|---|---|---|---|
| Information Technology (X1) | Quality of APBD Budget Preparation (Y) | 0,188 | 2,258 | 0,024 | \(H_o\): Accepted \(H_a\):Rejected |
| Motivation (Z) | Quality of APBD Budget Preparation (Y) | -0,063 | 0,538 | 0,0560 | \(H_o\): Rejected \(H_a\): Accepted |
| Motivation* Information Technology | Quality of APBD Budget Preparation (Y) | -0,003 | 0,040 | 0,968 | \(H_o\): Accepted \(H_a\):Rejected |
Source: Research output, 2021 (Data processed using SmartPLS)
- 1. Information technology utilization significantly affects the quality of regional budget planning and preparation, with a t-statistic of 2.258 and a p-value of 0.024. Thus, the hypothesis is accepted.
- 2. Motivation does not moderate the relationship between information technology utilization and the quality of the APBD preparation, as indicated by a t-statistic of 0.040 and a p-value of 0.968. Hence, this hypothesis is rejected.
The Influence of Information Technology Utilization on Budgeting Quality
The utilization of information technology for acceleration and development in completing tasks, especially in the process of preparing the regional revenue budget, is especially important. Information technology is used to process, obtain, compile, store, and manipulate data in various ways to produce quality information. The results of this information are relevant, accurate, and timely for personal, business, and government organizations, which are strategic information in determining decision-making. This can be seen from the t-statistic value of 2.258 and a p-value of 0.024. Because the t-statistic value is greater than 1.99 and the p-value is greater than 0.05, the hypothesis is accepted, meaning that the utilization of information technology has a significant effect on the quality of preparing the regional revenue and expenditure budget.
The application of information technology is vital for enhancing the efficiency of budget preparation, particularly regarding regional revenue and expenditure budgets. It facilitates data processing, organization, and analysis, resulting in high-quality, timely information that supports effective decision-making. Statistical analysis shows a t-statistic of 2.258 and a p-value of 0.024, indicating that the use of information technology significantly impacts the quality of budget preparation. These results are in accordance with the findings of Raja (2017), who concluded that the competence of human resources plays a critical role in enhancing the quality of financial reporting. This finding stands in contrast to Riandani (2017), who concluded that information technology utilization did not significantly influence the quality of financial reporting in regional government agencies in Limapuluh Kota Regency.
The Role of Motivation in Moderating the Relationship between Information Technology Utilization and Budgeting Quality
Motivation encompasses an individual's desires, needs, and goals, driving specific behaviors and actions. Higher employee motivation is associated with improved work performance. However, the present study finds that motivation does not moderate the relationship between information technology utilization and budget preparation quality. The analysis shows a t-statistic of 0.040 and a p-value of 0.968. As the t-statistic is below 1.99 and the p-value exceeds 0.05, the hypothesis is rejected, indicating that motivation does not significantly affect the impact of technology on budget quality.
The significant impact of information technology underscores its strategic importance in budget preparation. Technology facilitates timely communication, automated calculations, and error reduction, which are crucial for planning accuracy and compliance. This finding is especially relevant in the context of public sector reform, where transparency and accountability are critical.
On the other hand, the insignificance of motivation suggests that personal drive or intrinsic factors alone may not translate into improved budgeting outcomes without organizational support systems. These findings reinforce the notion that motivation may not always serve as an effective mediating variable between budget participation and managerial performance. This result is consistent with the study conducted by Arifah and Soetanto (2020), which found that motivation does not significantly mediate the relationship between budget participation and managerial performance. This contrasts with studies such as Heidjrachman and Husnan (2012), which posit that motivation strongly influences performance. The discrepancy may be due to bureaucratic constraints or procedural rigidity in the public sector that neutralize individual efforts.
These findings are in line with the problem identification described in the introduction, particularly the recurring issues in Medan's APBD preparation. The persistent gap between planning and implementation, excessive allocation to indirect expenditures, and the city's continued receipt of qualified opinions (WDP) from BPK between 2015 and 2019 all indicate the presence of systemic inefficiencies. The study confirms that while human competence and IT utilization significantly affect budget quality, the lack of motivation and organizational commitment remain critical challenges.
Furthermore, the low absorption rate of budgeted funds—due to unfinished infrastructure projects—can be linked to the insufficient use of digital tools and low accountability mechanisms, as observed in various SKPDs. The findings reinforce the need for not only technological improvements but also institutional reforms. To move beyond the suboptimal budgeting outcomes, local governments must foster a culture of performance, ensure integrated use of financial systems, and improve internal capacities through targeted IT training and management support.
Thus, while the adoption of information technology proves vital for addressing technical limitations, its success depends on a conducive institutional environment that motivates budget planners to apply systems effectively and with accountability. The empirical evidence presented here substantiates the earlier assumption that solving budgeting inefficiencies in Medan requires more than regulatory compliance—it demands systemic transformation at the organizational level.
Conclusion
This study examined the causal relationship between information technology utilization and the quality of budget preparation within the Medan City government, with a particular focus on the moderating role of motivation. The findings confirm that the adoption of information technology significantly enhances the quality of regional budget formulation. IT contributes to greater accuracy, timeliness, and procedural efficiency in budget planning, supporting the government's broader objective of achieving transparent and accountable fiscal governance.
However, the study reveals that motivation does not play a mediating role in the relationship between technology use and budgeting outcomes. This suggests that the presence of IT infrastructure alone is a stronger determinant of budgeting quality than individual-level psychological factors such as motivation—at least within the current institutional framework of local government agencies.
These conclusions reflect the broader issues outlined in the problem identification of this study. The gap between planning and implementation, overreliance on indirect expenditures, and the recurring issuance of qualified opinions (WDP) in Medan's financial reports from 2015 to 2019 demonstrate that technical improvements alone are insufficient. Institutional and organizational factors—particularly human resource capabilities and a lack of systemic motivation—remain barriers to effective budgeting.
Accordingly, future improvements must integrate the enhancement of IT-based systems with structural reforms that ensure human capital is equipped, motivated, and held accountable. Without addressing these foundational issues, the quality of the APBD preparation will remain stagnant, despite ongoing regulatory updates and fiscal decentralization policies.
These findings provide practical implications for policymakers and public administrators. Investments in digital infrastructure and system integration should be prioritized, accompanied by targeted training to improve IT competency among budgeting personnel. Simultaneously, structural reforms are needed to translate motivational factors into actionable performance, such as by aligning performance incentives with budgeting outcomes.
Future research should explore other institutional or contextual variables. Several other studies have proposed that psychological empowerment, organizational commitment, organizational culture, leadership behavior, regulatory compliance, or perceived fairness may function as more robust mediators in this relationship, warranting further empirical investigation. A broader, comparative analysis across different regions could also enrich the understanding of factors driving effective budget preparation under Indonesia's decentralized governance system.