
INFO ARTIKEL
Kata kunci:
kompor induksi, kesiapan teknologi, program konversi, transisi energi
ABSTRAK
Untuk mengurangi ketergantungan terhadap impor LPG, pemerintah Indonesia melalui PT PLN (Persero) melaksanakan proyek konversi kompor gas LPG ke kompor induksi, memanfaatkan surplus listrik nasional, dan menekan beban subsidi energi. Penelitian ini mengukur tingkat kesiapan teknologi pengguna kompor induksi di Surakarta, khususnya Keluarga Penerima Manfaat (KPM), menggunakan technology readiness index (TRI). Hasil penelitian menunjukkan nilai TRI KPM sebesar 3,33, termasuk dalam kategori sedang, mengindikasikan KPM tergolong kelompok pelopor yang siap mengadopsi teknologi ini, meskipun masih ada kekhawatiran terkait performa teknologi yang tidak sesuai harapan. Kontribusi akademik penelitian ini adalah pengembangan pemahaman adopsi teknologi kompor induksi di Indonesia, khususnya kesiapan teknologi di kalangan masyarakat. Implikasi praktis menunjukkan perlunya strategi komunikasi dan pelatihan untuk mengurangi kecemasan pengguna. Berdasarkan perspektif sosial, ekonomi, dan lingkungan, pemangku kepentingan perlu merumuskan kebijakan yang mendukung transisi ini dengan mempertimbangkan keberlanjutan energi, pengurangan ketergantungan bahan bakar fosil, dan peningkatan kesejahteraan masyarakat.
Introduction
Liquefied petroleum gas (LPG) stoves are widely used in Indonesia due to their affordability and accessibility (Azzahra et al., 2020). Since 2008, the Indonesian government has provided subsidies for 3-kilogram LPG cylinders. However, these subsidies are vulnerable to fluctuations in global oil prices. According to the 2019 state revenue and expenditure budget plan (RAPBN), rising crude oil prices have increased the national burden of LPG subsidies. At the same time, the state-owned electricity company, PT PLN (Persero), is adding approximately 35,000 MW of new generation capacity to the national grid, creating an electricity surplus that remains underutilized (Hakam et al., 2020). To balance this surplus while reducing fossil fuel dependency and subsidy costs, the government has initiated an energy substitution strategy, replacing LPG stoves with induction cookers (Fitriana & Sugiyono, 2021). Similar efforts have been implemented in India and Ecuador (Banerjee et al., 2016; Gould et al., 2020). In Indonesia, the LPG-to-induction-stove conversion program is set to be implemented in the Surakarta and Denpasar regions (Damayanti et al., 2024). Induction stoves are believed to help reduce carbon emissions, have higher efficiency than conventional electric stoves, and support the goal of reducing LPG imports in many developing countries (Adams et al., 2023; al Irsyad et al., 2022; Banerjee et al., 2016; Bhatia, 2013; Martínez-Gómez et al., 2016).
Induction stoves are considered more energy efficient, safer, and environmentally friendly than LPG. With cooking efficiency reaching up to 85%, they offer advantages in speed, safety, and cleanliness (Bramasta, 2021). Despite the benefits, adoption remains limited due to challenges such as lack of user familiarity, incompatibility with existing cookware, and psychological resistance toward new technology (Aisyah et al., 2021; Rizky et al., 2023). Therefore, understanding users' readiness to adopt this technology is crucial for designing effective interventions (Tiandho et al., 2021).
This study aims to evaluate the technology readiness of targeted households, specifically program beneficiaries (KPM), in Surakarta, one of the pilot cities for Indonesia's LPG-to-inductionstove conversion program. The assessment uses the technology readiness index (TRI) developed by Parasuraman (2000). This well-established psychometric tool measures individuals' readiness to adopt new technologies across four dimensions: optimism, innovativeness, discomfort, and insecurity. This model has been widely applied to assess technology acceptance in consumer and public policy contexts (Lin et al., 2007; Walczuch et al., 2007).
The rationale for adopting Parasuraman's TRI lies in its ability to quantify subjective perceptions and attitudes, enabling a deeper understanding of users' psychological disposition toward innovation. Unlike other technology acceptance models emphasizing system-level factors (e.g., TAM or UTAUT), TRI captures individual-level readiness, making it especially relevant for studying vulnerable communities such as KPMs who may face cognitive and infrastructural barriers to adoption. Measuring TRI allows stakeholders to identify specific dimensions that hinder or promote adoption, such as anxiety toward technology use or perceived benefits, and policymakers accordingly.
Despite the global push for clean cooking transitions, there is a research gap in applying TRI within the Indonesian context, particularly among low-income households participating in energy transition programs. Most existing studies on technology adoption in Indonesia focus on mobile technology, banking systems, or e-government platforms, while very few explore household energy technologies. By applying TRI to this specific case, this study offers a novel contribution to understanding user readiness in socio-technological energy transitions.
Thus, this research not only supports practical policy formulation for clean cooking but also enriches academic discourse by extending the application of TRI into a new cultural and sectoral community-level adoption of low-carbon cooking technologies in Indonesia.
Method
This study employs a quantitative method with a descriptive approach. The quantitative research method is based on the philosophy of positivism, which is used to examine a population or sample. One of the advantages of quantitative research is that the data obtained can be directly processed since it is already in the form of scales or numbers (Ghanad, 2023). The research flowchart is shown in Figure 1.
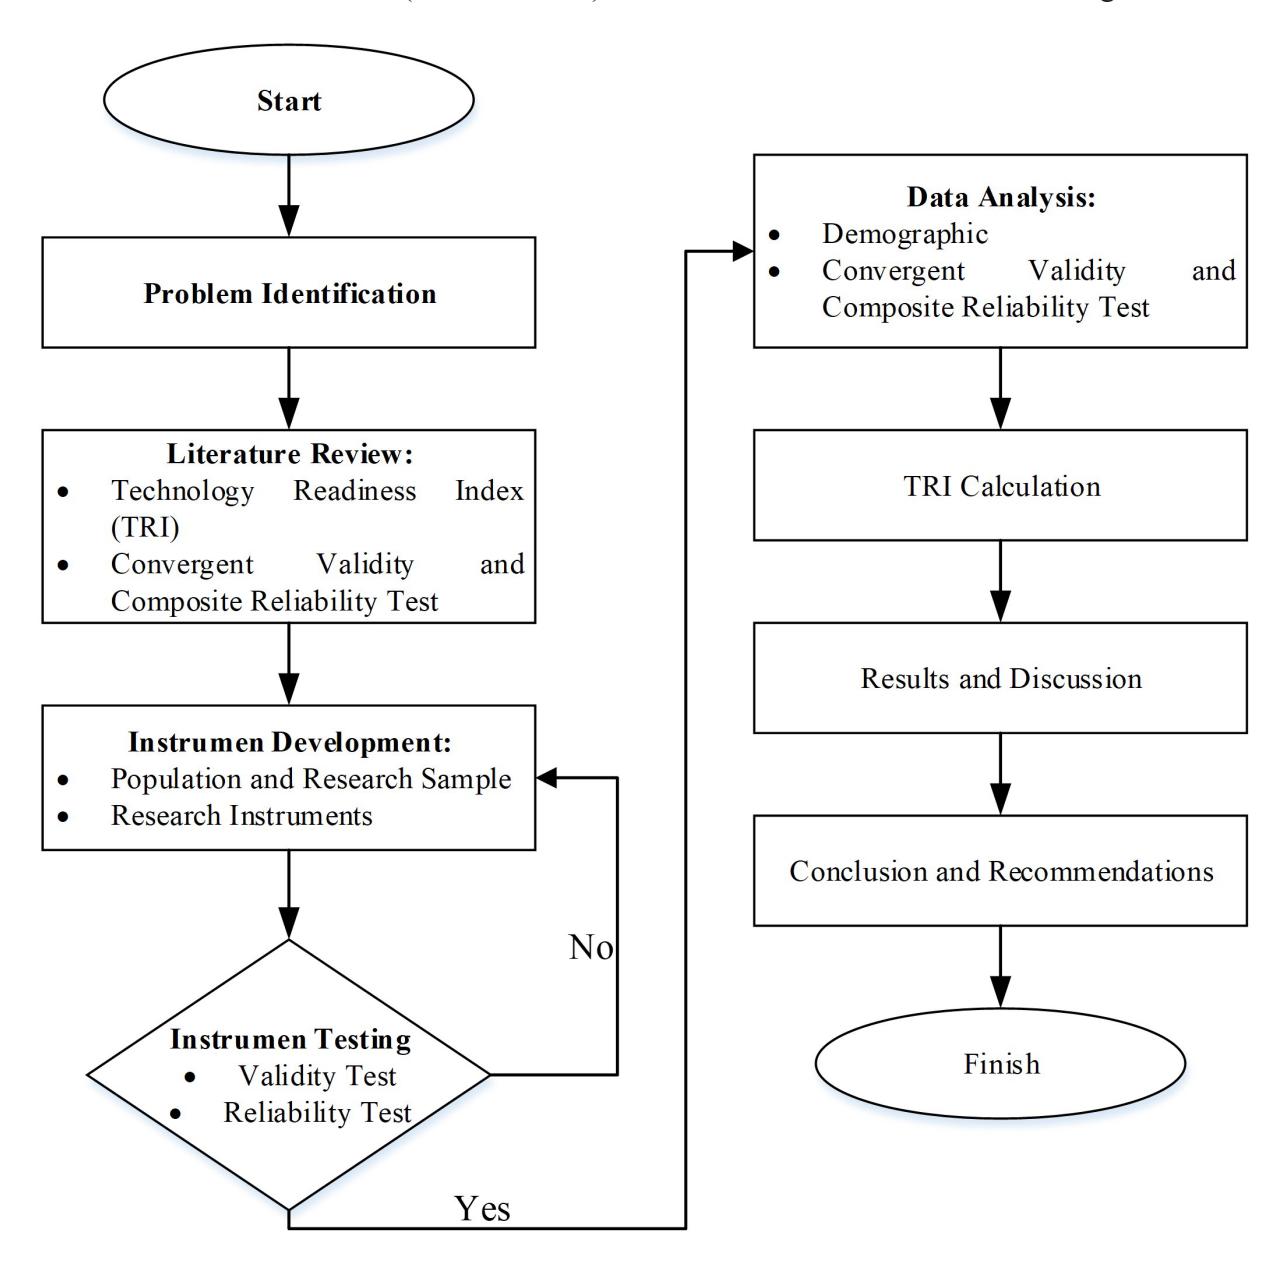
Figure 1 Research flowchart
In addition, the study framework can also be described using the input–process–output (IPO) model to clarify the flow of research implementation. The IPO model provides an overview of the research components from data collection to result generation, as shown in Figure 2.
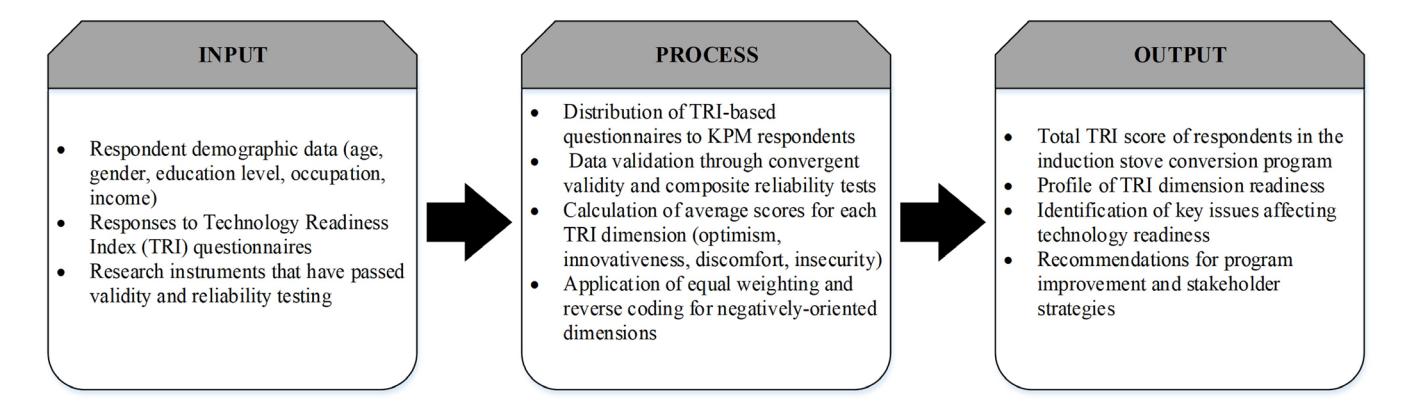
Figure 2 Input–process–output (IPO) model of the study
The input–process–output (IPO) model provides a structured overview of the research implementation. In the input stage, the study gathers respondents' demographic data, including age, gender, education level, occupation, income, and responses to the technology readiness index (TRI) questionnaire. Additionally, the research instruments used have been verified through validity and reliability testing to ensure the quality of the data collected.
During the process stage, the TRI-based questionnaires are distributed to the program beneficiaries (KPM). The responses are then subjected to data validation using convergent validity and composite reliability tests. Following validation, average scores are calculated for each TRI dimension: optimism, innovativeness, discomfort, and insecurity. For dimensions with negative orientations, such as discomfort and insecurity, reverse coding is applied to maintain consistency in score interpretation.
Finally, the output of this research consists of the total TRI score of respondents in the induction stove conversion, a profile of their readiness across TRI dimensions, and the identification of key issues influencing technology readiness. These findings inform recommendations for program improvements and strategic decisions by relevant stakeholders.
Technology Readiness Index (TRI)
The TRI, developed by Parasuraman (2000), is a pioneering psychometric instrument designed to assess an individual's readiness to adopt and engage with new technologies. It encompasses four key dimensions: optimism, innovativeness, discomfort, and insecurity that collectively capture the enablers and inhibitors of technological adoption from a psychological standpoint. Unlike models such as the technology acceptance model (TAM) or the unified theory of acceptance and use of technology (UTAUT), which primarily emphasize system-level perceptions (e.g., perceived usefulness or ease of use), TRI focuses on individual psychological readiness. This focus makes it particularly relevant for examining technology adoption at the grassroots level, especially in community-based or household contexts.
Over the past two decades, TRI has been widely applied across various technological domains, including electronic banking (Pires et al., 2011), healthcare technologies (Elvis & Kim, 2022; Kuo et al., 2013), innovative services (Darmawan et al., 2022; Mohd Isa et al., 2016), and e-government platforms (Man & Manaf, 2023). However, its application within household energy transitions remains limited, especially in developing countries. Existing studies on clean cooking transitions tend to focus on infrastructure or policy dimensions, while the psychological readiness of individuals, particularly among socioeconomically disadvantaged groups, has received comparatively little attention.
In the Indonesian context, there is a notable gap in the literature regarding the application of TRI to assess public readiness toward household energy technologies, particularly among low-income households that are often the target of government intervention programs. By applying TRI to the LPG-to-induction stove conversion initiative in Surakarta, this study advances the state of the art by demonstrating how this tool can be adapted to measure user readiness in the clean cooking sector.
Furthermore, this research makes a valuable academic contribution by extending the application of TRI to a new sector (household energy) and cultural context (urban low-income communities in Indonesia). It highlights the explanatory power of TRI in identifying psychological barriers and drivers among vulnerable groups, offering a user-centric analytical perspective that complements the predominantly system-focused evaluations of energy transition programs. Through this approach, the study offers methodological innovation and empirical insights relevant to scholars and policymakers seeking to improve the design and implementation of sustainable energy adoption strategies.
In 2000, Parasuraman developed the technology readiness index (TRI) through his research. The TRI assesses the readiness of new technology users to integrate technology into their daily lives. It is divided into positive technology readiness (PTR) and negative technology readiness (NTR). PTR includes factors that promote the acceptance of new technology, while NTR comprises factors that hinder it. The four variables used to measure technology readiness, as outlined by Parasuraman and Colby (2015), are as follows: (a) Optimism, a crucial factor in technology adoption, represents a positive view of technology, with the belief that technology enhances control, flexibility, and efficiency in people's lives; (b) Innovativeness, the tendency to be a pioneer and thought leader in adopting new technologies; (c) Discomfort, the perception of a lack of control over technology, accompanied by feelings of being overwhelmed by it; (d) Insecurity, distrust of technology, from skepticism about its proper functioning and concerns about its potential negative consequences. As negative constructs, discomfort and insecurity are reverse coded before calculation to ensure that higher TRI scores consistently reflect greater readiness to adopt technology. This process ensures a balanced and accurate measurement of users' technological readiness.
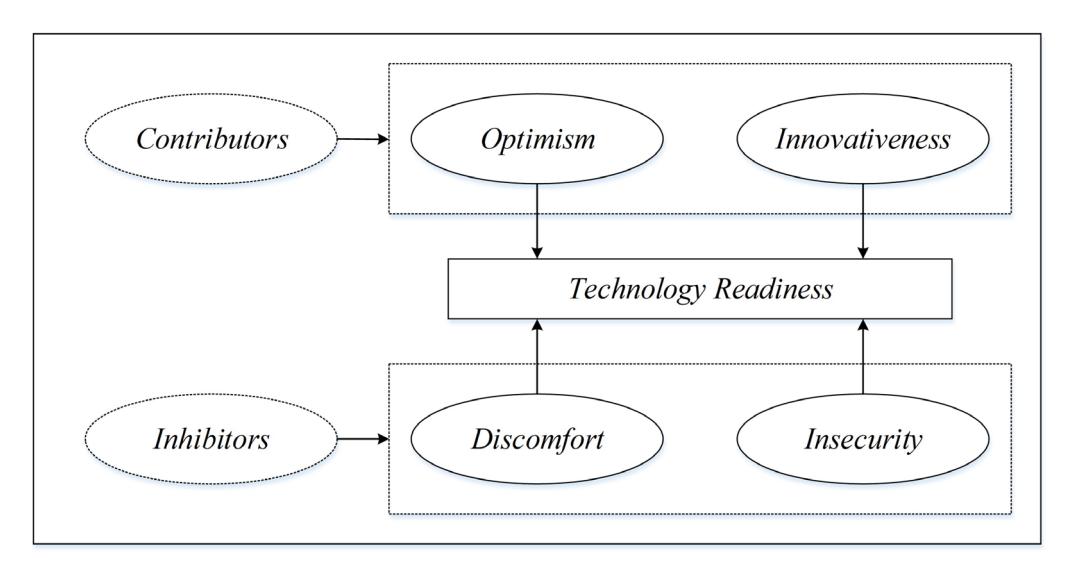
Figure 3 Technology readiness index model Source: Parasuraman, 2020
The TRI score is calculated by averaging the responses for each statement. This average is obtained by summing the product of the weight assigned to each statement and the corresponding Likert scale value, then dividing it by the total number of respondents. Each variable weighs 25%, then is divided by the number of statements within that variable. The TRI score for each variable is obtained by multiplying the average score of each statement by the calculated total weight. The overall TRI score is the sum of the scores from all variables. The steps for calculating the TRI for each variable are shown in the equation below:
1. Determine Statement Weight
\[Statement\ Weight = \frac{25\%}{\sum \quad number\ of\ statement\ in\ the\ variable}\]
2. Calculate the Value of Each Statement
\[Statement\ Value = \frac{\sum \quad (frequency\ of\ each\ answer\ option\ x\ Likert\ Scale)\ x\ statement\ weight}{total\ numbers\ of\ respondents}\]
3. Calculate Variable Score
Statement Weight = \[\frac{25\%}{\sum number\ of\ statement\ in\ the\ variable}\]
4. Calculate Overall TRI Score
\[Statement\ Weight = \frac{25\%}{\sum \quad number\ of\ statement\ in\ the\ variable}\]
The technology readiness index (TRI) (Sugiyono, 2012) is a significant tool that classifies user readiness into three categories: (a) A low technology readiness index is indicated by a TRI value of 2.89 or less (TRI ≤ 2.89), signifying low user readiness; (b) a medium technology readiness index, TRI values between 2.90 and 3.51 (2.90 < TRI < 3.51) indicate moderate user readiness; and (c) a high technology readiness index TRI value greater than 3.51 (TRI ≥ 3.51) is considered high user readiness.
The TRI plays a crucial role in classifying respondents into five distinct groups (Parasuraman & Colby, 2015): (a) Explorers: these respondents exhibit high optimism and innovativeness, with low discomfort and insecurity, and are typically the first to adopt new technology; (b) Pioneers: their optimism and innovativeness are similar to Explorers, but they experience higher discomfort and insecurity. They tend to be cautious when adopting new technology because it may not meet their expectations; (c) Sceptics: these respondents show moderate optimism, innovativeness, discomfort, and low insecurity, making them doubtful about new technologies; (d) Paranoids: respondents in this group have higher levels of discomfort and insecurity, making them fearful of using new technology; and (e) Laggards: these respondents are highly traditional and are typically the last to adopt or may never adopt new technology.
Convergent Validity Test and Composite Reliability Test
This study employs the partial least square structural equation modeling (PLS-SEM) approach to assess the measurement model, particularly for testing convergent validity and composite reliability. PLS-SEM is suitable for studies involving latent constructs and relatively small to moderate sample sizes, making it appropriate for this research context.
Convergent validity evaluates the degree to which indicators of a latent construct correlate positively with one another, confirming that they measure the same theoretical concept. The PLS-SEM framework typically assesses this through factor loadings and Average Variance Extracted (AVE). According to Hair et al. (2017), acceptable convergent validity is indicated by factor loadings greater than 0.7 and an AVE value exceeding 0.5.
Composite reliability is used to evaluate the internal consistency of the indicators measuring the same construct, ensuring that the measurement is stable and consistent. In the PLS-SEM context, a composite reliability score above 0.7 is considered acceptable (Hair et al., 2019). This step is critical before proceeding to assess structural relationships within the model.
Population and Research Sample
The population in this study consisted of the entire group of beneficiaries (KPM) involved in the program for converting to induction cookers offered by PT PLN (Persero), totalling 1,000 households. The selection was based on the following criteria: PLN 450 VA non-social welfare integrated register (DTKS) customers, non-DTPS PLN 900 VA customers, and micro, small, and medium enterprises (MSMEs) that are PLN non-DTKS customers. The sample for this study was determined using a purposive sampling technique, where subjects are selected based on specific criteria rather than strata, randomization, or region (Chen et al., 2013). The sample size was calculated using the "ten times rule," which recommends a sample size of at least ten times the number of formative indicators or structural paths with the most latent construct measurements (Hair et al., 2014). Based on these research limitations and the aforementioned rule of thumb, this study's sampling target was 389 respondents.
Research Instruments
The research instrument used in this study was a questionnaire chosen for its ability to efficiently gather a large amount of data from a diverse group of respondents. The questionnaire was designed to measure specific aspects relevant to the research objectives and was completed by the respondents. The data collection technique involved distributing questionnaires both in person and online via Google Forms, allowing for a wider reach and increased response rate. This approach was chosen to ensure that the data collected was comprehensive and relevant to the research objectives (Jin, 2020).
The first section of the questionnaire gathered comprehensive demographic information from the respondents, including their names, gender, age, and address. The second section measured four exogenous latent variables (X) from the technology readiness index (TRI). This thorough approach ensures that the research is well-structured and comprehensive. The TRI variables were further divided into two categories: positive TRI, consisting of optimism (X1) and innovativeness (X2), and negative TRI, consisting of discomfort (X3) and insecurity (X4). The operational definitions of each variable indicator used in the questionnaire are outlined in Table I.
Tabel I Operational Definition
| Construct | Definition | Reference | Indicator | Reference |
|---|---|---|---|---|
| Optimism | The tendency to believe that the technology offered supports modernization, tool control, and flexibility in everyday life. | (Jin, 2020) | In my opinion, induction cooktops contribute to a better quality of life. I am of the opinion that induction cookers use the latest technology, which is much safer. In my opinion, induction cookers are more flexible for everyday use. Induction cookers use modern technology so that they are easier to control and operate as needed. | (Jin, 2020) (Kim & Chiu, 2019) (Chen et al., 2013) (Shin, 2009) |
| Innovativeness | Tendency to be a technology pioneer and inspiration for new emerging technologies. | (Jin, 2020) | I can turn to people around me for advice on induction hobs. In general, I was one of the first in my circle of friends to acquire an induction cooker. I am enthusiastic about the new technology of induction cookers. I am interested in the challenge of using the new technology of induction cookers. | (Jin, 2020) (Kim & Chiu, 2019) (Chen et al., 2013) (Shin, 2009) |
| Construct | Definition | Reference | Indicator | Reference |
|---|---|---|---|---|
| Discomfort | Perceived level of lack of control over technology and feelings of burden. | (Jin, 2020) | I am not familiar with induction cooker technology, because the technical instructions do not support explanations of its use and operation. Induction cookers are not designed for use by ordinary people. I am not comfortable using induction hobs, because the technology has potential health or safety risks that are not yet known. I think that using an induction hob must be careful because it is easily damaged. I am not comfortable using an induction cooker because I can't fix it if there are problems/damage I am not comfortable using an induction cooker because if there is a problem/ damage to the stove, I don't know the workshop/repair center( service center ). | (Jin, 2020) (Kim & Chiu, 2019) (Chen et al., 2013) (Shin, 2009) |
| Insecurity | Degree of distrust of the technology and concern about the dangers of use. | (Jin, 2020) | I feel worried when I use an induction hob. Every time I use an induction hob, I need to check the hob carefully so I don't make a mistake. If there are problems with the induction cooker, I prefer to complain by talking to personnel (a customer service representative) rather than with the machine. | (Jin, 2020) (Kim & Chiu, 2019) (Chen et al., 2013) (Shin, 2009) |
Results and Discussion
The analysis of our structural equation model revealed several significant pathways that support the theoretical framework underlying this study. Path coefficient analysis demonstrated that the majority of hypothesized relationships achieved statistical significance at the p < 0.05 level, with T-values exceeding the critical threshold of 1.96. These findings provide empirical validation for the proposed model structure and suggest robust relationships between the key constructs under investigation. The model's stability and explanatory power were further confirmed through examination of the original sample values, which consistently aligned with theoretical expectations. Before delving into the specific pathway relationships and their implications, it is essential to first examine the characteristics of our study sample to provide context for interpreting these results.
Demographic Characteristic
The Jebres Sub-District was identified as the most prominent area in the study, with 169 respondents (43.3%) from this region. It was followed by the Banjarsari District, 107 respondents (27.5%), and the Pasar Kliwon District, 81 respondents (20.8%). 25 respondents (6.4%) represented the Laweyan District, while the Serengan District had the fewest, with seven respondents (1.7%).
A slight majority of female respondents was recorded, representing 62%, or 241 individuals, while male respondents comprised 38%, or 148. The largest age group among the respondents was 46-50 years old, with 99 people (25.4%), and the smallest age group was 71-77 years old, with seven people (1.8%).
A wide range of educational backgrounds was captured among the respondents. The majority had a high school education, with 146 individuals (37.5%), followed by 110 respondents (28.3%) with a junior high school education. Elementary school graduates numbered 93 respondents (23.9%), while 17 respondents (4.4%) held undergraduate or postgraduate degrees (S1/S2/S3). A small portion, 13 respondents (3.3%), did not attend school, and ten respondents (2.6%) held a diploma.
Self-employed respondents comprised 28.5%, or 111 individuals, while labor jobs accounted for 23.7%, or 92 respondents. Retired individuals constituted 2.8%, or 11 respondents, and civil servants (PNS) comprised 1%, or four respondents. Students and pupils represented the smallest group, comprising 0.6%, or two individuals.
In terms of income, respondents represented a broad spectrum of economic backgrounds. The majority earned between IDR 1,000,000 and IDR 2,000,000, with 204 respondents (52.4%) falling into this range. The smallest income group earned more than IDR 4,000,000, with only two respondents (0.5%). Subsidized 3 kg gas cylinders were consumed at varying rates by respondents, depending on their household electricity consumption, which ranged from 900 VA to over 2200 VA. Most respondents (28.4%) used two subsidized 3 kg gas cylinders per month. Here is the visualization of the respondents' demographic data in the form of a bar chart, as shown in Figure 4.
Figure 4 Research respondents' demographic profile
Convergent Validity Test and Composite Reliability Test
The convergent validity test ensures that the indicators accurately measure the same construct. Equally important, the reliability test evaluates the internal consistency of the indicators. Both tests play a significant role in supporting the validity and reliability of the research results.
| Variable | Indicator | Outer Loading | AVE | Information |
|---|---|---|---|---|
| OP1 | 0.811 | |||
| Optimism (X1) | OP2 | 0.816 | 0.663 | Valid |
| OP3 | 0.816 |
Table II Validity Test Results
| Variable | Indicator | Outer Loading | AVE | Information |
|---|---|---|---|---|
| INN1 | 0.772 | |||
| Innovativeness | INN2 | 0.748 | ||
| (X2) | INN3 | 0.780 | 0.599 Valid | |
| INN4 | 0.795 | |||
| DIS1 | 0.858 | |||
| DIS2 | 0.881 | |||
| Discomfort (X3) | DIS3 | 0.868 | 0.731 | Valid |
| DIS4 | 0.823 | |||
| DIS5 | 0.845 | |||
| INS1 0.900 | ||||
| Insecurity (X4) | INS2 | 0.928 | 0.836 | Valid |
The convergent validity test follows these guidelines: outer loading > 0.7, communality > 0.5, and AVE > 0.5. If the outer loading value falls between 0.5 and 0.7, and both the commonality and AVE values are more significant than 0.5, there is no need to remove the indicator. As shown in Table II, some indicators have an outer loading value of less than 0.5, leading to the omission of INS3. Table 3 presents the composite reliability test results, demonstrating that all constructs are reliable, with composite reliability values above the recommended threshold of 0.7.
Table III Composite Reliability Test Results
| Variable | Composite Reliability | Information |
|---|---|---|
| Optimism (X1) | 0.855 | Reliable |
| Innovativeness (X2) | 0.857 | Reliable |
| Discomfort (X3) | 0.932 | Reliable |
| Insecurity (X4) | 0.910 | Reliable |
Technology Readiness Index (TRI)
In this study, the measurement of technology readiness among beneficiary households (KPM) regarding the conversion of induction cookers uses the technology readiness index (TRI) concept developed by Parasuraman & Colby (2015). TRI consists of four main dimensions: optimism, innovativeness, discomfort, and insecurity, collectively describing an individual's or group's readiness to adopt and use new technology. Each TRI dimension was operationalized into several statements or indicators designed to fit the context of using induction cookers in households. These indicators were included in a questionnaire distributed to KPM respondents in Surakarta. Respondents answered using a 5-point Likert scale, indicating their level of agreement with each statement.
After data collection, the analysis began with instrument validation and reliability tests to ensure data quality, using convergent validity and composite reliability tests. Then, the average score for each TRI variable was calculated based on respondents' answers to each statement. Each dimension was equally weighted at 25% (0.25) when calculating the total TRI score. The average score of each dimension was divided by the number of statements within that dimension, then multiplied by the weight to produce the contribution of each variable to the overall TRI score. It is important to note that the discomfort and insecurity dimensions are negatively oriented variables, so their scores were reverse coded to prevent distortion of the overall TRI score. Reverse coding involved transforming low scores into high scores and vice versa to reflect technology readiness accurately. The results of the TRI for the induction cooker program in Surakarta are presented in Table IV.
Table IV Total Value of Technology Readiness Index (TRI)
| Variable | TRI Value of Each Variable | Total |
|---|---|---|
| Optimism | 1.07 | |
| Innovativeness | 1.01 | |
| Discomfort | 0.54 | 3,33 |
| Insecurity | 0.71 |
Table IV presents the TRI analysis results for KPM in the Surakarta program for converting to induction cookers. The total TRI score obtained was 3.33, which falls into the medium category based on the classification standard by Indrianto & Supomo (2002), where the score range is 2.90 to 3.51 (2.90 ≤ TRI ≤ 3.51).
The optimism dimension had the highest contribution, scoring 1.07, which indicates that KPM has a positive perception of using induction cookers. Respondents believe induction cookers are safer and more flexible than gas stoves and easy to operate. Following that, the innovativeness dimension contributed to the second-highest score of 1.01, suggesting that KPM is innovative and open to adopting this new technology daily. However, the scores for discomfort and insecurity, 0.54 and 0.71, respectively, show that some KPM still experience concerns and discomfort related to using induction cookers. The result indicates uncertainty and hesitation that must be addressed to improve sustained technology acceptance.
Although the overall TRI score indicates a medium level of readiness, the relatively higher discomfort and insecurity scores suggest lingering concerns among some respondents regarding the safety and usability of induction cookers. These concerns could stem from limited prior experience with the technology, inadequate technical support, or fear of potential hazards. Addressing these psychological and practical barriers is crucial for increasing sustained adoption. The findings classify the KPM group in Surakarta as pioneers, showing high optimism and innovativeness (Parasuraman & Colby, 2015). However, program implementers should not overlook the significant discomfort and insecurity, which may inhibit full acceptance and use.
This study has several limitations. First, the sample was limited to KPM households in Surakarta, which may restrict the generalizability of findings to other regions with different social or economic characteristics. Second, self-reported data could introduce bias due to respondents' subjective perceptions or social desirability. Third, the cross-sectional design captures readiness at a single point, which may not reflect changes in attitudes as experience with induction cookers grows.
The results highlight the importance of continuing educational and communication strategies that address user concerns about discomfort and insecurity. Providing firsthand training, technical support, and safety information can enhance user confidence. Policymakers and program managers should also develop feedback channels to understand ongoing challenges faced by users and improve program responsiveness.
Conclusion
This study reveals that the TRI score for KPM respondents in Surakarta stands at 3.33, categorizing their readiness as moderate. The respondents predominantly belong to the pioneer adopter category, exhibiting strong optimism and innovativeness toward adopting induction cookers. Despite this positive attitude, concerns regarding the technology's ability to fully meet user expectations result in a cautious approach.
To ensure the effective implementation and sustainability of the induction stove program, it is imperative to undertake meticulous planning that holistically addresses both economic and infrastructural aspects. Specifically, assessing the program's impact on household expenditures and evaluating the capacity and reliability of the electrical grid are essential steps to build stakeholder confidence and guarantee the program's long-term viability.
For future research, it is recommended to conduct longitudinal studies to monitor shifts in technology readiness over time and comparative analyses across various regions to understand contextual differences. Identifying the underlying factors influencing user acceptance and apprehension will deepen insights into behavioral drivers. Furthermore, evaluating the program's socio-economic outcomes and environmental sustainability will provide comprehensive evidence to inform policy and practice. Lastly, developing and testing strategic interventions to optimize program delivery, alongside studying successful cases, can offer practical guidance for scaling up the initiative.
By integrating these considerations, the induction cooker conversion program is poised to better align with community needs and contribute meaningfully to Indonesia's national energy transition objectives. This transition promises reduced energy consumption and promotes environmental sustainability, fostering optimism among all stakeholders involved.
Acknowledgement
The authors would like to express their gratitude to the anonymous reviewers for their valuable comments, which have significantly improved the quality of the paper. This research was funded by Universitas Sebelas Maret through the Fundamental Research Scheme (PF-UNS), under Research Assignment Agreement Number: 369/UN27.22/PT.01.03/2025.