
INFO ARTIKEL
Kata kunci:
sosioteknologi, sentimen analisis, destinasi pariwisata super prioritas, evaluasi wisata, big data
ABSTRAK
Penelitian ini bertujuan untuk mengembangkan platform evaluasi berbasis teknologi digital untuk mendukung program Destinasi Pariwisata Super Prioritas (DPSP) di Indonesia. Platform ini memanfaatkan data ulasan wisatawan yang diperoleh dari Google Maps melalui teknik scraping dan diolah menggunakan analisis sentiment berbasis algoritma Naïve Bayes. Dengan mengumpulkan dan menganalisis data secara real-time, penelitian ini mampu memberikan informasi yang akurat dan relevan terkait opini wisatawan mengenai destinasi wisata. Implementasi sistem ini diharapkan dapat meningkatkan efektivitas evaluasi destinasi pariwisata serta mendukung pengambilan keputusan berbasis data. Hasil pengujian menunjukkan akurasi model sebesar 75% dengan ulasan wisatawan yang diklasifikasikan menjadi kelas positif, negatif, dan netral. Pengembangan lebih lanjut direkomendasikan untuk menambahkan sumber data dan meningkatkan akurasi model.
Introduction
The tourism industry is one of the fastest-growing sectors in Indonesia. This industry is one of the largest contributors to foreign exchange in the country (Walakula, 2020). Tourism in Indonesia is characterized by several advantages, including diverse destinations, customs, cultures, and traditions that attract visitors. In addition, Indonesia's natural diversity also strengthens the appeal of the tourism sector and is key to the success of this industry.
Based on the travel & tourism development index launched by the World Economic Forum (WEF) in 2024, Indonesia's tourism ranks 22nd out of 119 countries in the world and 6th out of 19 countries in Asia Pacific (Travel & Tourism Development Index 2024 May 2024, 2024). This ranking shows outstanding potential for increasing the number of tourist visits. One of the steps taken by the government to support this potential is the super priority tourism destinations program.
The super priority tourism destinations (DPSP) program is an initiative of the Indonesian government to develop five key destinations, namely Lake Toba, Borobudur, Mandalika, Labuan Bajo, and Likupang. The program aims to enhance existing tourism, attract international and domestic tourists, and boost local economic growth. However, these development efforts face challenges in terms of evaluation, since they still use traditional approaches and are less responsive to real-time changes in tourist preferences.
Currently, conventional methods, such as satisfaction surveys and visitation statistics have limitations in terms of data speed and coverage. In today's digital era, tourist opinions can be accessed through usergenerated content on social media and travel review sites. If that can be optimally utilized, this data can provide additional insights that are more relevant and dynamic in the evaluation and development of tourist destinations so that DPSP programs can be more effective in attracting tourists.
To overcome the limitations of these conventional methods, there is a need for an evaluation platform that utilizes digital technology, which can collect and analyze data from various sources more efficiently. Thus, destination evaluation can be more dynamic and in accordance with the evolving conditions and preferences of tourists. This platform is expected to provide relevant information to stakeholders so as to improve the quality of services and attractiveness of tourist destinations.
Big Data Analysis can be the main foundation in overcoming these limitations. By using data from tourist reviews of super priority tourism destinations (DPSP) collected through various platforms, one of which is Google Maps, we can utilize it to provide a more in-depth picture. According to the Local Consumer Review Survey 2024, 78% of visitors trust online reviews more than recommendations from a person. By collecting this data, sentiment analysis can be conducted to gain more accurate insights and support evaluation based on current traveler preferences.
Sentiment analysis is a field of study that analyzes a person's opinion, sentiment of praise, and emotions towards entities such as products, services, organizations, events, problems, and attributes of entities (Wankhade et al., 2022). In this research, sentiment analysis will be used as a tool to determine whether the types of reviews from visitors are positive, negative, or neutral and identify the aspects discussed, including attractiveness, facilities, services, and cleanliness in tourist destinations. The results of this analysis will help increase or improve existing potential based on reviews from tourists. Using sentiment analysis based on machine learning is one of the right analysis techniques to support research.
Machine learning (ML) is the scientific study of algorithms and statistical models that computer systems use to perform specific tasks without being explicitly programmed (Mahesh, 2020). In this study, the Naïve Bayes Classifier algorithm was chosen as the appropriate method for sentiment analysis. The Naïve Bayes method is a method that can be trained or used on small-scale datasets and can provide realtime prediction results. In addition, this method can also help in classifying a class whose results can be used in parallel in increasing the scale of the dataset, especially in large-scale data case studies (Wongkar & Angdresey, 2019).
Based on the explanation above, related to tourist reviews from Google Reviews for super priority tourism destinations (DPSP), a machine learning-based sentiment analysis system is needed that can
classify tourist reviews automatically. This research will apply the Naive Bayes method as a classification tool for reviews, utilizing a dataset containing 6720 data points. The classification results will offer a deeper understanding of tourist sentiment, thereby enhancing the quality and appeal of DPSP.
Sentiment analysis plays a big role in this field. Research conducted by many people shows that there are many methods of sentiment analysis. Despite this, numerous researchers are still searching for more effective alternatives (Facta, 2017). Sentiment analysis is the process of analyzing text to determine the sentiment expressed, such as positive, negative, or neutral. Sentiment analysis can be used for various purposes, such as understanding public opinion, measuring customer satisfaction, and detecting fraud (Maulana et al., 2024).
Thomas Bayes discovered the Bayes' theorem in the 18th century, from which he derived Naive Bayes. Used to predict the likelihood of class membership, Naive Bayes classification is a statistical technique. It uses probability theory, a branch of mathematics, to find the highest likelihood for a classification by looking at the frequency of each classification in the training data. The Naive Bayes algorithm has an advantage, which is efficiency, because it can shorten the sentiment analysis time (Maulana et al., 2024).
Al-Bakri et al. (2022) conducted a sentiment analysis to rate Iraqi tourism companies based on reviews on Facebook written in Iraqi dialect. The research uses Naïve Bayes, K-Nearest Neighbor (K-NN), and Rough Set Theory methods to classify reviews into positive, negative, or neutral sentiments. The results show that of the 71 tourism companies tested, 28% were rated excellent, 26% good, 31% moderate, 4% fair, and 11% poor. The results of this experiment help companies improve their services and programs to be more responsive to customer demands.
Meanwhile, Rizal et al. (2024) conducted sentiment analysis on Twitter to assess the sentiment of tourists about tourist destinations in Lombok using the Polynomial Naïve Bayes Classifier algorithm. Data is taken from user-published tweets related to aspects such as safety, cost, accommodation, and cleanliness. The results show that the highest positive sentiment is found in the cleanliness factor (77.92%), followed by the cost factor (75.32%), accommodation (62.33%), and safety (50.64%). These findings can help the government and tourism players improve service quality in the tourism sector.
Widya Utami et al. (n.d.) did sentiment analysis on tourist reviews in Bali using the Naïve Bayes algorithm and web framework. The research data consists of 2,779 reviews from various online platforms, including travel sites and discussion forums. The research process includes data collection, data cleaning, feature extraction, Naïve Bayes model implementation, and web platform development using Flask. The analysis results show that most reviews fall into the "Very Positive" category, with a total of 1,244 reviews. The "Positive" category had 776 reviews, "Neutral" 328, "Negative" 173, and "Very Negative" 259 reviews. The evaluation shows that the Naïve Bayes algorithm has an accuracy rate of 71%, which is considered good enough for sentiment analysis. This research successfully developed a web system to predict the sentiment of reviews in real-time.
In addition, Wiranti & Ramadhan Nasution (2024) conducted sentiment analysis on reviews of tourist attractions in Lake Toba using the Naïve Bayes method. Data was taken from several platforms, such as TripAdvisor, TikTok, and Google Forms, with a total of 1,260 reviews. The analysis process includes data preprocessing (case folding, cleaning, tokenization, stop words removal, and stemming) and weighting using TF-IDF. The analysis results show that of the collected reviews, there are 31 positive reviews, 378 neutral reviews, and 7 negative reviews. The accuracy of the Naïve Bayes method in predicting review sentiment reaches 77.49%, indicating that this method is quite effective for sentiment analysis on tourism review data.
Results from various studies show that the Naïve Bayes method is a reliable choice for sentiment analysis in the tourism sector due to its efficiency and ability to process large amounts of data with sufficient accuracy. As it was seen in studies conducted by several researchers, including those focusing on Bali, Lombok, and Lake Toba, the Naïve Bayes algorithm consistently provides good classification performance, with accuracy rates ranging from 71% to 77.49%. Its effectiveness in processing text
data and producing informative sentiment classifications supports the conclusion that Naïve Bayes is suitable for sentiment analysis in tourism research. This method offers a balance between simplicity, computational efficiency, and accuracy, making it an appropriate tool for analyzing sentiment on large datasets in the context of tourism reviews.
Method
The research and development method used in this study, shown in Figure 1, involves several key steps, such as gathering data, labeling and preparing text, using vectorized TF-IDF, applying SMOTE data, employing multinomial naive Bayes, testing, and putting it into action.
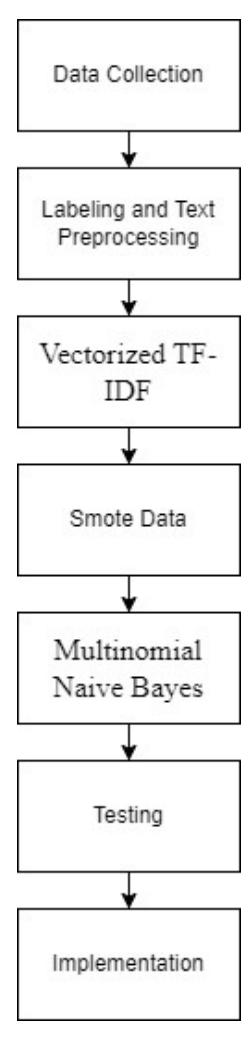
Figure 1 Research method Sources: Author data
Data Collection
In the data collection stage, the process of scraping data from user reviews on Google Maps related to five super priority tourism destinations (DPSP), namely Lake Toba, Borobudur, Mandalika, Labuan Bajo, and Likupang. The data retrieved includes the destination name, review ID, username, review text, rating, and date of the review given by the user. The scraping process is conducted using Python programming to automatically extract data from the Google Maps review page, which is then processed into a structured dataset. After the data is obtained, data preprocessing will be conducted.
Labeling and Text Preprocessing
In the labeling and text processing stage of the Super Priority Tourism Destinations evaluation, data preparation is conducted to clean, organize, and make the data usable and suitable for use in data analysis. This process consists of two main parts: data labeling and text preprocessing. In text preprocessing, several stages are conducted, such as case folding, normalization, stop word removal, tokenization, stemming, tokenization of stemming results, and then attribute merging. These steps ensure that the data is consistent, relevant, and ready for sentiment analysis.
Vectorized Tf-idf
The tf-idf score increases proportionally to the number of times a particular word appears in a given document (term frequency) and is normalized by the total number of documents in the corpus containing that word (inverse document frequency). The tf-idf matrix converts all documents into rows, with each word in the document represented as a column vector. The product of tf and idf is used to calculate the tf-idf score (Singh & Shashi, 2019).
The tf-idf formula is expressed as follows:
\[tfidf(t,d,D) = tf(t,d) \times idf(t,D)\] where:
t denotes a term, d denotes each document,
D denotes the set of documents in the corpus
Term Frequency(tf):
\[tf(t,d) = \frac{Number\ of\ occurrences\ of\ term\ t\ in\ document\ d}{Total\ number\ of\ terms\ in\ document\ d}\]
Inverse Document Frequency (idf):
\[idf(t,D) = log_e \left( \frac{Total\ number\ of\ documents\ in\ D}{Number\ of\ documents\ with\ term\ t} \right)\]
The multiplication between tf and idf results in a tf-idf score, which is used to measure the importance of a word in the context of the entire document corpus.
SMOTE Data
SMOTE (Synthetic Minority Over-Sampling Technique) is an algorithm used for over-sampling minority class data (Chawla et al., 2002). The design of this technique addresses unbalanced data between minority and majority classes. SMOTE increases the number of samples in the minority class by generating synthetic data. By adding synthetic samples to the minority class, SMOTE helps the model be more balanced in recognizing patterns from both classes, which will improve its accuracy and performance on unbalanced data.
Multinomial Naïve Bayes Classification
Multinomial Naïve Bayes is a supervised learning method that focuses on text classification by utilizing class probabilities in documents (Farisi et al., 2019). This algorithm can be applied by converting text into a nominal form that can be calculated as an integer. The probability calculation in multinomial Naïve
The Use of Naive Bayes Classifier in Sentiment... | Ery, Yuyun, Hayuning, Kristopher
Bayes is explained as follows:
\[P(c|d) \propto P(c) \prod_{1 \le k \le n_d} P(t_k|c)\] where:
is the conditional probability of word appearing in a document with class. This probability indicates the likelihood of word in class.
is the prior probability, which is the initial probability of a document belonging to class.
Class determination is calculated by comparing the posterior probability results obtained. The class with the highest posterior probability will be selected as the prediction result.
Formula Prior Probability:
\[P(c) = \frac{N_c}{N}\] where:
is the number of documents in category, is the total number of documents in all categories.
Formula Likelihood Probability:
\[P(t_k|c) = \frac{T_{tc}}{\sum_{t' \in V} T_{ct'}}\] where:
is the number of occurrences of word in documents with class, is the total number of occurrences of all words in class.
Using this approach, multinomial Naïve Bayes enables effective text classification based on the distribution of words in each class.
Testing
This research uses a confusion matrix to visualize the classification model's performance based on the correct and incorrect prediction values. The evaluation will produce accuracy, precision, and recall values. This confusion matrix was implemented on a dataset consisting of 3 classes: positive, negative, and neutral.
Implementation
The model that has gone through the testing stage will then be applied to the website platform to analyze tourist reviews, identifying whether the reviews are positive, negative, or neutral. This research will use Jupiter Lab for machine learning modeling, while the Next.js framework is used for website development.
Results and Discussion
During the data collection stage, we utilized 6720 data points from tourist reviews on Google Maps. This data is obtained by scraping techniques using the Python programming language. The data retrieved includes the destination name, review ID, username, review text, rating, and date of the review given by the user. After the data is obtained, data preprocessing is conducted by filling in empty values in the column with the value "null," removing the "+" symbol in the place name column, and finally separating the data based on language, namely Indonesian and English. Table I displays the results of scraping Google Maps data.
Table I Sampel Data Collecting Result
| Place Name | Caption A beautiful placeit's well organizedUNESCO protectedif you want to go to the templelimited number of peopleyou get fresh bast shoes and a bag for your shoes…I think it's greatit's still supposed to be available for interested people to visit in a few years | |
|---|---|---|
| Borobudur Temple | ||
| Paal Beach | The beauty of Pall Beach and the refreshing sea breeze make every visitor feel calm and peaceful. With rental huts available for Rp. 50,000, it allows us to bring our family and loved ones | Semuel Johan Eman |
| Lake Toba | While going home to my hometown, I stopped by Lake Toba It's really as beautiful as that, Lake Toba 😍 still so natural, not like in Jakarta where there's so much pollution | Cyta Rengganis |
| Mandalika | An international-class circuit, FIA standard, complete with safety equipment, clean and comfortable café, beautiful views, plus a bonus of being close to the beach. Thanks, Mandalika, I will always remember this moment | |
Data Preprocessing Result
The following are the results of data processing after separating the data based on language. The Indonesian data amounted to 2,087, as shown in Table II, while the English data amounted to 929, as shown in Table III. This data separation was done to ensure more accurate analysis with different language contexts so that the sentiment analysis results can provide more relevant insights based on preferences in each language. This data processing includes steps such as case folding, normalization, stop word removal, tokenization, stemming, tokenization of stemming results, and then attribute merging to ensure the data is ready for analysis. The process helps produce analysis results that are more accurate and in line with user preferences in each language.
Table II Sample Data Preprocessing Result in Indonesian
| Place Name | Caption | Username | Language | |
|---|---|---|---|---|
| Borobudur Temple | Nyampe jam 10 pagi udah ga bisa masuk ke atas. Maksimal 1200 pengunjung :"( | Jesica Maldini | Id | |
| Lake Toba | Sumpah keren banget tempatnya andai bisa berenang pengen nyemplung juga ngambilin ikannya trutama ikan bilihnyauenak bangeet | Goldy wae | Id | |
| Paal Beach | Ok2 punya hmmm and nth kpn lg bisa ke sana krn panorama nya pasir putih laut bersih Loh | Sharoe Tamar | Id | |
| Mandalika | Sirkuit yang menyatu dengan pemandangan pantai dan perbukitan Sungguh amazing!!! ðŸ'👠… | Ny. TARSI | id | |
Table III Sample Data Preprocessing Result in English
| Place Name | Caption | Language | ||
|---|---|---|---|---|
| Borobudur Temple | Absolutely an incredible place. It is like a perpetual mandala machine made of stone. The view from above is something! A true must see! The stupas and Buddha's hands hide a secret | Salvatore Bognanni | En | |
| Lake Toba | Xopouuee place, and most importantly - a wonderful island. Peace for everyone! #chopX | The Lord | En | |
| Paal Beach | An incredibly beautiful beach recomended | Telly Sofia | En | |
| Mandalika | How can you build something like that near one of the most beautiful beaches in Lombok and near the hotel 🙈 … | Patrik Kazor | En | |
Labelling and Text Preprocessing Result
After data collection, labeling and text preprocessing are conducted to provide labels and tokens for each review given. Labeling is done based on the rating of the tourist reviews they give, with a rating of 1 or 2 labeled as negative, a rating of 3 labeled as neutral, and a rating of 4 or 5 labeled as positive. Text preprocessing is done to clean the data with several stages, such as case folding, normalization, stop word removal, tokenization, stemming, tokenization of stemming results, and then attribute merging. Table IV is the result of labeling and text preprocessing from data that has been collected with several stages of text preprocessing.
Table IV Sample Labeling and Text Preprocessing Result
| Place Name | Caption | Rating | Label | Tokenized Caption |
|---|---|---|---|---|
| Borobudur Temple | A must-visit tourist destination because it's one of the UNESCO World Heritage sites in Indonesia. During my visit in July 2024, the trading area and parking were under renovation, so it was a bit of a walk to get to the parking area, which is managed by the local community. | 5 | Positif | ['tempat', 'wisata', 'wajib', 'krn', 'salah', 'satu', 'situs', 'cagar', 'budaya', 'dunia', 'aku', 'unesco', 'ada', 'indonesia', 'saat', 'kunjung', 'juli', '2024', 'area'] |
| Lake Toba | Incredibly beautiful, with more and more tourist destinations to choose from. I chose Lake Toba. | 4 | Positif | ['indah', 'luar', 'biasa', 'makin', 'banyak', 'tempat', 'wisata', 'pilih', 'danau', 'toba'] |
| Paal Beach | The road is long, damaged, and expensive. | 2 | Negatif | ['jauh', 'jln', 'rusak', 'mahal'] |
| Mandalika | On March 26, 2022, the security guard said the main building renovation was still not finished and they didn't know when it would be completed. Hopefully, it will open by the end of the year. The exterior looks like it's almost done. | 3 | Netral | ['26', 'maret', '2022', 'tempat', 'buka', 'kata', 'satpam', 'nya', 'masih', 'belum', 'selesai', 'renovasi', 'gedung', 'utama', 'nya', 'belum', 'tau', 'kapan', 'selesai', 'moga', 'akhir', 'tahun', 'buka', 'tampak', 'luar', 'kayak', 'hampir', 'selesai', 'sih'] |
| Batu Cermin Cave | A place of international standard. | 4 | Positif | ['tempat', 'taraf', 'internasional'] |
The result presented in Figure 2-3 shows the analysis of commonly occurring words in the positive, negative, and neutral comments. This analysis offers a more thorough summary of the word frequency in the observed data that indicates different kinds of feelings.
Figure 2 Positive wordcloud Figure 3 Negative wordcloud Figure 4 Neutral wordcloud
Vectorized Tf-idf Result
At this stage, text vectorization is performed using tf-idf vectorizer to convert messages into numerical representations, ignoring words that appear too frequently in more than 50% of the documents or less than 2 times. Figure 5 displays the final result in the form of a sparse matrix, where most of the values are zero, reflecting words that do not appear frequently in the documents.
Figure 5 Tf-idf result
SMOTE Data Result
SMOTE (Synthetic Minority Over-Sampling Technique) is applied to increase the number of samples in the minority class by creating synthetic data so that the machine learning model is not biased towards the majority class. Figure 6 and Figure 7 show the comparison of data distribution before and after SMOTE.
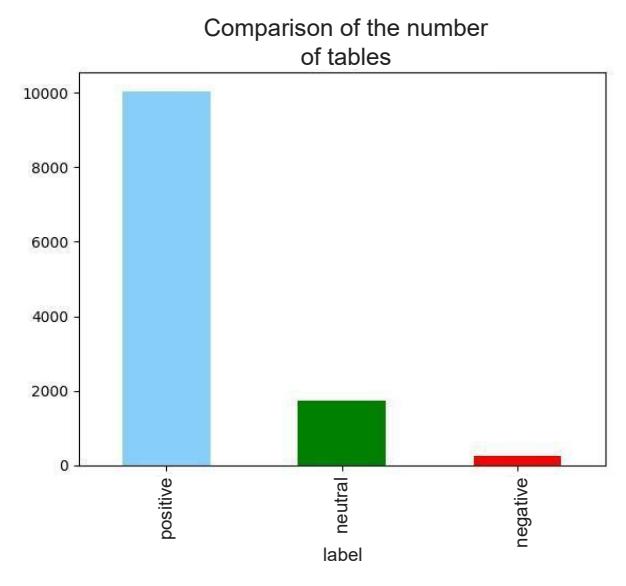
Figure 6 Data before SMOTE result
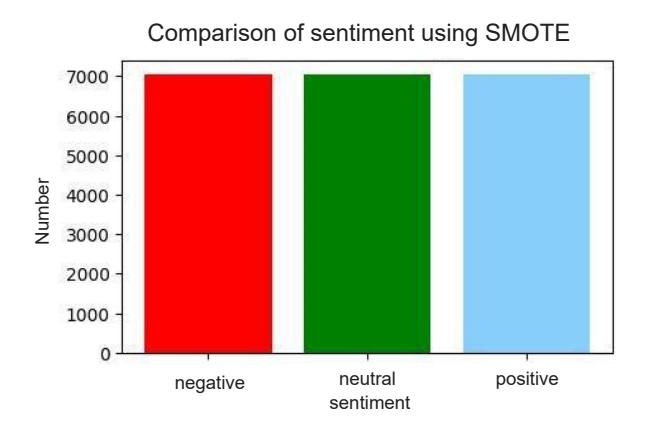
Figure 7 Data after SMOTE result
Multinomial Naïve Bayes Classification Result
After the SMOTE results successfully increase the amount of data in the minority class, the next step is to classify the reviews given by tourists using the Multinomial Naïve Bayes method. The result obtained from the training data is an accurate figure of 0.75, or 75%, with most of the data containing positive reviews. The confusion matrix is shown in Figure 8, and the accuracy results of precision, recall, and F1 score are shown in Figure 9.
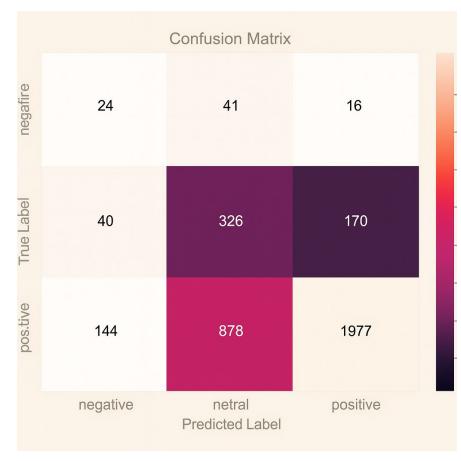
Figure 8 Confusion matrix result in Naive Bayes
Figure 9 Precision, recall and F1 score results with Naïve Bayes
Testing Result
This research uses a confusion matrix to visualize the performance of the algorithm used. Testing data: as many as 12,052 samples were tested with a training data and test data division ratio of 7:3 to obtain the best model. Data sharing is done with Python programming. The results of the naive Bayes performance visualized through the confusion matrix in Figure 10 show 24 true negative reviews, 326 true neutral reviews, and 1977 true positive reviews with an accuracy of 64%. Figure 11 displays the testing results for accuracy, precision, recall, and the F1 score.
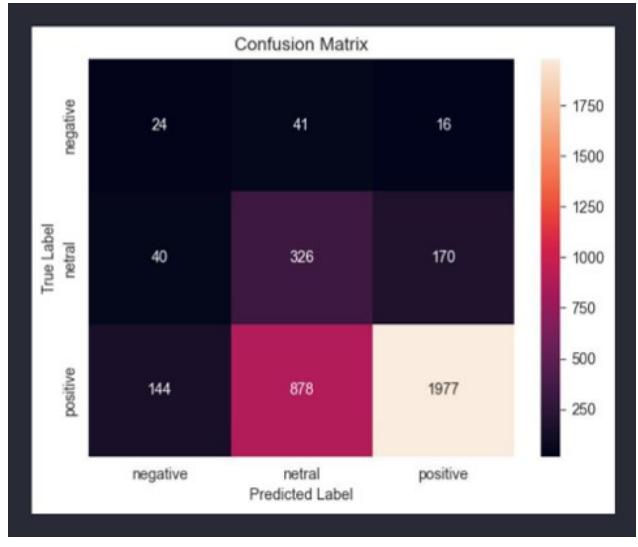
Figure 10 Confusion Matrix Result on Testing
| ccuracy of n | aive bayesı | nodel on t | raining date | a : 0.753082 | 0293978189 |
|---|---|---|---|---|---|
| Confusion mat | rix : | ||||
| 175 | 1 | ||||
| 48 104 | 109 | ||||
| 278 1646 | 5129 | ||||
| precision | recall | f1-score | support | ||
| negative | 0.35 | 0.99 | 0.52 | 177 | |
| neutral | 0.39 | 0.87 | 0.52 | 1206 | |
| positive | 0.98 | 0.73 | 0.83 | 7053 | |
| accuracy | 0.75 | 0.86 | 0.75 | 8436 | |
| weighted avg | 0.88 | 0.75 | 0.79 | 8436 | |
Figure 11 Precision, recall and F1 score results with Naïve Bayes
Implementation Result
The implementation to determine the positive, negative, or neutral value of the reviews given by tourists to the destination is applied to the website developed using the React-based Next.js framework with the JavaScript programming language. Figure 12 (Dashboard) shows the performance evaluation of the selected destination by displaying information about performance, response rate, reviews, popularity, overall rating, review count graph, top keywords, status overview, impact, sentiment overview, and customer feedback. Figure 13 (Similar Destination) displays a comparison of tours that are similar to the selected tour. This page also analyzes reviews from tourists that are positive or negative. Figure 14 is the flowchart of the Explorenesia website.
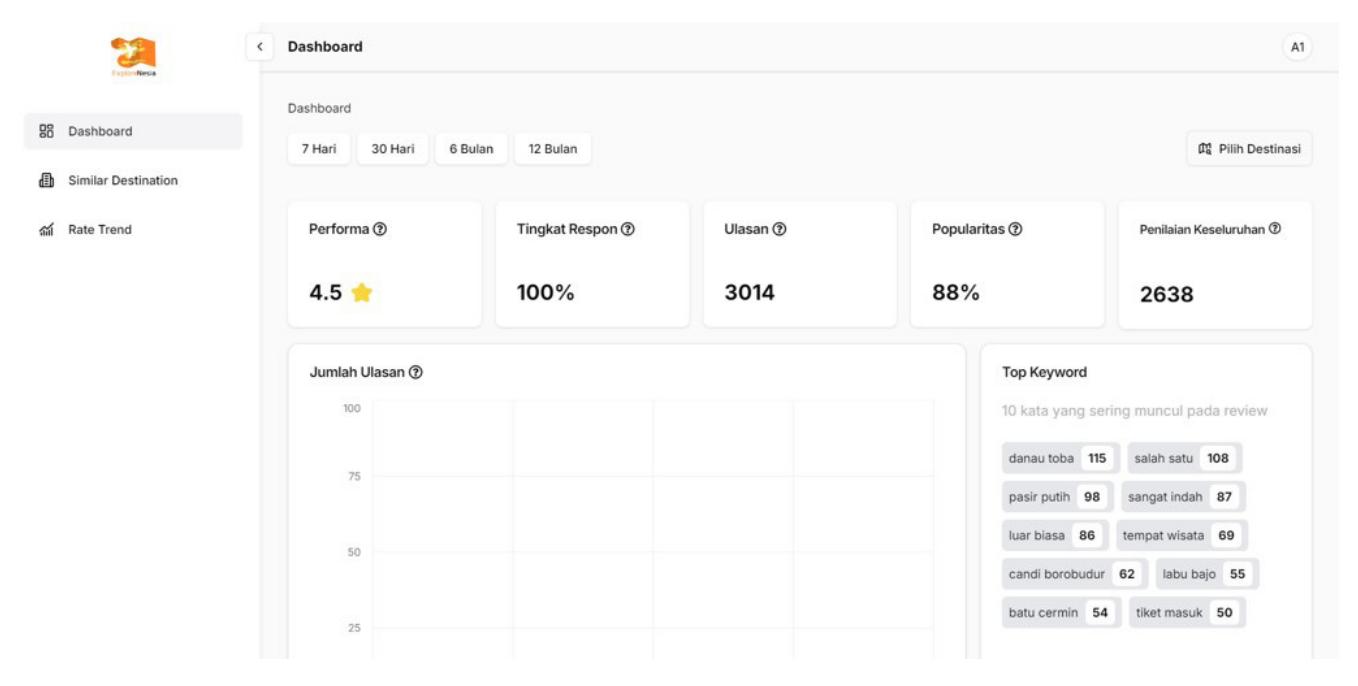
Figure 12 Dashboard implementation
Figure 13 Similar destination implementation
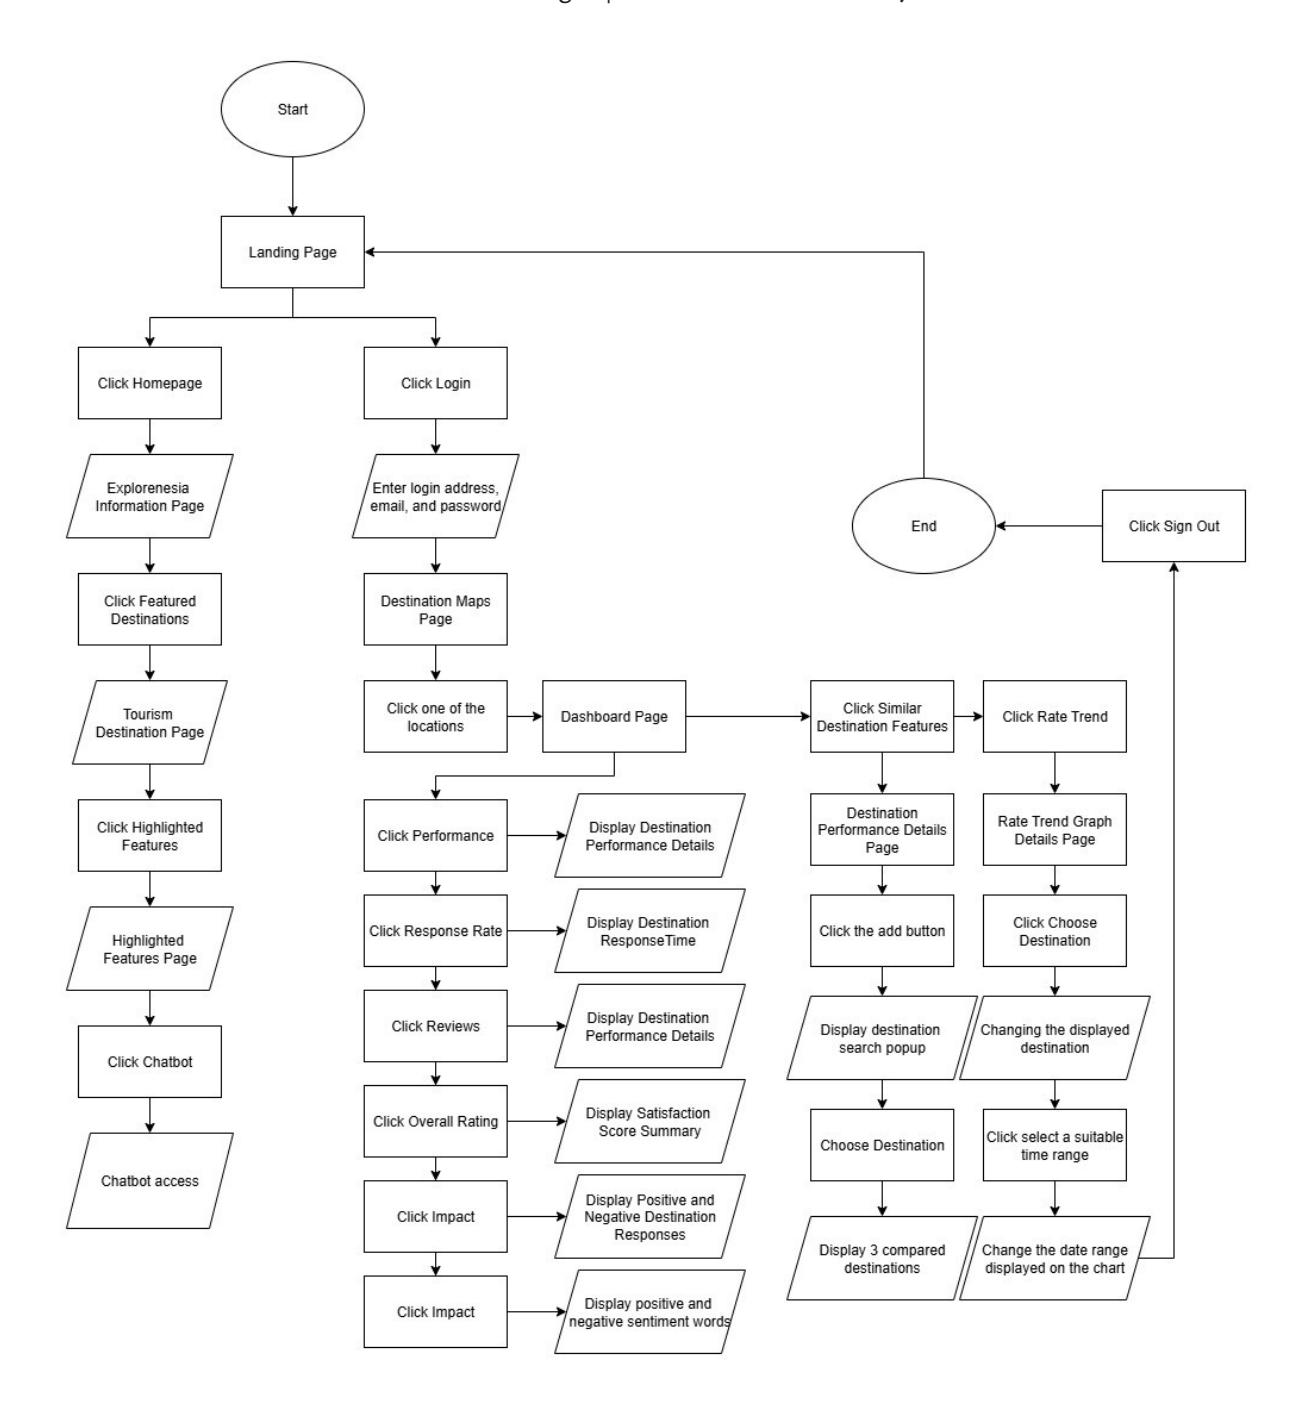
Figure 14 Flowchart website
Conclusion
This research shows that the use of digital technology is especially useful to improve the effectiveness of the evaluation of super priority tourism destinations (DPSP) in Indonesia, especially for the development of dashboards and sentiment analysis for tourist reviews using Naive Bayes. By utilizing big data from user reviews on Google Maps, this research was able to develop a platform that can visualize the performance of tourist destinations and can also perform sentiment analysis, which can provide accurate information about tourist opinions. The system also improves the quality of decision-making, which is more responsive to changes in traveler preferences. The results of the Naive Bayes model show 75% accuracy in classifying tourist reviews as positive, negative, and neutral. For future research, further development can be focused on adding data sources and optimizing the analysis model to improve accuracy and expand the scope of analysis.