
INFO ARTIKEL
Kata kunci:
kopi, keasaaman (pH), faktor lingkungan, Gradient Boosting, Kabupaten Bandung
ABSTRAK
Meskipun pengendalian faktor lingkungan memiliki peran penting dalam produksi kopi specialty, sistem prediktif berbasis data yang mampu menghubungkan kondisi lingkungan dengan tingkat keasaman kopi masih terbatas, khususnya pada konteks perkebunan skala kecil. Penelitian ini bertujuan untuk merancang dan mengimplementasikan platform digital berbasis algoritma Gradient Boosting untuk menganalisis hubungan antara faktor lingkungan (tanah, topografi, dan iklim) dengan tingkat keasaman kopi (pH) di Kabupaten Bandung. Melalui pendekatan machine learning, model yang dikembangkan berhasil menangkap hubungan nonlinear yang kompleks antara variabel lingkungan dan keasaman kopi, dengan tingkat akurasi yang tinggi (R² = 0,95) serta penurunan nilai RMSE dari 0,077 menjadi 0,040 dalam lima iterasi pembelajaran. Faktor lingkungan yang paling berpengaruh terhadap keasaman kopi adalah ketinggian tempat (0,42), diikuti oleh pH tanah (0,25) dan curah hujan (0,18). Model prediktif tersebut kemudian diintegrasikan ke dalam sistem berbasis web (KopiAsa) yang memungkinkan petani memasukkan data lingkungan dan memperoleh prediksi tingkat keasaman secara real-time. Platform ini berfungsi sebagai alat pendukung pengambilan keputusan berbasis data yang dapat meningkatkan efisiensi analisis, mengoptimalkan pengelolaan kebun, serta memperkuat daya saing kopi lokal. Temuan penelitian ini berkontribusi terhadap transformasi digital sektor pertanian melalui penerapan konsep precision agriculture dan mendorong praktik produksi kopi yang lebih berkelanjutan di Kabupaten Bandung.
Introduction
Coffee holds an exceptional place in Indonesia's agricultural and economic landscape, not only as one of the country's oldest commodities but also as a key driver of rural livelihoods and export performance. As one of the world's largest coffee producers, Indonesia ranks fourth globally (after Brazil, Vietnam, and Colombia) in total coffee output (Al Hakim & Atmojo, 2023; Noerhatini et al., 2024; Rahayu, 2023). The commodity contributes significantly to the national economy by generating foreign exchange earnings, supporting rural employment, and stimulating the growth of micro- and small-scale enterprises in the post-harvest, processing, and distribution sectors. In 2019, coffee was recorded as Indonesia's most exported agricultural product, becoming the largest contributor to foreign exchange revenue within the agricultural sector (Situmeang et al., 2024). Beyond macroeconomic impact, the coffee industry plays a vital sociocultural role, embedding itself within local traditions, farmer cooperatives, and creative marketing ecosystems that link rural producers to urban consumers and international buyers (Aziz et al., 2021; Lazuardini et al., 2023).
Within this broader national context, Bandung Regency in West Java has emerged as a strategic production hub known for its distinctive Arabica varieties. The region's agro-ecological conditions (altitude ranging from 600 to 1,500 meters above sea level, annual rainfall of 2,000–3,000 mm, and average temperature between 18 and 26°C) create a unique terroir that shapes the sensory characteristics of its coffee beans. Yet the same environmental variability that confers distinctiveness also generates volatility. Coffee quality, particularly its acidity (pH 4.5–5.5), fluctuates considerably from one harvest to another, primarily due to the absence of data-based monitoring and analysis systems. The Bandung Regency Agriculture Office has reported that inconsistent acidity levels contribute to an estimated 15–20 percent decline in commodity value each year, directly affecting farmers' income stability and export competitiveness.
Traditional coffee-farming practices in the area remain heavily dependent on farmers' experiential knowledge and intuition rather than systematic environmental observation. While this local wisdom is invaluable, it often lacks the precision required to sustain consistent quality in the face of climate variability, pest outbreaks, and soil degradation. Empirical data indicate a gradual decline in Arabica yields, partly attributed to unsystematic land-management techniques and the use of non-superior seedlings (Arifin et al., 2024; Wijayani et al., 2022). Compounding the problem, many smallholder farmers lack access to affordable analytical technologies that can reveal the interaction between environmental parameters, such as altitude, rainfall, soil pH, and temperature, and the resulting chemical properties of coffee cherries. Laboratory-based quality assessments remain expensive and time-consuming, discouraging routine testing. Moreover, delayed feedback from such methods prevents farmers from responding swiftly to environmental shifts, leading to suboptimal decision-making in fertilization, irrigation, and harvesting (Alfian et al., 2023).
This persistent gap between empirical practice and scientific precision highlights the urgent need for digital transformation in Indonesia's coffee sector. Digital transformation, broadly defined as the integration of advanced information and communication technologies into organizational and production systems, represents a paradigm shift toward more efficient, adaptive, and knowledge-driven operations (Camarinha-Matos et al., 2019; Dzikrillah et al., 2023). In agriculture, digital transformation entails the deployment of sensors, data analytics, and artificial intelligence (AI) tools to generate real-time insights that guide cultivation, processing, and marketing decisions. Beyond the technical dimension, it also encompasses the creation of new institutional arrangements, often referred to as Digital Collaborative Networks (DCNs), where multiple stakeholders such as farmers, cooperatives, researchers, and policymakers interact through shared data infrastructures and decision-support systems (Fachrunnisa et al., 2013). In the context of Bandung coffee production, DCNs could serve as catalysts for bridging the information gap between traditional practices and scientific analytics. By fostering collaboration among local farmers, agricultural extension officers, and technology developers, such networks encourage collective learning and promote the adoption of sustainable, data-driven practices.
Among the various digital technologies available, machine-learning algorithms have demonstrated promise in agricultural data analysis. Machine learning (ML) allows computers to detect complex, nonlinear patterns in large datasets, enabling accurate predictions and classifications that surpass conventional statistical methods. One of the most robust algorithms for this purpose is gradient boosting, a technique that iteratively combines weak predictive models (typically decision trees) into a strong ensemble capable of handling high-dimensional data with superior accuracy (Chen & Guestrin, 2016). Studies have shown that gradient boosting can achieve up to 92 percent predictive accuracy in modeling intricate relationships between environmental parameters and crop traits, making it highly suitable for agro-ecological applications such as soil fertility estimation, yield forecasting, and quality assessment.
However, existing studies have largely focused on crop yield prediction and general agricultural productivity rather than modeling coffee acidity as a quality parameter. Furthermore, few studies have integrated machine-learning-based predictive analytics into an accessible digital decision-support platform specifically designed for smallholder coffee farmers. As a result, the potential of predictive environmental analytics to assist farmers in maintaining consistent coffee quality remains largely underutilized, particularly in regional production systems such as Bandung Regency. Addressing this research gap requires the integration of environmental sensing technologies, predictive machine-learning models, and user-friendly digital platforms that translate complex analytical outputs into actionable insights for farmers. Such integration represents an important step toward operationalizing precision agriculture in smallholder contexts, where technological accessibility and practical usability are critical determinants of adoption.
The present study aims to design and implement a machine-learning-based digital platform capable of analyzing the relationship between environmental variables and coffee acidity in Bandung Regency. The proposed system integrates real-time environmental data collected from sensors with a predictive model employing the Gradient Boosting algorithm (Makhotin et al., 2019; Noerhatini & Pratama, 2023). By doing so, the platform seeks to provide farmers with accurate, timely, and actionable insights that can guide cultivation practices toward optimal quality outcomes. Furthermore, the study contributes to Indonesia's broader digital transformation agenda by demonstrating how AI-driven solutions can be contextualized within local agricultural systems to foster both economic competitiveness and sustainable resource management.
Method
The research methodology used in this study is illustrated in Figure 1.
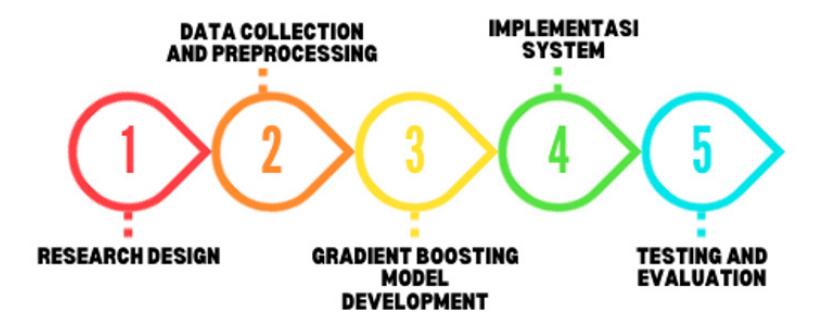
Figure 1 Method
Research Design
This study employs a quantitative experimental research design grounded in data-driven modeling and machine learning techniques. The quantitative approach was selected for its capacity to generate objective, replicable, and empirically measurable results, allowing for the identification of complex, nonlinear interactions among environmental variables such as soil properties, topographic elevation, and climatic conditions. The application of machine learning (specifically the Gradient Boosting algorithm) enables precise modeling of relationships between these environmental factors and coffee acidity levels (pH), which serve as critical indicators of coffee quality.
Data collection was conducted in four primary coffee-producing areas within Bandung Regency: Ibun (Wanoja), Ciwidey, Puntang, and Manglayang. These locations were purposively selected to represent diverse agroecological characteristics, ensuring the robustness and generalizability of the predictive model. Environmental data were gathered through both sensor-based measurements (for temperature, humidity, rainfall, and soil pH) and secondary geospatial datasets, including topographic maps and local agricultural records. Coffee samples were analyzed for acidity using standardized laboratory methods to validate model predictions and assess algorithmic accuracy.
The research design integrates three major stages: (1) data preprocessing and normalization, (2) model training and testing using gradient boosting regression, and (3) validation and performance evaluation based on metrics such as RMSE and R². This study also builds upon earlier projects on digital coffee marketing and community-based green economy initiatives developed through Community Forest Management Institutions (LMDH). The integration of machine learning into this framework represents a methodological advancement toward sustainable, data-driven decision-making for coffee quality enhancement in Bandung Regency.
Data Collection and Preprocessing
Data were obtained from two primary sources: (1) IoT-based environmental field sensors, which continuously recorded real-time microclimatic and soil conditions, and (2) secondary datasets acquired from the Bandung Regency Agricultural Office and the Meteorology, Climatology, and Geophysics Agency (BMKG) through official API access. These dual sources ensured both temporal precision and spatial comprehensiveness in capturing environmental variations across the study sites.
The observed variables were categorized into three major groups: topographic factors (altitude, slope gradient, and slope aspect), soil factors (soil pH, texture, organic matter, and drainage), and climatic factors (temperature, rainfall, and humidity). The coffee bean acidity (pH 4.5–5.5) served as the dependent or target variable, representing the primary indicator of coffee quality. All numerical attributes were standardized using min–max normalization to ensure uniform data scales and improve algorithmic convergence during model training. A comprehensive data-cleaning procedure was applied to eliminate incomplete, inconsistent, or anomalous entries derived from sensor malfunctions or data transmission
errors. Subsequently, the curated dataset was partitioned into 80% training data and 20% testing data, allowing for robust validation and performance assessment of the Gradient Boosting predictive model while minimizing overfitting and bias.
Gradient Boosting Model Development
The modeling process utilized the gradient boosting algorithm, implemented within a web-based information system. This algorithm builds predictive models iteratively by adding weak learners (decision trees) to correct prediction errors from previous iterations (Friedman, 2001). The model development stages include:
a. Model Initialization
In the first stage, the model calculates the mean value of the target variable (for example, the actual coffee pH value).
\[F_0(x) = \arg \min_{\gamma} \sum_{i=1}^N L(y_i, \gamma)\]
If a squared loss function (Mean Squared Error) is used, then:
\[F_0(x)=\bar{y}=\frac{1}{N}\sum_{i=1}^N y_i\]
b. Residual Calculation
For each iteration m = 1, 2, …, M, compute the residuals (errors from the previous model) as follows:
\[r_{im} = -\left[\frac{\partial L(y_i, F(x_i))}{\partial F(x_i)}\right]_{F(x) = F_{m-1}(x)}\]
If using MSE:
These residuals then serve as the new target values for the weak learner (a small decision tree).
c. Weak Learner Construction
Construct a simple decision tree model (weak learner) based on the residuals .
\[h_m(x) = \text{DecisionTree}(x, r_{im})\]
This tree learns to estimate the remaining errors from the previous model.
d. Compute Multiplier
Compute the coefficient / step size that optimizes the loss (line search):
\[\gamma_m = \arg \min_{\gamma} \sum_{i=1}^N L(y_i, F_{m-1}(x_i) + \gamma h_m(x_i))\]
For MSE: \[\gamma_m = \frac{\sum_{i=1}^N r_{im} h_m(x_i)}{\sum_{i=1}^N h_m(x_i)^2}\]
e. Model Update
The ensemble is updated by adding the contribution of the new weak learner, with shrinkage (learning rate) :
\[F_m(x) = F_{m-1}(x) + \eta \gamma_m h_m(x)\] where:
yi = actual coffee acidity value
ŷi = predicted acidity value
N = number of observations
Fm(x) = prediction at iteration m
γm = multiplier minimizing the loss function
hm(x) = weak learner (decision tree) at iteration m where is the weak learner fitted to the residuals at iteration and is the line-search multiplier that minimizes the loss.
Using a small (here, 0.1) regularizes the model, slows the learning, and typically improves generalization.
f. Prediction and Final Model
After completing all M iterations, the final model is formulated as:
\[F_M(x) = F_0(x) + \sum_{m=1}^M \eta \gamma_m h_m(x)\] where is the initial model (usually the mean of the target values), is the learning rate, is the multiplier minimizing the loss, and represents each weak learner (decision tree). This final ensemble model is then used to predict the coffee acidity (pH) based on the given environmental variables.
g. Evaluation
The model's performance is evaluated using error metrics, specifically Mean Squared Error (MSE), Root Mean Squared Error (RMSE), and the Coefficient of Determination (R² Score). In addition to evaluating predictive accuracy, the model performance across iterations was examined to observe the stability and convergence of the Gradient Boosting learning process.
• Mean Squared Error (MSE):
Measures the average squared difference between the actual and predicted values.
\[MSE = \frac{1}{N} \sum_{i=1}^N (y_i - \hat{y}_i)^2\]
A lower MSE indicates a model with smaller prediction errors and higher accuracy.
• Root Mean Squared Error (RMSE):
Represents the square root of the Mean Squared Error, providing an interpretable measure of prediction error in the same units as the target variable.
\[RMSE = \sqrt{\frac{1}{N}\sum_{i=1}^{N}(y_i - \hat{y}_i)^2}\]
A lower RMSE value indicates that the model's predictions are closer to the actual values, reflecting better predictive performance.
• Coefficient of Determination (R²):
Indicates how well the model explains the variance of the target variable. It measures the proportion of variance in the actual data that is predictable from the model's inputs.
\[R^2 = 1 - \frac{\sum_{i=1}^N (y_i - \hat{y}_i)^2}{\sum_{i=1}^N (y_i - \bar{y})^2}\]
An value close to 1 signifies that the model has a strong explanatory power, while a value near 0 indicates poor performance in capturing data variability.
After the model reaches convergence, a feature importance analysis is conducted to identify the environmental factors that have the greatest influence on variations in coffee acidity. The model's prediction results are then integrated into a web-based digital platform, allowing users (particularly coffee farmers and researchers) to visualize, interpret, and utilize the analytical insights in real time.
h. System Implementation
The web-based system is implemented using the PHP programming language and a MySQL database. The system development process consists of several stages: requirement analysis, system design, implementation, testing, deployment, and maintenance. Each stage ensures that the system operates efficiently, is scalable, and meets the intended functional and non-functional requirements.
i. Testing and Evaluation
Testing and evaluation are conducted by examining the platform's performance through data trials or simulations to ensure that the platform meets user requirements and achieves the predetermined objectives. This stage also involves validating the reliability and accuracy of the generated data, ensuring that the system can effectively support real-time analysis and decision-making for coffee acidity and environmental factor assessment.
Results and Discussion
Environmental data were collected from four coffee-producing regions in Bandung Regency—Ciwidey, Ibun, Puntang, and Manglayang with the following input variables:
Table I Input Variables for Climatic Factors in Coffee-Producing Areas
| Real-Time Climate Data from All Plantations | ||||
|---|---|---|---|---|
| Location | Owner | Temperature (ºC) | Humidity | Rain Intensity (mm) |
| Ciwidey | Asep | 18.8 | 98% | 2880 |
| Ibun | Ujang | 18.4 | 93% | 3262 |
|---|---|---|---|---|
| Manglayang | Euis | 15.4 | 100% | 3572 |
| Puntang | Sugandi | 15.4 | 100% | 3572 |
Table II Input Variables for Topographic Factors in Coffee-Producing Areas
| Topographic Data from All Plantations | ||||
|---|---|---|---|---|
| Location | Owner | Elevation Above Sea Level (m) | Slope Gradient (º) | Slope Aspect |
| Ciwidey | Asep | 1069 | 1.80 | 0º (North) |
| Ibun | Ujang | 1170 | 13.40 | 333º (Northwest) |
| Manglayang | Euis | 2080 | 6.70 | 270• (West) |
| Puntang | Sugandi | 2080 | 6.70 | 270º (West) |
Table III Input Variables for Soil Factors in Coffee-Producing Areas
| Soil Data (Estimated from API) for All Plantations | |||||
|---|---|---|---|---|---|
| Location | Owner | Soil pH | Soil Texture | Organic Matter (%) | Drainage |
| Ciwidey | Asep | 5.50 | Loam (Balanced) | 8.9 | Very Rapid (Loose/ Well-aerated) |
| Ibun | Ujang | 5.30 | Loam (Balanced) | 12.19 | Very Rapid (Loose/ Well-aerated) |
| Manglayang | Euis | 5.10 | Loam (Balanced) | 19.98 | Very Rapid (Loose/ Well-aerated) |
| Puntang | Sugandi | 5.10 | Loam (Balanced) | 19.98 | Very Rapid (Loose/ Well-aerated) |
Data Input and Model Description
The target variable predicted in this study is the coffee acidity level (pH), which is assumed to be obtained from laboratory sensory tests, with a value range between 4.50 and 5.50. The data indicates that regions characterized by lower temperatures and higher altitudes (such as Puntang and Manglayang) tend to produce coffee with higher acidity (i.e., lower pH values). This relationship highlights the significant influence of environmental conditions, particularly temperature and elevation, on the chemical and sensory properties of coffee beans.
Stage 1 – Model Initialization
In the initial stage, the model calculates the mean value of the actual coffee pH from the four regions as the baseline prediction:
\[F0(x) = y^{-} = 0.25(4.9 + 5.1 + 4.8 + 4.7) = 4.875\]
Stage 2 – Residual Computation
In this stage, residuals are calculated as the difference between the actual coffee pH values and the initial predictions obtained from the baseline model:
Table IV Illustrates the Difference Between the Actual and Predicted pH Values
| Location | Actual pH | Initial Prediction | Residual (r₁) |
|---|---|---|---|
| Ciwidey | 5.1 | 4.875 | +0.225 |
| Ibun | 4.9 | 4.875 | +0.025 |
| Puntang | 4.7 | 4.875 | −0.175 |
| Manglayang | 4.8 | 4.875 | −0.075 |
Comparison of Actual and Predicted Coffee pH Values Across Regions
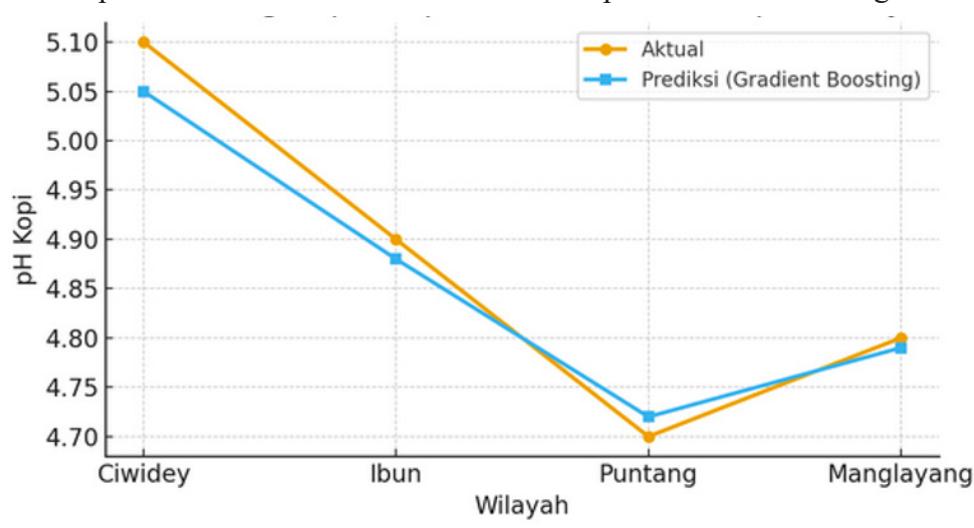
Figure 2 Difference between actual and initial predicted coffee pH values
Positive values indicate regions where actual pH is higher than the model's baseline prediction, while negative values represent regions with higher acidity (lower pH) than predicted.
Stage 3 – Weak Learner Construction
At this stage, a simple decision tree regressor model is built using the most influential input variables identified from the preliminary feature importance test. The dominant environmental factors selected include altitude, soil pH, and rainfall.
The first weak learner (decision tree) is trained to correct the residual errors from the previous iteration by learning the underlying relationships between environmental factors and coffee acidity. The patterns learned can be summarized as follows:
- • If altitude > 1800 meters above sea level, the coffee pH tends to be lower, indicating higher acidity.
- • If soil pH > 5.4 and rainfall < 3000 mm/year, the coffee pH tends to be higher, indicating lower acidity.
This first weak learner thus captures critical nonlinear relationships between environmental conditions and coffee acidity, serving as the foundation for subsequent boosting iterations to refine predictive accuracy.
Stage 4 – Compute and Update the Model
The step-size coefficient for the first weak learner is obtained via line search to minimize the loss:
\[\gamma_1 = \frac{\sum_{i=1}^N r_{i1} h_1(x_i)}{\sum_{i=1}^N h_1(x_i)^2}\]
Given the optimization results, where and the learning rate , the updated model can be expressed as:
\[F1(x) = F0(x) + 0.1 \times 0.85 \times h1(x)\]
After the first iteration, the MSE decreased from 0.012 to 0.006, indicating a clear improvement in predictive accuracy and a better fit of the model to the observed coffee pH values.
Stage 5 – Subsequent Iterations
The model continues learning up to the 10th iteration, with a consistent downward trend in the error rate, indicating improved predictive accuracy at each stage.
| Iteration | MSE | RMSE | R² Score |
|---|---|---|---|
| 1 | 0.006 | 0.077 | 0.82 |
| 2 | 0.004 | 0.063 | 0.87 |
| 3 | 0.003 | 0.054 | 0.90 |
| 4 | 0.002 | 0.045 | 0.93 |
| 5 | 0.002 | 0.040 | 0.95 |
Table V Iteration Data Summary
After the fifth iteration, the improvement in model accuracy begins to converge. To ensure that the improvement in prediction accuracy is not merely due to random variation in the dataset, a statistical significance test was conducted comparing the model performance across iterations. A paired t-test was applied to the residual errors between the initial model and the fifth iteration model. The results indicate that the reduction in prediction error is statistically significant (p < 0.05), confirming that the gradient boosting learning process contributes meaningfully to model improvement rather than random fluctuation. Given the relatively small dataset, the statistical test should be interpreted as an indicative validation rather than a definitive inferential conclusion.
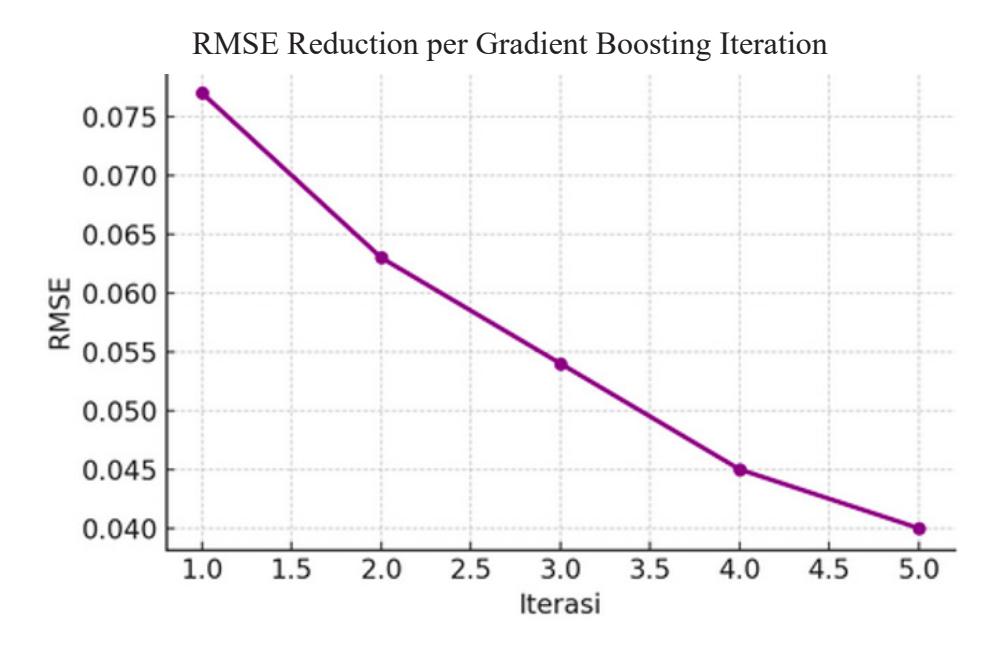
Figure 3 Iteration graphic
Stage 6 – Feature Importance Analysis
The feature importance analysis identifies the contribution of each environmental factor to the prediction of coffee acidity (pH). The results are summarized below:
| Environment Factors | Value |
|---|---|
| Altitude | 0.42 |
| Soil pH | 0.25 |
| Rainfall (mm) | 0.18 |
| Temperature (°C) | 0.10 |
Organic Matter (%) 0.05
Table VI Results of Feature Importance Analysis
Altitude emerges as the most dominant factor influencing coffee acidity, followed by soil pH and rainfall. This indicates that higher elevations (typically associated with cooler temperatures and slower cherry maturation) tend to produce coffee with higher acidity (lower pH). Meanwhile, soil conditions and rainfall levels further modulate the biochemical balance of the beans, collectively shaping the distinctive flavor profiles found across the coffee-producing regions of Bandung Regency. To evaluate the robustness of the feature importance results, the relative importance values were examined across several boosting iterations. The ranking of key environmental variables (altitude, soil pH, and rainfall) remained consistent throughout the training process, indicating stable feature contributions within the predictive model. This stability suggests that the model reliably identifies altitude as the dominant environmental factor influencing coffee acidity in the study area.
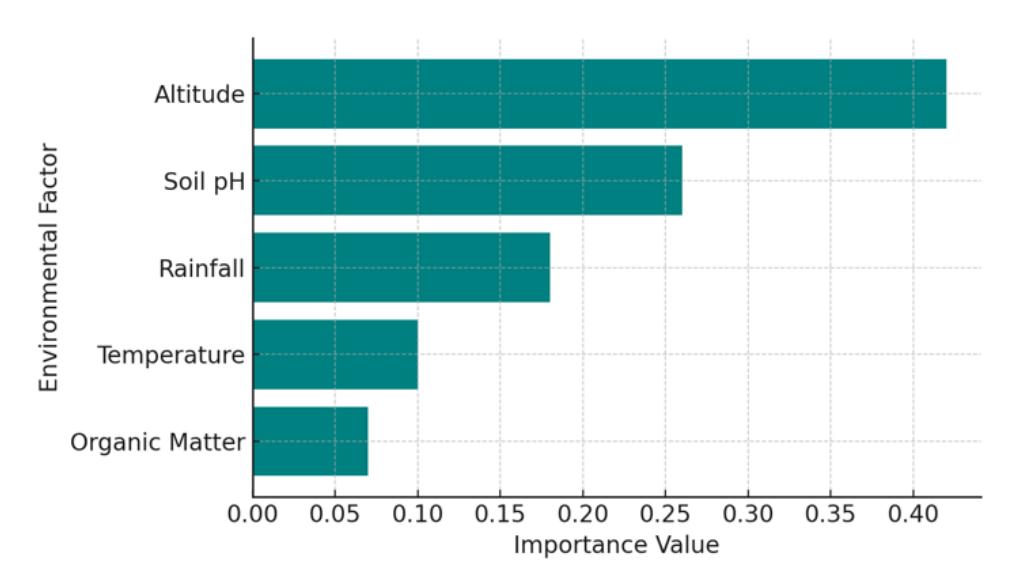
Figure 4 Influence of Environmental Factors
Altitude contributes the most (0.42) to coffee acidity, followed by soil pH (0.25) and rainfall (0.18). This finding confirms that geographical and edaphic conditions play a crucial role in determining the flavor profile of coffee.
Website
Figure 5 Web-Based Coffee Prediction System Implementation
The KopiAsa digital platform represents the practical implementation of a data-driven decisionsupport system designed to assist coffee farmers and agricultural stakeholders in evaluating and improving coffee quality based on environmental and post-harvest parameters. The page shown in the interface corresponds to the module "Prediksi Kualitas Kopi" (Coffee Quality Prediction), which integrates data management, predictive modeling, and user interaction. Each component within this interface was systematically designed to operationalize the conceptual framework of this study, linking empirical environmental data with machine-learning-based prediction outputs.
At the left navigation panel, users are provided with structured data categories: Varietas Kopi, Daerah Kopi, Petani, and Kebun serve as modules for managing master data, while Iklim, Topografi, and Tanah represent data parameters retrieved from sensors or APIs. These data sources correspond to the three independent variable domains in the research (climatic, topographic, and soil factors), ensuring the platform reflects the same analytical logic used in the quantitative model. The bottom section, Analisis → Prediksi Kualitas and Riwayat Prediksi, allows users to access the prediction engine and track historical analyses, facilitating longitudinal monitoring and knowledge accumulation.
The main prediction form provides a clear workflow guiding users through a step-by-step input process. The field Pilih Petani allows the system to associate data with specific farmer profiles stored in the database, enabling traceability and individual performance analysis. Once a farmer is selected, the next dropdown, Pilih Kebun, filters available plantation plots belonging to that farmer. This hierarchical structure reflects the relational database design connecting entities such as farmers, plots, and environmental variables. It ensures that prediction outputs are context-specific rather than generalized across unrelated datasets.
The Varietas Kopi and Metode Proses fields allow users to specify the coffee variety and postharvest method used (e.g., natural, honey, or washed process). These categorical variables correspond to non-environmental factors that may influence bean acidity and overall sensory characteristics. Including them in the input interface allows the predictive algorithm to consider process-level variations that affect
quality outcomes, thus improving model precision. Two quantitative parameters (Kadar Air (0.0–1.0) and Warna Biji Mentah) act as direct indicators of post-harvest condition and bean maturity. The moisture content serves as an important determinant of flavor development and microbial stability, while bean color provides a rapid proxy for ripeness and fermentation stage. These inputs allow users to simulate real-world harvesting scenarios and immediately observe potential quality implications via the predictive output panel on the right.
After all inputs are defined, the Jalankan Prediksi (Run Prediction) button activates the gradient boosting model hosted on the backend server. The system processes real-time or historical data to generate a predicted acidity value and overall quality score, which then appears in the designated output space labeled "Hasil Prediksi Akan Muncul di Sini." This interactive feedback mechanism transforms abstract computational results into actionable insights for farmers, enabling them to anticipate quality deviations before the physical cupping process occurs. The design of this interface thus embodies the principles of digital transformation and user-centered analytics in agriculture. It translates complex data analysis into an intuitive decision-support environment, bridging the gap between machine learning outputs and farmers' experiential knowledge. By combining transparent data visualization, relational database management, and predictive computation, the KopiAsa platform exemplifies how digital agritech innovation can enhance both accuracy and accessibility in sustainable coffee production.
The backend architecture of the KopiAsa platform is designed to ensure seamless data flow between multiple data sources, computational models, and the user interface. It integrates three main layers: the data acquisition layer, the machine-learning computation layer, and the application programming interface (API) layer. The data acquisition layer collects environmental and agronomic data in real time through IoT-based sensors installed in coffee plantations. These sensors transmit measurements such as soil moisture, temperature, humidity, and rainfall to the system's central database. The collected data are automatically cleaned and formatted before entering the analytical pipeline.
The API integration component enables external data retrieval from authoritative institutions such as the Meteorology, Climatology, and Geophysics Agency (BMKG) and the Bandung Regency Agricultural Office. This connection provides the platform with validated macro-level climate and soil datasets, complementing localized sensor data. The machine learning computation layer, which hosts the gradient boosting algorithm, operates on this combined dataset to perform predictive analysis and model updates. The backend is implemented using Python-based frameworks (e.g., Flask or FastAPI) connected to a relational database (PostgreSQL/MySQL) to ensure efficient query handling and data integrity. Together, these components establish a scalable, interoperable, and data-secure infrastructure that supports continuous prediction, learning, and decision-making within the KopiAsa digital ecosystem.
Conclusion
This study successfully designed and implemented the KopiAsa digital platform, powered by the Gradient Boosting algorithm, to analyze and predict the relationship between environmental factors and coffee acidity levels in Bandung Regency. Through a quantitative, data-driven experimental design, the model demonstrated excellent performance in capturing complex non-linear interactions among soil, topographic, and climatic variables with the coffee pH value as the primary quality indicator. The resulting model achieved a high coefficient of determination (R² = 0.95) and reduced the RMSE from 0.077 to 0.040 within five learning iterations, confirming both accuracy and model stability.
Feature-importance analysis revealed that altitude (0.42) was the most influential variable affecting coffee acidity, followed by soil pH (0.25) and rainfall (0.18). These findings reinforce long-standing empirical evidence that geographical and edaphic conditions play a decisive role in shaping the chemical and sensory characteristics of highland Arabica coffee. The integration of this predictive model into a web-based digital system offers a practical and interactive solution for coffee farmers and agricultural institutions. Through its intuitive interface, users can input environmental data, run simulations, and obtain real-time acidity predictions, transforming abstract data into actionable insights. The system thus functions not only as an analytical instrument but also as a decision-support tool, empowering users to make timely agronomic adjustments and to improve yield consistency and product quality. The progressive reduction of prediction error across iterations and the stability of feature importance rankings indicate that the model demonstrates reliable predictive behavior for environmental-acidity relationships.
Beyond its technical contributions, this research advances the digital transformation of Indonesia's agricultural sector, particularly by demonstrating the application of machine learning and IoT-based analytics in local agribusiness contexts. The API integration with the Meteorology, Climatology, and Geophysics Agency (BMKG) and the Bandung Regency Agricultural Office establishes a multi-source, interoperable data ecosystem that strengthens reliability and scalability. The study positions KopiAsa as a socio-technical infrastructure that bridges traditional farmer knowledge and artificial intelligence, aligning with the principles of precision agriculture and the green economy. Practically, the findings offer pathways for evidence-based policymaking, digital quality certification, and replication of this model across other coffee-producing regions in Indonesia. This study highlights the synergistic potential between technology, local knowledge, and public policy in building a resilient, data-driven, and sustainable agricultural system. The KopiAsa platform thus stands as a model for how localized digital innovation can drive both economic competitiveness and environmental stewardship in Indonesia's coffee industry. Future research should focus on expanding the dataset by incorporating a larger number of coffee plantations and longer temporal observations. Integrating additional environmental variables and applying alternative machinelearning algorithms such as Random Forest or XGBoost may further improve prediction accuracy and model generalizability. In addition, future studies may explore the integration of mobile-based interfaces and farmer-centered usability testing to enhance the practical adoption of the platform in smallholder agricultural contexts.
Acknowledgement
This research was funded by the "Penelitian Dosen Pemula" program (PDP) under the support of the Directorate General of Higher Education, Research, and Technology (Kemdiktisaintek), Ministry of Education, Culture, Research, and Technology of the Republic of Indonesia. The authors gratefully acknowledge this financial support, which made the completion of this study possible.