
INTRODUCTION
Virtual reality (VR) is a technology that can provide users with the sensation of being in a simulated virtual environment (Hartini et al., 2020). According to researchers, Virtual Reality (VR) is a computer technology that produces a 3D environment, where a person is separated from the real environment and can interact in real time with the five senses in a virtual environment that makes the user feel as if they are experiencing a real situation (Flavián et al., 2019; Loureiro et al., 2020;
Rauscher et al., 2020; Suhendar & Fernando, 2016).
Tourism is an essential element of the Indonesian economy. Consequently, variations in tourism conditions affect governmental earnings. The Tourism Industry Trends report from the Ministry of Tourism and Creative Economy (KEMENPAREKRAF) indicates that state revenues decreased by IDR 20.7 billion in 2020 because of the elevated number of confirmed COVID-19 cases, extensive social restrictions, and the cessation of international travel. (KEMENPAREKRAF, 2021).
The use of virtual reality technology is not only limited to games, but is also used in various fields, one of which is the tourism sector (Wibisono et al., 2023). The benefits of using VR in the tourism sector include: 1). Providing a different experience to users, so users can imagine themselves in the environment displayed, 2). Displaying 360° visuals that allow users to experience the environment as a whole, 3). Providing an interactive experience, so that users can explore according to their wishes, 4). Providing a unique and memorable experience, 5). Strengthening reputation and identity 6). Providing a virtual tourism experience for tourists who cannot physically travel, 7). Minimizing the negative impact of tourism on vulnerable destinations (Beck et al., 2019).
VR is a brilliant marketing tool for tourism (Rauscher et al., 2020). The reason behind this is because VR can reduce anxiety about tourist attractions that don't live up to expectations. VR can also provide a "try before you buy" experience for audiences, helping travelers get the experience they expect. This makes it easier for prospective travelers to experience the thrill of traveling firsthand using VR. With VR, tourists can easily visualize their destinations (Waraney dkk., 2017). VR provides a sense of existence and is more engaging because it can stimulate a better
perception of the environment, which is a factor in increasing tourist interest (Bigne & Maturana, 2023; Nakamura, 2021).
Since before the Covid-19 pandemic, VR has been used as a promotional medium, growing even further since the Covid-19 pandemic emerged and continues to this day. Moreover, during the pandemic, many tourism promotions and advertisements have utilized VR technology. For example, Wonderful Indonesia, an Indonesian tourism and creative economy brand managed by the Ministry of Tourism and Creative Economy of the Republic of Indonesia, uses 360° technology in several tourism promotions on its YouTube channel. The use of VR in tourism promotional media is expected to increase the number of tourist visits to tourist destinations. Tourism promotional media or advertisements that utilize VR technology can vary according to marketing needs and objectives. One tourism promotional media that uses VR technology includes promotional videos using 360° techniques.
Yusrin & Sugiant (Yusrin & Sugianto, 2021)conducted research on virtual tourism. The results showed that enjoyment and entertainment did not influence tourists' continued use of virtual tourism. However, background, education, and flow did. Good tourism promotion is considered effective if it attracts tourists. Consumer interest in purchasing a product or service is similar to tourists' interest in visiting a destination
(Kotler, 2006). The purpose of this study was to examine the effect of using virtual realitybased 360° video techniques in tourism promotion on perceptions of visit intention. Several studies have often shown that the level of familiarity (a person's relationship or understanding of something) has a positive influence on a person's visit intention (Tan & Wu, 2016). The concept of familiarity often occurs together with concepts such as awareness, knowledge, experience, and expertise (Sharifpour et al., 2014). Alba & Hutchinson (1987) link familiarity with experience and define it as "the amount of product-related experience a consumer has accumulated." (Hutchinson & Waters, 1987).
From the explanation above, the following hypotheses are derived:
- o Hypothesis 0 (H0): There is no effect of using virtual reality-based 360° video techniques in tourism promotion on perceived intention to visit.
- o Hypothesis 1 (H1): The influence of the use of 360° video techniques based on virtual reality in tourism promotion on the perception of interest in visiting.
Perception
Perception is a process that begins with the use of the five senses to receive stimuli, which the brain then organizes and interprets so that we can understand what we sense (Irmadhani & Nugroho, 2012). Perception is a process of meaning that is related to past experiences, based on the stimuli received through the five senses. (Muflih, 2006)Hawkins and Coney define perception as the process by which stimuli are selected, organized, and interpreted (Suhartapa & Sulistyo, 2021).
Virtual Reality in Tourism Promotional Videos
VR has been embraced by the tourism industry with open arms. Perceived enjoyment, technology anxiety, perceived immersion, social influence, and sensation seeking have been shown to influence tourism activists' intention to use VR in tourism (Khaqiqi & Alfansi, 2022). This technology helps with destination planning, accessibility, preserving historical heritage and promotion in the tourism sector(Guttentag, 2010).
The feelings gained from the virtual environment create a positive impression on the interest of potential tourists, which leads to destination preference and a greater likelihood of volunteering to visit the place in person (Tussyadiah et al., 2017).
Virtual reality can provide a virtual presence to its users. Virtual presence itself consists of physical (sensory) virtual presence, including the senses of sight, hearing, and touch, and mental virtual presence (the level of a person's ability to mentally feel present in a virtual environment).
Tourism Promotion Video
Video is a technology that makes it possible to capture, record, process, transmit, and rearrange captured motion. (Purnama, 2013). Promotion is an encouragement to buy and sell products or services (Jaiz, 2014). Tourism is a journey from one place to another, with the aim of seeking balance and happiness with the environment in social, cultural and natural dimensions (Spillane, 1987). From this definition, it can be concluded that tourism promotional videos are a communication medium that can be recorded and has a wide reach, aiming to encourage ticket sales for tourist destinations.
Advertisements or promotions consist of two elements: video and audio. 1) The video element of an advertisement is the component that appears on the screen. This component includes the setting (place and time), talent, lighting, graphics, and color. 2) The audio element consists of several components such as voice, music, and sound effects. (Belch & Belch, 2003).
Interest in Visiting
Interest is a component of consumer behavior that is related to consumption attitudes (Kinnear & J. R. Taylor., 2003). This includes respondents' tendency to take action before a formal purchase decision is made. Interest is personal and related to attitudes. When someone is interested in an object, that interest creates a strong drive to acquire it. (Hapsara & Ahmadi, 2023).
Interest is a plan or tendency of a person to behave in a certain situation, whether it is ultimately implemented or not(Ajzen & Fishbein, 2005). Interest is a thought that arises as a result of a feeling of attraction and desire to have a desired good or service (Sciffman & Kanuk, 2007). Interest can be measured through several aspects, namely: 1) the desire to seek information; 2) considerations for visiting; 3) interest in visiting; and 4) desire to visit (Hapsara & Ahmadi, 2023).
A person's relationship or understanding of something, or what is usually called the level of familiarity, has a positive influence on a person's interest in visiting (Tan & Wu, 2016). The concept of familiarity itself consists of awareness, knowledge, experience (Sharifpour et al., 2014)and experience (Hutchinson & Waters, 1987). Familiarity is often conceptualized as the extent to which a person has interacted with a product or place before. For example, educational knowledge gained through films or TV programs related to a particular location can influence intention to visit that place. Furthermore, a person's subjective knowledge of a destination is also an important factor in the decision to visit. Several previous studies have shown that tourists' behavioral intentions are also influenced by their emotional connection to a destination. This, in turn, influences future intention to visit (Tan & Wu, 2016).
RESEARCH METHODS
The method used is quantitative with an experimental approach. Two types of data were used in this study: primary data and secondary data. Primary data were obtained from experiments conducted on respondents and collected through questionnaires. Secondary data were collected from literature studies of various journals, books, and offline and online news sites.
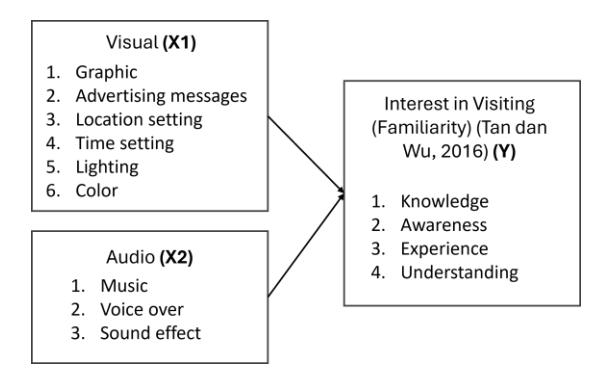
Figure 1 Visual (X1), Audio (X2), and Visiting Interest (Y) Variables
This study has three variables, namely visual elements (X1), audio elements (X2), and visiting interest (Y). The experiment was conducted by testing the visual and audio aspects as independent variables and their effect on familiarity for visiting interest as the dependent variable.
Data were collected in stages, starting with literature review, validity and reliability testing, and continuing with the core experiment. The questionnaire used in the pilot experiment and the main experiment employed a Likert scale with a score range of 1 to 4. A score of 1 represents "strongly
disagree," a score of 2 represents "disagree," a score of 3 represents "agree," and a score of 4 represents "strongly agree." Respondents' levels of agreement and disagreement were measured based on this Likert scale. This was used to determine the perception of visiting interest (familiarity) due to the influence of the use of virtual reality-based 360 video techniques in tourism advertising. The questionnaire questions were designed by the researcher based on existing theories. After the data were collected, they were processed using the SPSS application, then analyzed and discussed descriptively using the theory of familiarity on visiting interest (Sharifpour et al., 2014).
Research Object
The video, titled "Bandung 360 Virtual Tour," is the object of this research. The video, accessible on the Ministry of Tourism and Creative Economy's YouTube channel, is 6:25 minutes long and was first uploaded on September 12, 2020. It depicts the natural beauty of Situ Patenggang, located in Rancabali, Ciwidey, South Bandung.
The video was chosen as the research object because Bandung is a prime destination for domestic tourists. According to data from the Bandung City Culture and Tourism Office (2024), the number of domestic tourists visiting Bandung in 2023 reached 7.7 million. However, the Situ Patenggang or Ciwidey tourist attraction is only used as an intermediate destination or stopover before heading to the main tourist destination.
Research Subjects
The subjects of this study are Generation Y or millennials and Gen Z. This is based on data released by the Central Statistics Agency (BPS) in 2023, 69.90% of domestic tourists come from the millennial generation (25-44 years) and 17.99% come from generation Z (<25 years). (Badan Pusat Statistik, 2024). Millennials travel frequently due to their financial independence and prioritize quality service during their travels. Compared to Generation Z, they prioritize affordability when it comes to accommodations, as their parents still cover the costs.
The Millennial Generation is the generation born between 1980 and 1994 (Berkup, 2014). Generation Z was born between 1995-2015 (Dwidienawati & Dandasari, 2018). In 2024, the Millennial Generation will be aged between 30-44 years and Generation Z will be aged 9-29 years, so the subjects of this study will come from the 9-44 year age group.
RESULTS AND DISCUSSION
Results
The experiment was conducted with 30 respondents. Most of the respondent samples were female (53%), aged 19 and 20 years (27%), had a bachelor's degree/diploma 4 (73%), worked as students (70%), had an income < 1,000,000 (53%), had an average frequency of traveling 1-2 times (77%), did not know the Situ Patenggang tourist attraction (57%), and had never visited the Situ Patenggang tourist attraction (80%).
The experiment began with respondents watching a 360-degree promotional video about the Situ Patenggang tourist attraction. Respondents then provided feedback on the video. The questionnaire used underwent validity and reliability testing.
Validity testing was conducted by correlating the score of each item with the total score using the Product Moment Correlation technique. The criteria used were if the correlation coefficient (rxy) was greater than the rtable value of the Product Moment, then the item in the questionnaire was declared valid and legitimate as a data collection instrument. In the validity test with a sample size of n = 30 and a significance level (α = 0,05), it is known that the r table value for degrees of freedom (df) 28 is 0.361.
Based on the rxy correlation value for each question element in variable X1, the minimum value is 0.332. In variable X2, the minimum rxy correlation value is 0.690. As for the dependent variable Y, the minimum correlation value is 0.689. Based on the minimum values obtained, it is known that the score for each statement has a significant correlation with the total score. This is indicated by the minimum calculated r value for each statement which is greater than the table r value. Therefore, it can be concluded that all statement items in the instrument are valid and suitable for use as data collection tools in this study.
The questionnaire reliability test was conducted using the Cronbach's Alpha formula. The test criteria state that if the Cronbach's Alpha value is greater than 0.6, the questionnaire items are considered reliable. A summary of the questionnaire reliability interpretation, according to the SPSS output, is shown in the table below.
Table 1 Reliability Analysis Results
| Variable | Alpha | Description | |
| Cronbach | |||
| Visual (X1) | 0.807 | Reliable | |
| Audio (X2) | 0.852 | Reliable | |
| Interest in | 0.916 | Reliable | |
| Visiting (Y) | |||
Based on the table above, the Cronbach's Alpha value for all variables exceeds 0.6. This indicates that all variable items in the study are stable and consistent due to their excellent reliability, making them valid and suitable for use as data collection instruments.
The questionnaire was taken with a class interval of 0.75 on a Likert scale measurement of 1 to 4, which shows the respondents' agreement with the variables asked.
After conducting validity and reliability tests, the next step is to conduct classical assumption tests. Classical assumption tests
consist of normality tests, multicollinearity tests, and heteroscedasticity tests.
The normality test is used to determine whether the independent and dependent variables have a normal distribution. A good regression is one whose data is normally or nearly normally distributed.
The results of the normality test can be seen from the Test of Normality, Kolmogorov-Smirnov Test in the Sig. section.
Basis for Decision Making:
- o If the probability value (Sig.) is <0.05, then the distribution is not normal.
- o If the probability value (Sig.) is >0.05, then the distribution is normal.
Table 2 Normality Test Results
| One-Sample Kolmogorov-Smirnov Test | |||||
|---|---|---|---|---|---|
| Unstandar dized | |||||
| Residual | |||||
| N | 30 | ||||
| Normal Parametersa,b | Mean | 0 | |||
| Std. Deviation | 3.172945 | ||||
| Most Extreme | Absolute | 0.12 | |||
| Differences | Positive | 0.12 | |||
| Negative | -0.116 | ||||
| Test Statistic | 0.12 | ||||
| Asymp. Sig. (2-tailed) | .200c,d | ||||
- a. Test distribution is Normal. (Test distribution is normal)
- b. Calculated from data. (Calculated from data)
- c. Lilliefors Significance Correction. (Lilliefors Significance Correction)
- d. This is a lower bound of the true significance. (This is the lower limit of true significance.)
The significance value of the Normality Test table is 0.200, so the null hypothesis is accepted, that the variables used are normally distributed because the probability value (Sig.) > 0.05.
Multicollinearity Testing
Multicollinearity testing is performed by examining the Tolerance and Variance Inflation Factor (VIF) values to identify significant similarities between the independent variables in a model. Multicollinearity problems arise when there is a very strong relationship or influence between two or more independent variables. If the VIF value of an independent variable is less than 10, then there is no multicollinearity. Conversely, if the VIF value is greater than 10, it indicates the presence of multicollinearity. The analysis yielded the following results:
Table 3 Multicollinearity Test Results
| Coefficients* | ||||||||
|---|---|---|---|---|---|---|---|---|
| Model | Unstandardized Coefficients (B) | Unstandardized Coefficients (Std. Error) | Standardized Coefficients (Beta) | Sig. | Collinearity (Tolerance) | Collinear | ||
| WOOL | (Cons | coefficients (b) | (Sta. Error) | (beta) | 515. | (Tolerance) | icy (vii ) | |
| 1 | tant) | -2.107 | 8.2 | -0.257 | 0.799 | |||
| X1 | 0.453 | 0.194 | 0.403 | 2.335 | 0.027 | 0.812 | 1.232 | |
| X2 | 0.5 | 0.297 | 0.29 | 1.684 | 0.104 | 0.812 | 1.232 | |
Variables X1 and X2 each have tolerance values less than 1 and greater than 0.10. The Variance Inflation Factor (VIF) ranges from 1 to 10. This indicates no indication of multicollinearity among these variables.
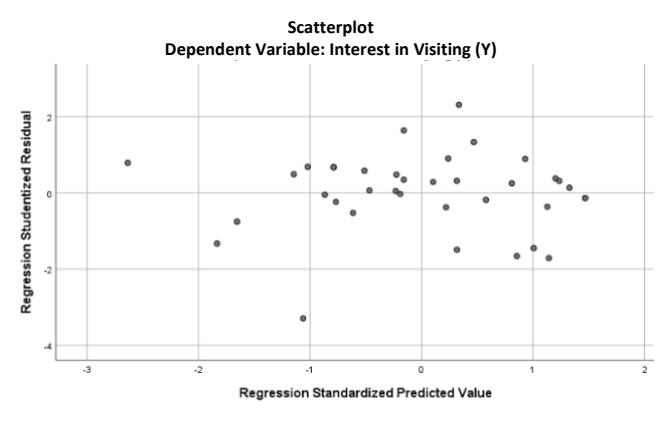
Figure 2 Heteroscedasticity Test Results
The heteroscedasticity test results graph shows a random distribution of points without forming any specific pattern. Based on these results, it can be concluded that there is no indication of heteroscedasticity, so the regression model can be considered suitable for use.
The data obtained from respondents' answers were analyzed using multiple regression methods to measure the extent to which the independent variables, namely visual and audio, influence the tendency of interest in visiting the Situ Patenggang tourist attraction.
Multiple regression analysis is used to measure the extent to which the independent variables X1 and X2 influence the dependent variable Y. The results of this analysis are presented in Table 3. From the data in Table 3, the following regression equation is obtained:
\[Y = -2,107 + 0,453X_1 + 0,500X_2\]
In the equation, where X1 is the independent visual variable, and X2 is the independent audio variable. The constant Y value of -2.107 can be considered that the variables X1 and X2 are equal to 0 (zero), then the negative value means that if there is no Visual (X1) and Audio (X2) then there is also no Visiting Interest (Y).
The regression coefficient of X1 of 0.453 indicates that variable X1 has a positive influence (unidirectional relationship) on variable Y. Thus, every increase of 1 unit in X1 will cause an increase of 0.453 in Y.
In line with the X1 coefficient, the X2 regression coefficient value of 0.500 indicates that the X2 variable has a positive influence (unidirectional relationship) on the Y variable. This means that every 1 unit increase in X2 will result in an increase of 0.500 in Y.
The hypothesis regarding the influence of variables X1 and X2 on the interest in visiting Y was tested using the coefficient of determination (R²) and the F test. The coefficient of determination is a measure that shows the extent to which the model is able to explain the variations that occur in the dependent variable. The value of the coefficient of determination ranges from zero to one. A low R² value indicates that the independent variables have limitations in explaining the variations in the dependent variable. Conversely, an R² value close to one indicates that the independent variables almost completely provide the information needed to predict the variations in the dependent variable.
Table 4 Coefficient Of Determination Results
| Model Summary | ||||||
|---|---|---|---|---|---|---|
| Std. | ||||||
| Error of | ||||||
| Adjusted | the | |||||
| Model | R | R Square | R Square | Estimate | ||
| 1 | 0.59 | 0.348 | 0.3 | 3.28836 | ||
| a. Predictors: (Constant), X2, X1 | ||||||
Dari tabel 4, nilai koefisien determinasi (Adjusted R Square) sebesar 0,348. Artinya 34,8% Variabel Y dipengaruhi oleh variabel X1 dan X2, sedangkan sisanya sebesar 65,2%
dipengaruhi oleh faktor-faktor lain yang tidak dimasukkan dalam penelitian ini.
The F test is used to test whether the variables X1 and X2 jointly influence Y. A summary of the F test results can be seen in table 5.
Table 5 F Test Results
| ANOVAa | ||||||||
|---|---|---|---|---|---|---|---|---|
| Sum of Mean | ||||||||
| Model | Squares | df | Square | F | Sig. | |||
| 1 | Regression | 155.907 | 2 | 77.953 | 7.209 | 0.003 | ||
| Residual | 291.96 | 27 | 10.813 | |||||
| Total | 447.867 | 29 | ||||||
| a. Dependent Variable: Y | ||||||||
b. Predictors: (Constant), X2, X1
From table 5, the calculated F value is 7.209 with a significance of 0.003, meaning that the F significance is less than 0.05, indicating that variables X1 and X2 jointly influence Y. The conclusion is that H1 is accepted.
Visual (X1) and Audio (X2) simultaneously influence Visiting Interest (Y). To test the partial regression coefficient, a ttest was conducted. The results of the t-test are shown in Table 3.
In table 3, it can be observed that variable X1 has a significance value of 0.027, which is smaller than 0.05, thus indicating a significant influence of variable X1 on variable Y. Partially, Visual (X1) is proven to influence Visiting Interest (Y), where an increase in Visual quality (X1) is directly proportional to an increase in Visiting Interest (Y).
Variable X2 has a t-significance value of 0.104, which is greater than 0.05, thus
indicating that variable X2 has a positive but insignificant effect on variable Y. In other words, Audio (X2) is not partially proven to influence Visiting Interest (Y). Although it has a positive relationship, the effect is not statistically strong enough.
Discussion
The visual elements (X1) in this study consist of graphic elements, advertising messages, place settings, time settings, lighting, and color. Graphic elements include images, text, symbols, and animation. Advertising messages include persuasive information displayed to attract audience interest. Place setting elements include the location or environment of the tourist attraction used as a case study. Time setting elements indicate the time period shown, such as during the day or morning. Lighting elements include light settings with the aim of creating visual dimension, depth, and emphasis on objects. Color elements can create an atmosphere of contrast, harmony, and mood in the video.
The audio element (X2) consists of music, voice-overs, and sound effects. The interest in visiting (familiarity) element (Y) consists of knowledge, awareness, experience, and understanding.
The analysis found that visual elements influence perceptions of intention to visit. Familiarity with intention to visit has been shown to better convey the image of a tourist
destination (Kerstetter & Cho, 2004). The right visuals and audio provide a more immersive experience for the audience. This demonstrates the importance of integrating visual and audio elements in tourism promotion for effective use.
This study also shows that the use of VR significantly enhances the effectiveness of visual and audio elements in tourism promotion. Visual elements, supported by VR, can provide immersive experiences. Audiences can experience 3D and visual experiences that resemble a real visit. Audio elements, supported by VR, can create an engaging experience and convey a sense of atmosphere, especially if the audio is used in harmony with the visuals. However, when used alone, audio does not have a significant impact on visitor interest.
The use of VR in tourism promotional videos can not only convey visual and audio content better, but can also increase audience familiarity in an innovative way, increasing the perception of visitor interest.
CONCLUSION
The conclusion is that the experience of watching a 360° video advertisement about the Situ Patenggang tourist attraction has an influence on the familiarity of tourists' interest in visiting. Visual elements (X1) and audio (X2) show a positive influence on the perception of tourists' interest in visiting. Compared to audio elements, visual elements have a greater
influence on interest in visiting. Therefore, in the future, it is advisable to pay greater attention to visual elements when creating 360 tourism advertising videos, to obtain effective results.
This research is experimental in nature and is heavily influenced by the data and respondents, both in terms of quantity and quality. This study used statistical methods to ensure the validity and reliability of the data. However, to improve data quality, the collection method could be expanded, with respondent criteria specified, and comparisons could be made with alternative methods to ensure the validity of larger data sets and a broader target audience.
BIBLIOGRAPHY
- Ajzen, I., & Fishbein, Ma. (2005). The handbook of Attitudes. Mahwah.
- Badan Pusat Statistik. (2024). Statistika Wisatawan Nasional 2023 (Vol. 3). Badan Pusat Statistik.
- Beck, J., Rainoldi, M., & Egger, R. (2019). Virtual reality in tourism: a state-ofthe-art review. Tourism Review, 74(3), 586–612. https://doi.org/10.1108/TR-03- 2017-0049
- Belch, G. E., & Belch, M. A. (2003). Advertising and Promotion, And Integrated Marketing Communication Perspective (6th Edition). McGraw Hill.
- Berkup, S. B. (2014). Working With Generations X And Y In Generation Z Period: Management Of
- DifferentGenerations In Business Life. Mediterranean Journal of Social Sciences.
- Bigne, E., & Maturana, P. (2023). Does Virtual Reality Trigger Visits and Booking Holiday Travel Packages? Cornell Hospitality Quarterly, 64(2), 226–245. https://doi.org/10.1177/19389655 221102386
- Dwidienawati, D., & Dandasari, D. (2018). Understanding Indonesia's Generation Z. International Journal of Engineering & Technology.
- Flavián, C., Ibáñez-Sánchez, S., & Orús, C. (2019). The impact of virtual, augmented and mixed reality technologies on the customer experience. Journal of Business Research, 100, 547–560. https://doi.org/10.1016/j.jbusres.2 018.10.050
- Guttentag, D. A. (2010). Virtual reality Applications and Implications for Tourism. Tourism Management, 31, 637–651.
- Hapsara, O., & Ahmadi, A. (2023). Analisis Keputusan Berkunjung Melalui Minat Berkunjung: Citra Destinasi Dan Aksesibilitas Pada Geopark Merangin Jambi. Jurnal Manajemen Terapan Dan Keuangan, 11(1), 64– 67.
- Hartini, S., Cathleya, & Sukaris. (2020). Virtual Reality: Aplikasi Teknologi Untuk Peningkatan Kunjungan Wisatawan. Jurnal Business and Banking, 9(2), 215–227.
- Hutchinson, T., & Waters, A. (1987). English for Specific Purposes: A
- Learner-Centered Approach. Cambridge University Press.
- Irmadhani, & Nugroho, M. A. (2012). Pengaruh Persepsi Kebermanfaatan, Persepsi Kemudahan Penggunaan dan Computer Self Efficacy, Terhadap Penggunaan Online Banking pada Mahasiswa S1 Fakultas Ekonomi Universitas Negeri Yogyakarta. Kajian Pendidikan dan Akuntansi. Kajian Pendidikan Dan Akuntansi Keuangan, 1(3), 1–20.
- Jaiz, M. (2014). Dasar-Dasar Periklanan. Graha Ilmu.
- KEMENPAREKRAF. (2021). Tren Industri Pariwisata 2021.
- Kerstetter, D., & Cho, M. (2004). Prior knowledge, credibility and information search. Annals of Tourism Research, 31(4), 961–985.
- Khaqiqi, S., & Alfansi, L. (2022). Penerimaan Teknologi Virtual Reality Untuk Virtual Tourism di Indonesia. Journal of Indonesian Tourism, Hospitality and Recreation, 5(1), 53–66.
- Kinnear, T. C., & J. R. Taylor. (2003). Riset Pemasaran. (Terjemahan oleh Thamrin) Edisi 3. Erlangga.
- Kotler, P. (2006). Manajemen pemasaran, jilid I (11th ed.). P.T Indeks Gramedia.
- Loureiro, S. M. C., Guerreiro, J., & Ali, F. (2020). 20 years of research on virtual reality and augmented reality in tourism context: A textmining approach. Tourism Management, 77, 104028.
- https://doi.org/10.1016/j.tourman. 2019.104028
- Muflih, M. (2006). Perilaku Konsumen dalam Perspektif Ilmu Ekonomi Islam. PT. Raja Grafindo Persada.
- Nakamura, K. (2021). Experimental analysis of walkability evaluation using virtual reality application. Environment and Planning B: Urban Analytics and City Science, 48(8), 2481–2496. https://doi.org/10.1177/23998083 20980747
- Purnama, B. E. (2013). Konsep Dasar Multimedia. Graha Ilmu.
- Rauscher, M., Humpe, A., & Brehm, L. (2020). Virtual Reality in Tourism: Is it 'Real' Enough? Academica Turistica, 13(2), 127–138. https://doi.org/10.26493/2335- 4194.13.127-138
- Sciffman, & Kanuk. (2007). Perilaku Konsumen (2nd ed.). PT, Indeks Gramedia.
- Sharifpour, M., Walters, G., & Ritchie, B. (2014). Risk perception, prior knowledge, and willingness to travel: Investigating the Australian tourist market's risk perceptions towards the Middle East. Journal of Vacation Marketing, 20(2), 111– 123.
- Spillane. (1987). Pengertian Pariwisata. Angkasa.
- Suhartapa, S., & Sulistyo, A. (2021). Pengaruh Persepsi dan Motivasi Wisatawan Terhadap Minat Kunjung Ulang di Pantai Baru Yogyakarta. Khasanah Ilmu - Jurnal Pariwisata Dan Budaya, 12(2), 115–
122. https://doi.org/10.31294/khi.v12i2 .10579
- Suhendar, A., & Fernando, A. (2016). Aplikasi Virtual tour Berbasis Multimedia Interaktif Menggunakan Autodesk 3Ds Max. ProTekInfo (Pengembangan Riset Dan Observasi Teknik Informatika), 3, 30–35.
- Tan, W.-K., & Wu, C.-E. (2016). An investigation of the relationships among destination familiarity, destination image and future visit intention. Journal of Destination Marketing & Management, 5(3), 214–226.
- Tussyadiah, I. P., Wang, D., & Jia, C. (2017). Virtual Reality and Attitudes Toward Tourism Destinations. In Information and Communication Technologies in Tourism 2017 (pp. 229–239). Springer International Publishing. https://doi.org/10.1007/978-3- 319-51168-9_17
- Waraney, S. P. F., Tulenan, V., & Sinsuw, A. A. E. (2017). Pengembangan Virtual Tour Potensi Wisata Baru Di Sulawesi Utara Menggunakan Teknologi Video 360 Derajat. Jurnal Teknik Informatika, 12(1), 1–8.
- Wibisono, N., Rafdinal, W., Setiawati, L., & Juniarti, C. (2023). ADOPSI TEKNOLOGI VIRTUAL REALITY (VR) PADA INDUSTRI PARIWISATA (1st ed.). Madza.
- Yusrin, N. A., & Sugianto, N. (2021). Analisis Hubungan Enjoyment, Entertainment, Education, Flow Dan Design Background Dalam
Virtual Tourism Selama Covid-19. Ultima Management : Jurnal Ilmu Manajemen, 13(1), 99–122.